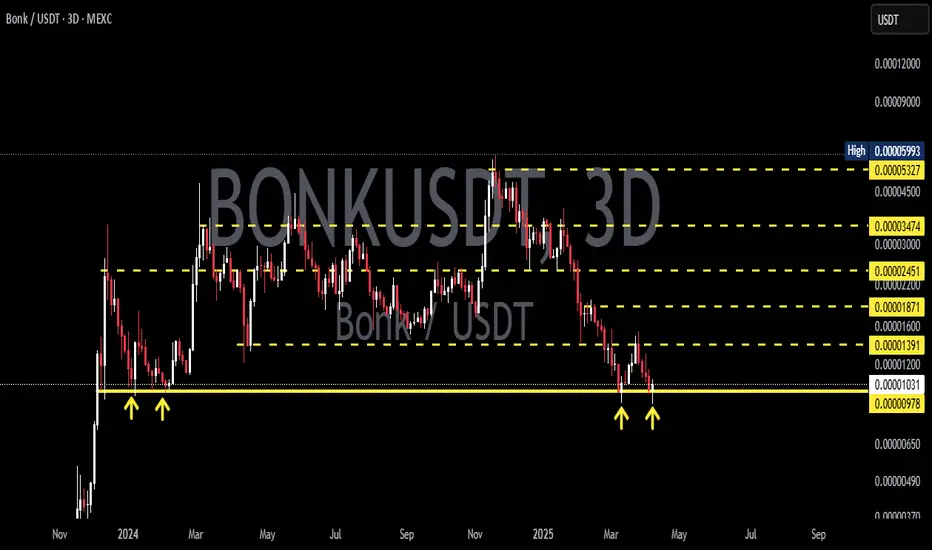
BONKUSDT – Let the Market Come to YouIn a possible Q3 correction, BONKUSDT may retest the green box zones below.
These areas are not predictions — they’re prepared zones where I’ll be waiting, not chasing.
🟩 I don’t buy strength blindly. I buy value with structure.
All risk-on markets typically experience significant corrections in the third quarter of the year and struggle to recover from this correction until the end of the year.
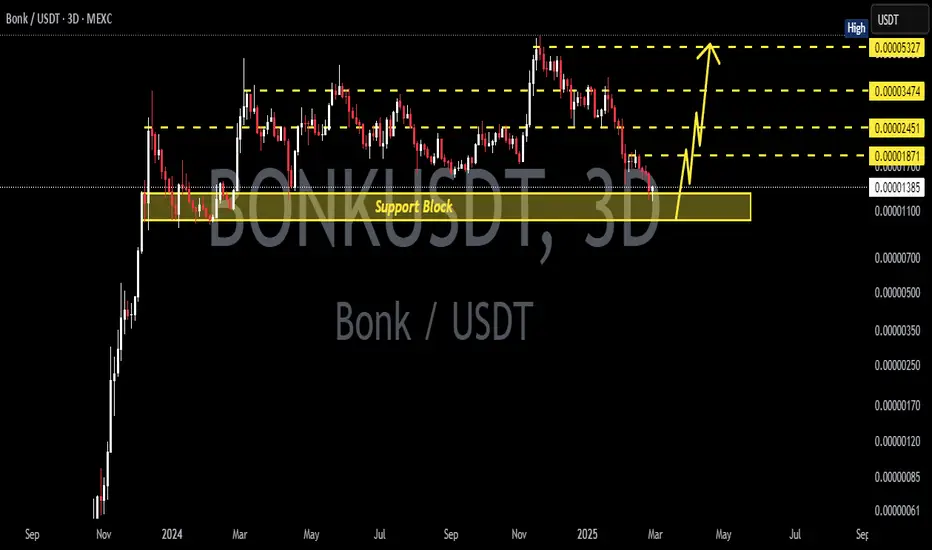
🎯 My Strategy
🔔 Set alerts for the green boxes
🕐 Switch to the 1-hour timeframe when triggered
📈 Wait for upward breakout + positive CDV
🎯 Only then: take the shot — one bullet, risk-managed
“Markets reward those who wait with a plan, not those who rush with emotion.”
Let’s stay patient, structured, and consistent.
— UmutTrades 💙
📌I keep my charts clean and simple because I believe clarity leads to better decisions.
📌My approach is built on years of experience and a solid track record. I don’t claim to know it all but I’m confident in my ability to spot high-probability setups.
📌If you would like to learn how to use the heatmap, cumulative volume delta and volume footprint techniques that I use below to determine very accurate demand regions, you can send me a private message. I help anyone who wants it completely free of charge.
🔑I have a long list of my proven technique below:
🎯 ZENUSDT.P: Patience & Profitability | %230 Reaction from the Sniper Entry
🐶 DOGEUSDT.P: Next Move
🎨 RENDERUSDT.P: Opportunity of the Month
💎 ETHUSDT.P: Where to Retrace
🟢 BNBUSDT.P: Potential Surge
📊 BTC Dominance: Reaction Zone
🌊 WAVESUSDT.P: Demand Zone Potential
🟣 UNIUSDT.P: Long-Term Trade
🔵 XRPUSDT.P: Entry Zones
🔗 LINKUSDT.P: Follow The River
📈 BTCUSDT.P: Two Key Demand Zones
🟩 POLUSDT: Bullish Momentum
🌟 PENDLEUSDT.P: Where Opportunity Meets Precision
🔥 BTCUSDT.P: Liquidation of Highly Leveraged Longs
🌊 SOLUSDT.P: SOL's Dip - Your Opportunity
🐸 1000PEPEUSDT.P: Prime Bounce Zone Unlocked
🚀 ETHUSDT.P: Set to Explode - Don't Miss This Game Changer
🤖 IQUSDT: Smart Plan
⚡️ PONDUSDT: A Trade Not Taken Is Better Than a Losing One
💼 STMXUSDT: 2 Buying Areas
🐢 TURBOUSDT: Buy Zones and Buyer Presence
🌍 ICPUSDT.P: Massive Upside Potential | Check the Trade Update For Seeing Results
🟠 IDEXUSDT: Spot Buy Area | %26 Profit if You Trade with MSB
📌 USUALUSDT: Buyers Are Active + %70 Profit in Total
🌟 FORTHUSDT: Sniper Entry +%26 Reaction
🐳 QKCUSDT: Sniper Entry +%57 Reaction
📊 BTC.D: Retest of Key Area Highly Likely
📊 XNOUSDT %80 Reaction with a Simple Blue Box!
📊 BELUSDT Amazing %120 Reaction!
📊 Simple Red Box, Extraordinary Results
📊 TIAUSDT | Still No Buyers—Maintaining a Bearish Outlook
📊 OGNUSDT | One of Today’s Highest Volume Gainers – +32.44%
📊 TRXUSDT - I Do My Thing Again
📊 FLOKIUSDT - +%100 From Blue Box!
📊 SFP/USDT - Perfect Entry %80 Profit!
📊 AAVEUSDT - WE DID IT AGAIN!
I stopped adding to the list because it's kinda tiring to add 5-10 charts in every move but you can check my profile and see that it goes on..
Bonkusdtsignals

Bonk USDT Buy / Long SetupBonk performing well among all meme sectors, wait for the entry and take risk, if tp hits first then ignore. I already shared this setup on my group, we closed the trade at minor profit, but now this is showing strong momentum on 1hr tf also, that's why sharing.

BONKUSDT 1D AnalysisBONK ~ 1D Analysis
#BONK Buy on retesting this support block or buy after successfully breaking this resistance line with a short term target of at least 15%+ and a long term target of $0.000065+

BONKUSDT 3DBONK ~ 3D Analysis
#BONK Important support that must be maintained for now. bouncing from here a short -term target of at least 15%+.
BONKUSDT 3DBONK ~ 3D Analysis
#BONK Buy gradually from here if you still have a Conviction on this coin.
Reason, This support block is still maintained.
BONKUSDT Triangle Pattern!BONKUSDT technical analysis update
CRYPTOCAP:BONK price is breaking out of a triangle pattern on the daily charts. The price has been trading within this triangle pattern for the past year. If the breakout is confirmed, we can expect a strong bullish move. Over the last few days, there has been an increase in volume, which is also considered a bullish sign for BINANCE:BONKUSDT

BONKUSDT Ready for Big PUMP!!!BINANCE:BONKUSDT has recently broken out and successfully retested a previous resistance level, showing signs of strength. Now, it’s attempting to break out of a triangle pattern, with the resistance line acting as a key barrier. If it manages to break through, a significant upward move could be on the horizon, fueled by the ongoing memecoin craze. However, caution is advised—consider using only a small portion of your capital to manage risk in this volatile environment.
BINANCE:1000BONKUSDT.P Currently trading at $0.000036
Buy level: Above $0.000033
Stop loss: Below $0.0000262
Max Leverage 3x
Always keep Stop loss
Follow Our Tradingview Account for More Technical Analysis Updates, | Like, Share and Comment Your thoughts

BONKUSDT 3DBONK ~ 3D
#BONK Buy gradually inside this pattern,. Minimum target 20%++.
it is only a matter of time until this pattern is broken and the Bulls dominate.

BONKUSDTBONK ~ 3D
#BONK Make purchases gradually in this pattern. It is only a matter of time until this pattern breaks out and the bulls return quickly

BONKUSDTBONK ~ 2D
#BONK need patience until this pattern is successfully penetrated. and the bulls will return soon.
The best way for now, wait until this pattern is successfully broken and our buy button will start to light up

BONKUSDT - UniverseMetta - Analysis#BONKUSDT - UniverseMetta - Analysis
On D1, the price may push off from the lower border of the channel and begin an upward trend. From the border you can see rebounds of 30% - 80%, which indicates the presence of buyers.
On H4, for confirmation, you can wait for the formation of a 3-wave structure along the trend and consider buying. You should be careful if an ABC or 3-wave structure in the opposite direction is formed (the presence of a 5th wave down), the price may make a false breakout and update the low again.
Target: 0.00002355 - 0.00003392

BONKUSDT 1DBONK ~ 2D
CRYPTOCAP:BONK We are still bullish on this $Meme.
We consider buying inside this pattern. target at least 15%+ from here.

BONKUSDT 2DBONK ~ 2D
SEED_DONKEYDAN_MARKET_CAP:BONK We are still bullish on this $Meme.
We consider buying inside this pattern. target at least 15%+ from here.

BONK surges 10%. Will the rally sustain?BONK’s price was bearish in the early hours of the day before support was established at the intra-day low of $0.00002. However, with the announcement of the treasury proposing an 84 billion token burn, the digital asset witnessed a 10% surge, reshaping investor sentiment and market trend.
This strategy is part of a broader effort to enhance token scarcity and increase its value over time. This can be considered as the turning point for BONK since decreasing the supply is usually positive for the investors. This burn according to the announcement represents the q2 amount of BONK sent to the DAO from BONKBot.
In April, the BONK Decentralized Autonomous Organization (DAO) had already set a precedent for such impactful decisions. The DAO passed a proposal to burn a staggering 278.39 trillion BONK, with the community vote showing overwhelming support: 418.63 trillion votes in favor, representing 99.9% approval.
The technical indicators on the BONKUSDT price chart point to continued bullish momentum. The Money Flow Index (MFI) rating of 68 suggests that money flows in the BONK market may sustain a bullish rally.
In addition, the Moving Average Convergence Divergence (MACD) has shifted into the positive region and above its signal line, reflecting a strengthening bullish trend. Moreover, the histogram developing higher bars suggests that buying pressure is increasing.
Concurrently, with a Relative Strength Index (RSI) rating of 67, this bullish momentum will likely trend upwards, with a potential target of $0.00003600 after hitting a double-bottom pattern on the 4-hour price chart.

BONKUSDT - UniverseMetta - Analysis#BONKUSDT - UniverseMetta - Analysis
On D1, the price may push off from the lower border of the channel and begin an upward trend. From the border you can see a rebound of 30%, which indicates the presence of buyers.
On H4, for confirmation, you can wait for the formation of a 3-wave structure along the trend and consider buying. You should be careful if an ABC or 3-wave structure is formed, the price may make a false breakout and update the low again.
Target: 0.00002525 - 0.00003378

BONKUSD 2DBONK ~ Updated
#BONK It seems BONK is ready to break through the resistance line of this pattern. Note, If this happens, the Bulls will start to dominate from here.

BONKUSD 2DBONK ~ 2D
#BONK It's interesting to pay attention to the AMEX:MEME season.
This is one of the interesting SPARKS:MEMES in 2D Chart.
if you are interested. make purchases after breaking through the resistance line of this pattern, or make purchases gradually within this pattern.

BONK/USDT Break Alert! Potential back to upward after retesting!💎 Paradisers, the recent market dynamics surrounding #BONK have indeed been noteworthy.
💎 After encountering resistance in the recent trading sessions, BONK is now poised for a potential retest of the support level. This retracement is a common occurrence following a breakout of a descending resistance area. The indicator tool MACD is the golden cross which means the price will switch to the bullish.
💎 During this retest phase, it's crucial for BONK to bounce from the support level around 0.00227. A successful bounce would signal strength and readiness to attempt another breakout of the resistance.
💎 If BONK manages to break above this resistance level, it would signify a return to bullish sentiment, with potential for further upward movement towards our target strong resistance area.
💎 However, if BONK fails to bounce from the support area and instead breaks below it, the next likely stop is the Bullish OB area. Historically, BONK has demonstrated the ability to bounce back from this zone and reclaim support.
💎 Nevertheless, if BONK fails to find support even at the Bullish OB area, it would raise concerns about the bullish trend. A candle closing below the Bullish OB area could invalidate the bullish scenario, signaling potential further downward movement.
MyCryptoParadise
iFeel the success🌴
