Gold 29 July – H4 Demand Holds, M15 Structure ShiftsGold (XAUUSD) Analysis – 29 July
The Mirror is Forming at 3310: Structure + Reaction in Focus
The market has successfully held the H4 demand zone, particularly near the critical level around 3310. This level is not just another number on the chart — it’s an inflection point. A possible first higher low or swing low, from which the next directional leg in gold could emerge.
Yesterday’s price action swept liquidity beneath this zone and then showed a strong bullish reaction. This isn’t just a bounce. It’s a behavioral shift — one that hints at absorption of selling pressure and the re-entry of aggressive buyers.
🔍 Structure Alignment: H4 + M15
On the H4 timeframe, price has stabilized within the demand zone.
Zooming into M15, we now see internal price action beginning to shift:
• First, a Change of Character (ChoCH) — the earliest clue that momentum is starting to turn.
• Then, a Break of Structure (BoS) to the upside — signaling potential bullish intent.
This multi-timeframe alignment — H4 support holding + M15 structure shifting — builds a strong case for a potential reversal and continuation of the uptrend.
📍 What Next?
The next step is to mark a refined M15 Point of Interest (POI) — a zone where price may pull back before making its next move upward.
We don’t chase price. We let it come to us.
✅ Look for Lower Timeframe Confirmation
Once price returns to your POI, it’s time to observe.
You’re not looking for obvious signals. You’re watching for subtle behavior —
a sharp reaction, a psychological flush, or a precise candle footprint that reveals intent.
The deeper signals aren’t always visible to the untrained eye — but they’re there for those who’ve studied the mirror.
( For those who know what to look for — this is where the sniper entry reveals itself. )
🎯 Summary
• Bias: Bullish — structure and reaction support long setups
• Plan: Wait for price to retest the M15 POI
• Execution: Only enter on confirmed lower timeframe intent and confluence
• Target: 120 pips (fixed, as per system)
• Stop Loss: 40 pips (always 1:3 R:R minimum)
📚 This is the kind of structure-based clarity we teach in The Chart is the Mirror .
Let the chart speak.
Let the structure guide you — not your emotion.
📘 Shared by @ChartIsMirror
BOS

Trend Exhaustion Detected – Bearish Structure AheadUS100 (NASDAQ) 30-minute chart as of July 26, 2025, with technical insights based on the visible elements.
🔍 1. Trend Analysis
Primary Trend: Uptrend (bullish structure)
The price has been respecting a rising parallel channel, marked by:
Ascending support (lower boundary)
Ascending resistance (upper boundary)
Market structure shows:
Higher Highs (HH)
Higher Lows (HL)
✅ This indicates continuation of bullish momentum until structure breaks.
📐 2. Market Structure Elements
Structure Type Label on Chart Price Zone (approx.)
Break of Structure (BOS) BOS (center-left) ~22,950
Higher Low (HL) HL (2x) ~22,700 (1st), ~23,050 (2nd)
Higher High (HH) HH (2x) ~23,150 and ~23,300
Resistance Labelled ~23,300–23,320
Demand Zones Labelled ~22,450–22,700
🔁 Break of Structure (BOS)
The BOS occurred after a prior swing low was broken, followed by a new higher high, confirming a bullish shift.
🧱 3. Support / Resistance Analysis
🔼 Resistance Zone
The price is testing strong resistance around 23,300–23,320
Multiple rejections in this area
Trendline resistance also aligns here
A rejection arrow is drawn, indicating potential bearish reaction
🔽 Support Zone (Immediate)
23,180–23,220: highlighted green box is a local support block
If broken, likely to revisit 23,000–23,050, or even down to 22,900 range
🟩 4. Demand Zones
Zone 1:
22,450–22,600: Strong bullish reaction historically — likely to act as a key demand if a deeper pullback occurs
Zone 2:
22,850–22,950: Validated with prior accumulation & BOS event
🧠 5. Key Observations
Price is at a critical inflection zone:
Testing a resistance zone
At the upper trendline of an ascending channel
A bearish reaction is projected (black arrow)
Possibly targeting the green support zone around 23,180–23,220
If that fails, demand at ~23,000 will likely be tested
Ichimoku Cloud:
Currently price is above the cloud → still bullish
Cloud is thin → potential weakness or upcoming consolidation
⚠️ 6. Trading Bias & Setup Ideas
✅ Bullish Bias (if price holds above ~23,180)
Long entries can be considered on bullish reaction from support
Target: retest of 23,300–23,350 or even breakout continuation
❌ Bearish Bias (if breakdown below support)
Short entry valid below 23,180 with:
TP1: 23,050
TP2: 22,900
A breakdown from the ascending channel would signal trend exhaustion
🔚 Conclusion
Current Price: 23,298.4
Trend: Bullish, but at resistance
Next move: Watch for reaction at resistance and support box below
Bias: Neutral-to-bullish unless the structure breaks below ~23,180

BTC In-Depth Technical Analysis: BTC/USD (30-Min Chart)🔍 In-Depth Technical Analysis: BTC/USD (30-Min Chart)
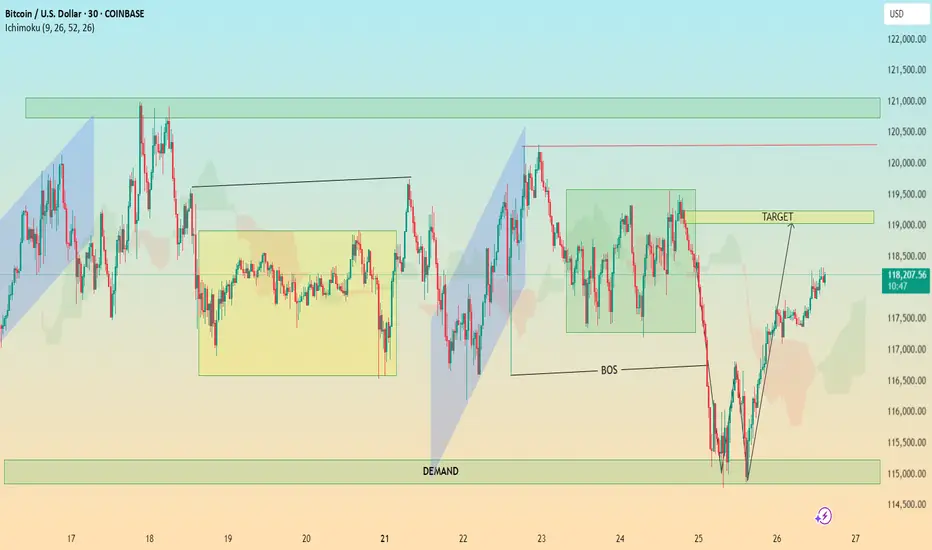
🟩 1. Demand Zone Reaction
Location: ~$114,500 – $115,500
Significance:
Price sharply reversed after a strong move into this demand zone.
This zone coincides with a liquidity grab below previous lows — textbook Smart Money trap.
Volume (if checked) would likely spike here, indicating institutional interest.
✅ Interpretation: Institutional demand stepped in, absorbing sell orders and triggering a reversal.
📉 2. Break of Structure (BOS)
Zone: Around July 24–25
Price broke below a key higher low, signaling temporary bearish structure.
However, this was quickly reclaimed after demand zone reaction — suggesting a fakeout BOS or a liquidity sweep.
✅ Interpretation: BOS caused shorts to enter, but reversal suggests a bear trap and continuation higher. The BOS served to fuel a more aggressive bullish rally.
🎯 3. Target Zone
Marked Target: ~$118,900–$119,200
Why This Area?
It aligns with a previous consolidation zone / supply before the sharp drop.
Also overlaps with Ichimoku cloud resistance and previous highs — strong confluence.
✅ Interpretation: Price is likely to face resistance here. If broken with strong momentum, bullish continuation to the next supply zone (~$121K) is possible.
⛓️ 4. Market Structure Analysis
Higher Lows Forming after demand reaction.
Price is forming a bullish market structure with an ascending wave pattern.
A break and retest of the $119K zone could lead to a mid-term rally.
Failure to break could result in:
A pullback to the $117,000 area
Or a deeper retest of the demand zone
✅ Trading Plan Options:
Bullish Bias: Buy pullbacks above $117,000 with $119,000 as target
Bearish Bias: Wait for strong rejection at $119,000 to short back to $115K
☁️ 5. Ichimoku Cloud Insight
Price has moved above the cloud, suggesting momentum shift to the upside.
The cloud is twisting bullish, supporting short-term bullish trend.
However, flat Kumo tops around $119K = likely rejection zone.
✅ Interpretation: Ichimoku confirms bullish potential, but price must close above the cloud + $119K zone to sustain trend.
📌 Key Takeaways for Publishing
Chart Idea Title:
“BTC/USD Demand Zone Reversal | Break of Structure & $119K Target in Sight”
Summary Description:
Bitcoin has reclaimed bullish momentum after a sweep into the $115K demand zone. A break of structure triggered shorts, but demand absorption led to a sharp reversal. Now, price is approaching the key $119K supply zone — a critical level that could determine if this is a short-term rally or the beginning of a new trend. Watch for either a clean breakout or a rejection for a possible retest of $117K or lower. Confluence from Ichimoku, BOS, and market structure support the analysis.
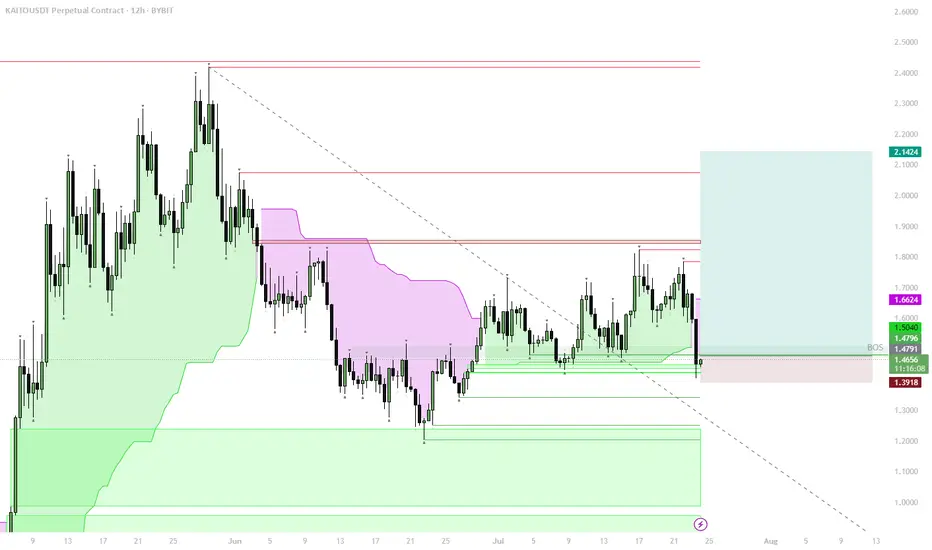
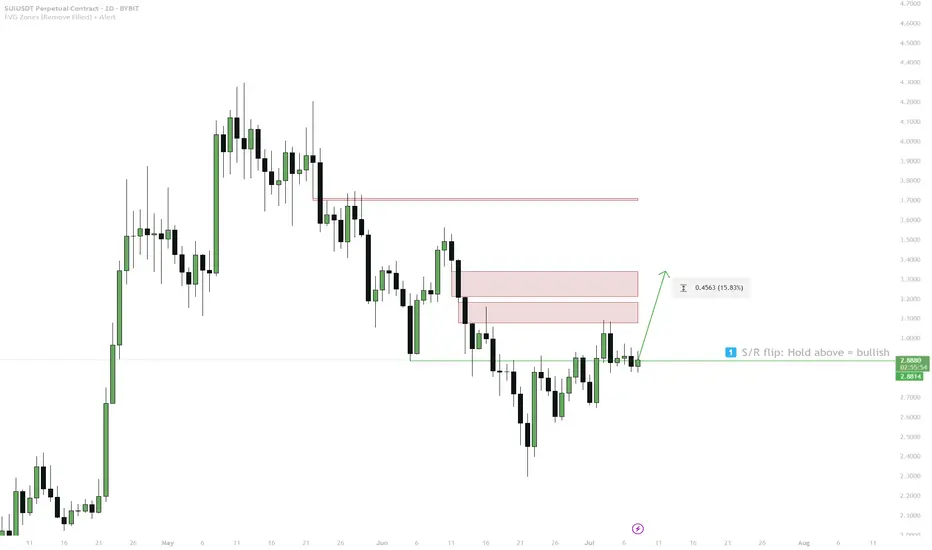
KAITO – Structural Flip, Bullish Accumulation ZoneStructural Shift:
Price reclaimed the key 1D S/R + BOS (Break of Structure) level, signaling a major trend change from bearish to bullish.
Trend Confirmation:
The move above $1.48–$1.50 zone confirms a bullish market structure. This level is now strong support.
Accumulation Opportunity:
The area between $1.65–$1.50 is ideal for spot accumulation, as it aligns with the reclaimed BOS and the lower edge of the bullish structure.
Upside Targets:
If the bullish structure holds, price could target $1.66 (local resistance), with the next targets at $1.85, $2.14, and potentially higher if momentum continues.
Invalidation:
A break and close below $1.48 would invalidate this bullish scenario and signal a return to the previous range.
The reclaim of the BOS level, with a shift above 1D S/R, marks a clear bullish structural flip on the chart. Historically, such shifts create strong accumulation zones just above the reclaimed level, where risk/reward is best for spot buys. Buying into the $1.65–$1.50 range aligns with both trend-following and classic Smart Money concepts: enter after the structural confirmation, not before. Invalidation is clear below $1.48, where structure would flip bearish again.
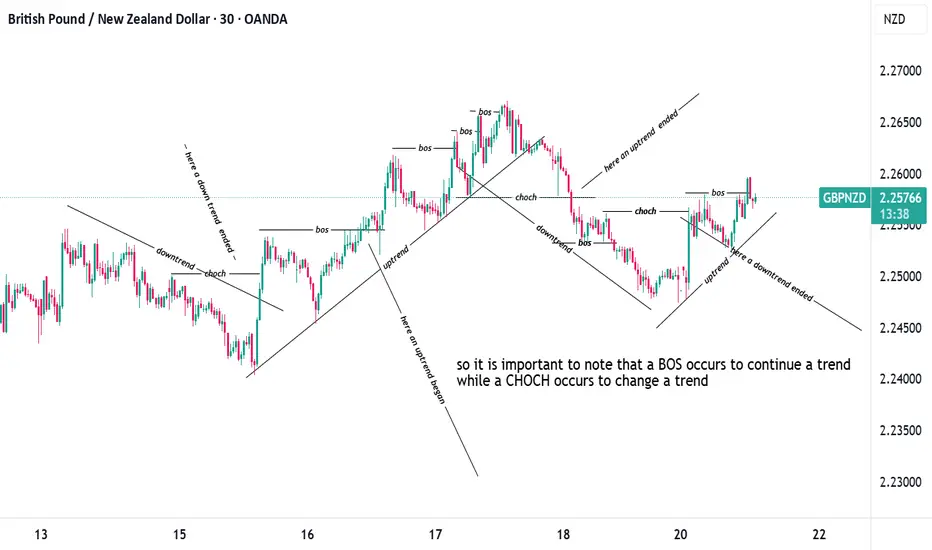
simplest explanation of BOS (break of structure) and CHOCHsimplest explanation of BOS (break of structure) and CHOCH (change of character)
i tried to simplify this as much as possible if you have any questions just reach out to me
Smart Money Sell Setup on Gold (15-Min TF)# Smart Money Sell Setup on Gold (15-Min TF)
### 🔍 Market Context:
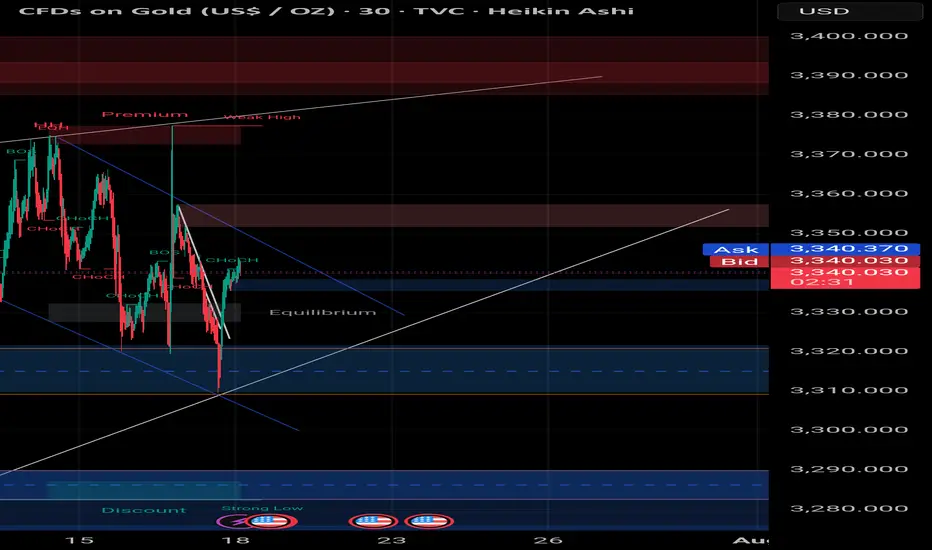
Gold has recently formed a strong bullish retracement after a sharp impulsive bearish move. Now, price has returned to a critical zone — the **Equilibrium level (EQ)** — which also aligns with a **valid supply zone** and **bearish trendline resistance**.
This zone is often considered the "decision point" where Smart Money evaluates whether to continue upward or resume the previous bearish trend.
---
## 📉 Strategy: Sell Limit Based on Structure + Liquidity
### ✅ Entry Zone:
**3341.500 – 3343.000**
(At the EQ zone + premium pricing area)
### 🛑 Stop Loss:
**Above 3345.000**
(Just beyond the last liquidity wick and top of supply)
### 🎯 Take Profit Targets:
- **TP1:** 3338.000 → First demand zone
- **TP2:** 3332.500 → Liquidity sweep target under previous lows
### 📐 Risk to Reward Ratio:
**1:3 or higher**, depending on execution precision.
---
## 🔎 Confluences Supporting the Setup:
| Factor | Confirmation |
|--------|--------------|
| EQ Zone (50% of previous move) | ✅ |
| Supply Zone | ✅ |
| Bearish Trendline Resistance | ✅ |
| Liquidity above EQ | ✅ |
| CHoCH + BOS (Market Structure Shift) | ✅ |
---
## 🧠 Why This Setup Works:
This is a classic **"Premium Price Rejection"** in a bearish environment, combining:
- Institutional logic (EQ level)
- Structural resistance (previous BOS)
- Liquidity traps above
---
## 🧵 Summary:
- **Sell Limit:** 3341.5 – 3343
- **SL:** 3345
- **TP1:** 3338
- **TP2:** 3332.5
- **RR:** 1:3+
- **Style:** Smart Money / Liquidity + Structure Based
---
🔔 **Disclaimer:** This is not financial advice. Always do your own analysis and manage risk accordingly.
#gold #XAUUSD #smartmoney #tradingview #liquidity #supplydemand #priceaction #forex #structure


VIRTUAL — Clean MSS+BOS Flip Long | #1D | BULLISH1. Limit order on retest S/R flip (1.65–1.68)
2. Entry after confirmed hold above support
3. Main target: 2.18
4. Stop: Below 1.49

SUI — 1D S/R Flip & FVG Target1. Hold above 1D S/R + BOS (blue box) = bullish bias
2. Entry: Only long above blue box
3. Target: 3.32 (FVG)
4. Stop: Below blue box = invalid
How to Trade Smart Money Concepts (SMC)\ How to Trade Smart Money Concepts (SMC)\
\ This article explores the foundation, key tools, and practical insights of Smart Money Concepts — and why it’s worth your attention.\
In today's fast-changing financial landscape, Smart Money Concepts (SMC) has become a popular strategy among modern traders. But what is SMC exactly, and how can it improve your trading decisions? This article breaks it down in a simple, professional way for traders at all levels.
---
\ What Are Smart Money Concepts?\
SMC is a trading approach based on the belief that large institutions ("smart money") like banks and hedge funds control most of the market's movements. These institutions often move the market in ways that confuse or trap retail traders. The goal of SMC is to understand and follow the footsteps of these big players.
Instead of relying on simple patterns or indicators, SMC focuses on:
\ - Market structure\
\ - Supply and demand zones\
\ - Liquidity pools\
By aligning your trades with the behavior of smart money, you can position yourself more strategically in the market.
---
\ Key SMC Concepts Explained\
\ Order Blocks\
Order blocks are zones on the chart where large institutions have placed significant buy or sell orders. These zones often lead to strong price reactions and act as hidden support or resistance levels. Order blocks are considered more precise than traditional supply and demand areas.
Example: ()
\ Fair Value Gap (FVG)\
A Fair Value Gap occurs when price moves sharply in one direction, leaving a gap or imbalance in the price action. These areas often get filled later and can act as magnets for price.
In a bearish move, the FVG is the gap between the low of the previous candle and the high of the next one. In a bullish move, it's the reverse.
Example: ()
\ Timeframe Consideration\
If you can’t monitor charts during the day, avoid relying on 5–30 minute setups. Consider 4H or daily timeframes for clearer signals and more manageable trading decisions.
\ Liquidity\
Liquidity refers to price zones where lots of pending orders exist. These are usually at obvious highs, lows, or trendlines. Smart money often targets these areas to trigger stop-losses and generate movement.
One common tool to identify liquidity is a "pivot point," which is a candle with a lower low or higher high than its neighbors.
Example: ()
\ Break of Structure (BOS)\
BOS occurs when price breaks above or below a previous high or low, signaling a possible trend continuation.
Example: ()
\ Change of Character (ChoCH)\
ChoCH happens when the market changes direction. For example, if price breaks a higher low in an uptrend, it may signal a reversal.
Example: ()
Combined with BOS: ()
---
\ How SMC Compares to Wyckoff\
The idea of "smart money" isn't new. Richard D. Wyckoff, a pioneer in technical analysis, laid the foundation for understanding market cycles driven by institutions. His price cycle theory includes four phases:
\ 1. Accumulation\
Smart money buys while the public is unaware.
\ 2. Markup\
Price rises as smart money pushes the market.
\ 3. Distribution\
Smart money sells into public buying.
\ 4. Markdown\
Price falls as the cycle completes.
SMC borrows from this logic but focuses more on structure and liquidity zones. Still, the core idea is the same: understand what big players are doing, and follow them.
\ For deeper insights into Wyckoff, explore additional resources focused on accumulation/distribution cycles.\
---
\ Summary\
Smart Money Concepts give traders a deeper look into market mechanics. By focusing on order blocks, fair value gaps, liquidity, and structure breaks, SMC helps identify high-probability trade setups based on institutional behavior.
It may seem complex at first, but once you understand the basics, SMC can become a powerful tool in your trading strategy. Whether you’re new or experienced, aligning with smart money can improve your edge in the market.

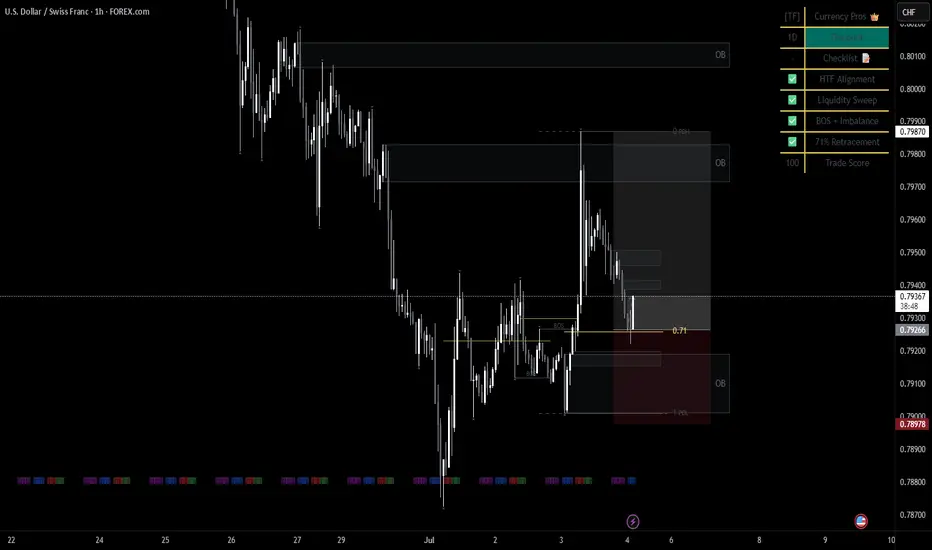
BUY USDCHFa few confirmations that influenced this trade. BOS, 71 fib & HTF alignment. I believe this will play out beautiful by Monday. lets goooooo
ETH Short – Smart Money Setup | 17.06 🔍 Context:
After a strong dump on ETH, clearly visible on the 1H chart (left side of image), I waited for a retrace into the Fair Value Gap (FVG) zone — typical Smart Money behavior. That’s where I started looking for a short setup.
🎯 Entry Logic:
Now here's the part I’d love to discuss with you.
The classic and maybe "cleanest" approach would be to wait for a market structure break on a lower timeframe and then enter on the continuation, targeting rejection zones visible again on the 1H.
But…
Lately, I’ve been taking entries directly from FVG, even before the break, if another FVG forms on the lower timeframe inside the higher timeframe zone. That’s what happened here — I saw a second FVG form in the key area, and took the short from that.
Sometimes I even treat two FVGs in the same direction (on the same or different timeframes) as a valid entry point on their own.
🤔 Question to the community:
How do you usually approach this?
Do you wait for confirmation/structure break on the lower TF before entering, or do you also go straight from the FVG if the zone is respected well enough?
Would love to hear how others manage similar setups.

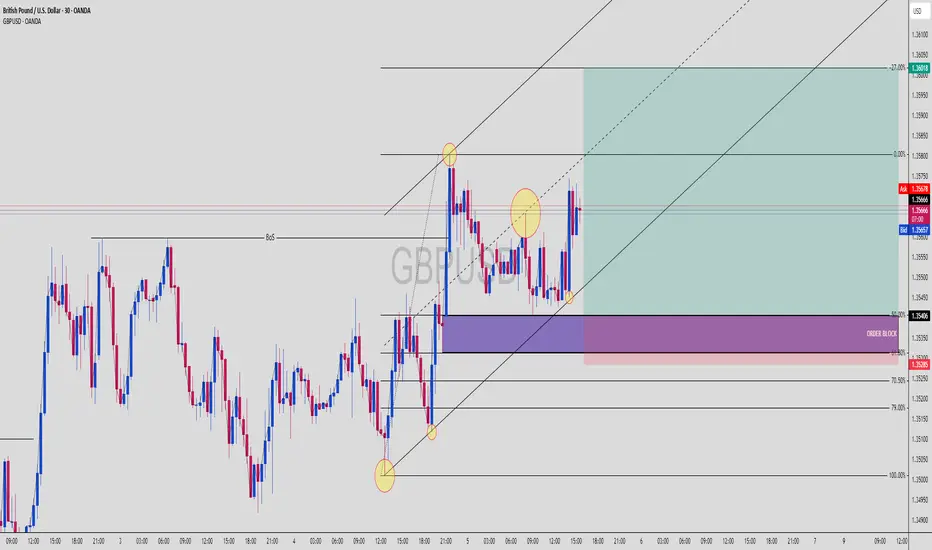
GBPUSD Buy Setup! BoS + OB + 61.8–79% Fib + Trend Channel ComboGBPUSD | 30-Min Chart – High Probability Long Setup Identified
GBPUSD is showing bullish intent after a clear Break of Structure (BoS) and now offers a high-confluence buy opportunity. This setup combines Smart Money Concepts with classical technical analysis for a sniper-grade entry.
🔍 Trade Breakdown:
📈 Break of Structure (BoS):
Price broke previous highs with strong bullish momentum.
Confirmed market intent shift from ranging to bullish.
📐 Fibonacci Confluence:
Price retraced perfectly into the 61.8% – 79% Fib zone from the latest bullish impulse.
These golden ratio levels align with an institutional Order Block (OB) and ascending trendline — high confluence entry.
🟣 Order Block Zone (OB): 1.35285 – 1.35406
The last bearish candle before bullish BoS — a clean demand zone.
OB sits within the Fib retracement zone and overlaps a mid-trendline tap.
📐 Fibonacci Levels (Swing Low to High):
61.8% = 1.35285
70.5% = ~1.35190
79% = ~1.35075
This is the institutional kill zone — OB + 61.8–79% retracement = precision buy levels.
🟡 Liquidity Sweep + Reaction:
Price swept liquidity below short-term lows and tapped the OB with a sharp bullish reaction.
Candle confirmation + lower wick shows strong rejection from Smart Money.
🧭 Projected Move:
Targeting a move toward the -27% Fib extension at 1.36018
Trendline and internal structure support bullish continuation
🔵 Projected Path:
Sweep ➝ OB/Fib confluence tap ➝ strong bullish continuation into premium territory
🧠 Chart Ninja Entry Plan:
🔹 Entry Zone: 1.35285 – 1.35406 (OB + 61.8–70.5% Fib)
🔻 SL Below: 1.35000 (beneath OB & key structure low)
📈 Target: 1.36018 (-27% Fib extension)
⚖️ RRR: 1:3+ — sniper entry with institutional precision
💬 Ninja Wisdom:
Smart Money isn’t buying breakouts — they buy retracements into OB zones with precision.
Combine OB + Fib + channel = institutional roadmap.
Let price come to you. Let retail chase. 🥷💸
📍 Save this GBPUSD setup before it hits the next impulse wave
🗣️ Drop your thoughts – are you buying this OB too?
👣 Follow @ChartNinjas88 for more institutional-grade setups daily
XAUUSD Short idea for todayWe are now in an bearish imbalance in 4H TF and now looking for break of structure on m15 to validate the idea to short as per the chart, still waiting for confirmation in the form of break of structure or 15m imbalance.

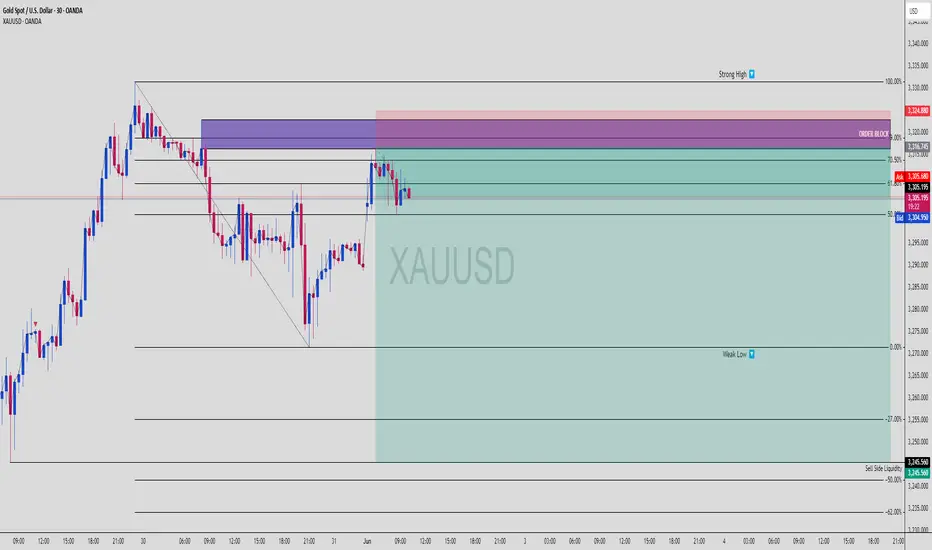
XAUUSD | Premium Zone Hit – Is Gold Ready to Nuke?XAUUSD | 30-Min Bearish Setup – OB Tap + Liquidity Engineering
Let’s break this down ninja-style ⚔️
📌 1. Market Context:
Gold has retraced into a premium pricing zone after a significant sell-off and is now:
Respecting a refined bearish Order Block
Sitting at 61.8–70.5% Fibonacci retracement (textbook premium)
Below a strong high (liquidity magnet)
This is classic smart money engineering:
➡️ Pull back
➡️ Lure in breakout buyers
➡️ Raid the high
➡️ Dump toward liquidity
🧠 2. Key Levels:
📈 Strong High: 3,324.880
🟪 Order Block Zone: ~3,316.745 to 3,324.880
🔻 Current Price: ~3,307.000
🔵 Weak Low: 3,270.000
🩸 Sell Side Liquidity: 3,245.560
We’re watching for a possible rejection from the OB and a drive down into the Sell Side Liquidity zone.
📊 3. Entry Plan (Confirmation-Based):
Wait for a bearish M5–M15 BOS from OB
Look for FVG entry or last mitigation
Target weak low & SSL
Maintain 1:2 to 1:4 RRR depending on entry precision
Ideal RR Target:
🎯 TP: 3,245.560
🛑 SL: Just above 3,324.880
🔁 RR ~ 1:3+
📉 4. SMC Story:
🧩 Price swept internal liquidity and tapped into premium zone
🔍 OB + Fib confluence = high-probability reaction area
🧲 Weak low is unprotected = juicy target for sell-off
🤖 This move could create displacement and fuel next bearish leg
Smart Money is looking to trap late longs before hitting the liquidity pool.
🎯 5. Bonus Tip:
If you’re on M1 or M5, scale into partials as the move confirms via:
Bearish engulfing
BOS + FVG combo
Lower timeframe mitigation plays
Stay reactive, not predictive. Let the market confirm the trap. ⚠️
💬 Drop “Gold Trap Setup 👑” in the comments if you see the same thing
🔁 Save this to track the next move
🎯 Follow @ChartNinjas88 for daily sniper setups!
EURAUD (BOS + IMB + OTE)Hello traders!
Description: We have STB(Sell to Buy Action) - you can see it on 1H TF, which grab some liquidity and then made BOS. In this moment we can expect that price comeback to 0.5 and then i will look reversal on LFT, after closing IMB.
Entry: Confirmation on LTF in POI. Alarm on 0.5 Fib Level.
Target: HH
P.S: check also previous idea. We still have valid Demand on LTF.
Have a profitable day and don't forget to subscribe for more updates!
If you like this idea drop a like, leave a comment or write your pair, i will check.

XRPUSDT 4H | Untested Demand Zone RevisitIn this 4-hour chart analysis of XRPUSDT, I’m focusing on a clear and well-defined untested demand zone between 2.05–2.13 USDT . Unlike the first demand zone (already tested and played out), this second zone has not been retested since its formation, making it a fresh area of interest for a potential long setup.
Why this matters :
Untested demand zones often act as powerful magnets for price when revisited, as they represent areas where large buy orders might be waiting to be filled. Because this zone has not been revisited yet, there’s a higher probability for a bullish reaction when price returns to it.
Key Technical Factors :
✅ The 2.05–2.13 demand zone was formed following a significant bullish impulse that created a clear break of structure to the upside.
✅ Price is currently consolidating above this demand zone and also above a potential bearish CHoCH at 2.0784 . This suggests that the bullish structure is still valid unless price breaks below 2.0784.
✅ My bullish target is 2.65 USDT , where previous highs were formed and potential liquidity exists.
✅ My stop loss is set just below the demand zone, around 2.05 , to protect against a deeper retracement or a shift in market structure.
My Thought Process :
I expect that if price returns to the demand zone, there will be a strong chance for buyers to step in and push the market higher. However, I’m aware that if price breaks below 2.0784 , it would signal a bearish CHoCH and invalidate the long scenario. Therefore, patience is key — I’ll wait for price to either test the zone and react strongly or stay above 2.0784 to keep the bullish bias intact.
Clear Trade Setup :
📌 Entry Zone : 2.05–2.13
🛑 Stop Loss : Below 2.05
🎯 Take Profit : 2.65
🧩 Invalidation : Break below 2.0784
💬 Let me know if you have a similar zone marked out or if you see a different setup! Let’s share ideas and refine our strategies together.

EURNZD (BOS + DEMAND + 705 FIB LEVEL)Hello traders!
Description: Now we already in demand + check RSI)))
Entry: Confirmation on LTF in POI
Target: TILL problem zone.
P.S: check also previous idea.
Have a profitable day and don't forget to subscribe for more updates!
If you like this idea drop a like, leave a comment.

EURAUD (BOS 1H + DEMAND + OTE)Hello traders!
Description: Now we already in 0,5 of fib level, price want to close imb and mitigate demand + 705 OTE in case BOS 1H.
Entry: Confirmation on LTF in POI
Target: New HH
P.S: check also previous idea.
Have a profitable day and don't forget to subscribe for more updates!
If you like this idea drop a like, leave a comment.

EURCHF SHORT (OB 4H + BB + OTE + Volume)Hello traders!
We have supply = OB 4H + OTE + BB
Target: ST Of Demand
Now we can expect reversal on LTF from 705 fib level + Mitigation Sell to Buy Action.
Have a profitable day and don't forget to subscribe for more updates!
If you like this idea drop a like, leave a comment.

AUDNZD (SUPPLY+BOS+OTE)Hello traders!
We have supply + OTE.
Now we can expect reversal on LTF from 705 fib level + 0.5 Supply zone.
Have a profitable day and don't forget to subscribe for more updates!
If you like this idea drop a like, leave a comment.

NAS100 (BOS 1H + SUPPLY + OTE)Hello traders!
Now reaction from 705 fib level, Supply = OB 4H. But we can expect mitigation supply and confirmation on LTF. We have BOS on 1H.
Target: till 0.5 global fib level.
P.S: We have also on top OB 2H + OTE
Have a profitable day and don't forget to subscribe for more updates!
If you like this idea drop a like, leave a comment.
