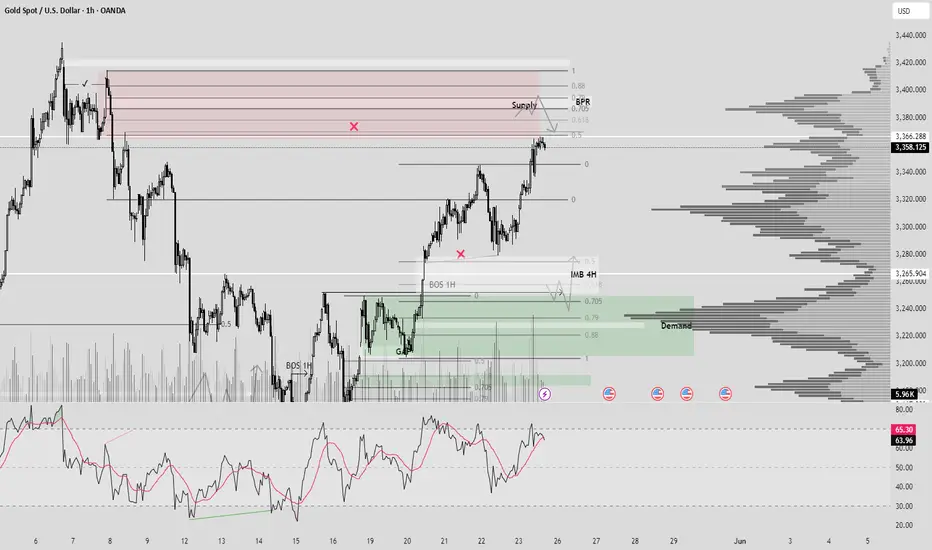
XAUUSD (BPR + SUPPLY + VOLUME + OTE)Hello traders!
1) Price come back to our demand zone, and for me 0.5 Supply still strong zone for selling +BPR 1H + Volume + OTE. RSI in oversold.
2) Also we have open BOS 1H + Demand 0.5 + Volume + Close IMB + OTE.
Have a profitable day and don't forget to subscribe for updates!
BOS
FARTCOIN Analyze And PositionEverything is clear on the chart.
Strategy Name: Footak
Based on Fibonacci points, bos, trend line, bit price and bit dominance

Trading AUDUSD NZDUSD | Judas Swing Strategy 20/05/2025We’re halfway through the week and already sitting on two clean setups, all rooted in the Judas Swing Strategy. After Monday gave us nothing worth trading, Tuesday served up textbook opportunities on OANDA:AUDUSD and $NZDUSD. In this breakdown, we’ll walk through two trades from Tuesday and highlight how they followed the exact Judas Swing playbook: manipulation first, then break of structure, retracement and execution
AUDUSD: The Classic Fakeout Reversal
Tuesday's OANDA:AUDUSD setup was as clean as they come. Price action leading into our session was heading downward. Liquidity had built up nicely above and below our zones giving us the bait we needed for the Judas Swing setup to trigger.
As expected, our session opened with a sharp fake move to the downside, sweeping the sell-side liquidity and trapping breakout sellers. What came next was the real clue: a decisive break of structure to the upside, signaling that the manipulation was complete and the true direction was about to unfold.
Price formed a Fair Value Gap (FVG) during the move up, and once it retraced into that imbalance, we executed our buy:
Entry: 0.64007
Stop Loss: 0.63907
Take Profit: 0.64207
The result? We faced some drawdown and a clean move into target. It was a low-stress trade that respected the plan from entry to exit
NZDUSD: Same Script
If OANDA:AUDUSD was the blueprint, OANDA:NZDUSD mirrored it almost exactly since they are closely correlated pairs.
Again, we started the session with a tight range. Liquidity had stacked nicely above and below the zone. Then, right on cue, the market delivered its Judas move, a fast pump below the pre-session lows, baiting in breakout shorts.
This was followed by a swift rejection and a clear break of structure to the upside. Once that displacement printed a Fair Value Gap, we knew where our opportunity lay.
Entry: 0.59002
Stop Loss: 0.58902
Take Profit: 0.59202
We entered on the retrace, and price moved smoothly in our favor. The difference here? We barely faced any drawdown on this trade as it moved straight to hit our TP putting us up 4% on the two trades
These setups reinforce why the Judas Swing Strategy is so effective in manipulated markets:
- We don’t chase breakouts we wait for the trap
- We don’t force trades we wait for displacement and confirmation
- We trust our backtested process even when we miss trades or price misses TP by a whisker
Not every trade will close out perfectly, but this method is built around structured logic and patience

EURCAD (BOS 1D + Demand + OTE + Volume + OrderFlow)Hello traders!
As you can clearly see OF, daily structure(BOS 1D), expecting reversal from OTE zone. Alarm on 618 Fib level. In this moment we see divergence(also possible 3 tops). Price build liquidity to come back to our POI.(DEMAND)
Have a profitable day and don't forget to subscribe for updates!

XAGUSD (BOS + Supply + OTE + Volume)Hello traders!
I expecting reaction from supply zone, target you have.
Need confirmation on 1-3min.
Have a profitable day and don't forget to subscribe for updates!

Supply Zone Rejection & BOS Confirm Downtrend ContinuationAfter a clean shift in structure marked by a CHoCH and subsequent BOS, price retraced into a clear supply zone—offering a high-probability short setup. Here's how the setup unfolded:
🧠 Trade Rationale
Break of Structure (BOS): Price broke below a key higher low, confirming a bearish structure.
Change of Character (CHoCH): Signaled the end of bullish momentum earlier in the sequence.
Supply Zone: Price retraced into a well-defined supply area (aligned with imbalance and prior support turned resistance).
Entry: Short taken as price tapped into the supply and failed to make a new high—further confirmed by a lower timeframe CHoCH.
Target: Aiming for the next BOS level below, aligning with clean equal lows/liquidity draw.
🔍 Key Concepts Highlighted
Structure-based trading with CHoCH and BOS labeling.
Supply zone entries based on price action confirmation.
Risk-to-reward driven decision-making (tight SL above supply, TP near next demand).
💬 What do you think? Do you wait for confirmation within supply, or enter at touch?
Let’s discuss—drop your thoughts and feedback!

AUDUSD (MSS + DEMAND + OTE)Hello traders!
My setup: MSS + DEMAND + 705 FIB
Target: till first problematic zone(BOS 1H)
Entry: Through confirmation on LTF
Have a profitable day and don't forget to subscribe for updates!

EURCHF (Order Flow + BOS + Demand + OTE)Hello traders!
As you can see our previous OB was mitigated and now we have BOS 1 H - we see good reaction, but at least 1-5min confirmation and we have green light.
Target new HH.
Have a profitable day and don't forget to subscribe for updates!

EURUSD (CONFIRMATION + DEMAND + OTE)Hello traders!
Price mitigated demand and after we have confirmation on 1H TF. As you noticed our demand unmitigated. I expecting reversal on LTF after closing IMB.
Have a profitable day and don't forget to subscribe for updates!

XAUUSD (CONFIRMATION + OB + OTE)Hello traders!
From our previous analysis we expected reversal in 705 zone, now we have confirmation already and our target to close imbalance. Last open zone for interest is OB and mitigation(possible pullback with LG)
Have a profitable day and don't forget to subscribe for updates!

EURJPY (BOS + 0.5 DEMAND + 0.5 FIB + IMB)Hello Traders!
Here we have BOS on 1H TF, and the reason of pullback is to mitigate our 0.5 fib level + 0.5 DEMAND and fully close imbalance, after i will wait for confirmation on LTF.
Have a profitable day and don't forget to subscribe for updates!

GBPCHF (MSS + DEMAND + OTE + 0.5 FIB)Hello Traders!
We have 2 strong zone for buying:
1) Unmitigated Demand + MSS + OTE
2) OB with Inducement.
Both scenario are valid in my opinion.
Have a profitable day and don't forget to subscribe for updates!

How to use Dynamic Market Structure to track market moves🔍 Idea Overview
This chart demonstrates the effectiveness of the Dynamic Market Structure Indicator in live conditions, capturing key Break of Structure (BoS) and Change of Character (ChoCH) points. Each zone dynamically adapts based on price behavior and helps identify crucial turning points.
📌 Highlights from the Chart
• ✅ Early BoS detection led to accurate identification of the bullish breakout before the major rally starting May 7.
• ✅ Multiple successful ChoCH zones indicated potential reversal areas and pause zones during sideways consolidation.
• ✅ The green (BoS) and red (ChoCH) horizontal zones aligned perfectly with price reaction levels, acting as reliable support/resistance.
• ✅ During the pullback post-high, the indicator caught clear bearish ChoCH before price dropped nearly $2,000, showing high responsiveness.
📊 Summary of Performance
• Rally captured from ~95,000 to ~104,000 with early BoS signals.
• Sideways zones around 103,000–104,000 marked with structural shifts that predicted stalling.
• Post-drop behavior accurately highlighted re-test of ChoCH zones before reversal attempts.
⚙️ Indicator Logic (Brief)
• BoS (Green): Confirms trend continuation when structure breaks in the direction of the trend.
• ChoCH (Red): Signals a potential trend reversal with key level break.
No repainting. Zones are locked once confirmed.
In volatile markets like BTC, accurate detection of structural shifts can define risk and opportunity. This indicator consistently tracked evolving zones and highlighted major inflection points — without lag or overfitting.

BITCOIN - Important Breakout (BoS)Hello Traders !
On Monday 5 May, The BTC reached the support level (92800 - 93500).
The price broke the higher high (Break of Structure).
So, I expect a new bullish move🚀
_______________
TARGET: 104000🎯

Simple Break of Structure BoS Trading Strategy Explained
One of the best and reliable strategies to trade break of structure BoS is to apply multiple time frame analysis.
In this article, I will teach you my break of structure gold forex trading strategy. You will get a complete step-by-step guide with examples.
Let's start with a quick theory and let me explain to you what is break of structure BoS in Smart Money Concept SMC trading.
In a bullish trend, break of structure BoS is an important event that signifies a continuation of an uptrend. It is based on a violation and a candle close above the level of the last higher high (HH).
After a breakout, the broken level becomes the first strong support for trend-following buying.
Check multiple examples of confirmed breaks of structure BoS on GBPNZD forex pair on a weekly time frame.
In a downtrend, Break of Structure BoS means a bearish trend continuation . Break of Structure is considered to be confirmed when a candle closes below the level of the last lower low (LL).
The broken key level becomes the closest strong support for buying.
That's the example of a healthy downtrend on USDJPY forex pair on a daily. Each break of structure BoS pushed the prices lower, providing a strong signal to sell.
What newbie traders do incorrectly, they trade break of structure without a confirmation strategy, and it leads to substantial losses.
Though GBPCHF is trading in a bullish trend and though each BoS provided a trend-following signal. The price retraced significantly lower below the broken structure before the growth resumed.
When the price retests a broken structure after BoS in a bullish trend, start lower time frame analysis.
If you identified a break of structure on a daily, analyze 4h/1h time frames.
If on a 4H, then 30/15 minutes.
After the price sets a new higher high with BoS in uptrend, it usually starts trading in a minor bearish trend on lower time frames.
With our strategy, your signal to buy will be a retest of a broken structure and a consequent bullish Change of Character CHoCH . That will provide an accurate bullish signal.
In a bearish trend, analyze the lower time frames after a retest of a broken structure. Your signal to sell will be a bearish Change of Character CHoCH.
Look at a price action on EURCHF on a daily.
We see a strong bullish trend and a confirmed Break of Structure BoS.
According to the rules of our trading strategy, we start analyzing 4h/1h time frames after a retest of a broken level of the last Higher High.
Our signal to buy is an intraday bullish CHoCH. We open a long trade after that with the stop loss below the intraday lows and take profit being a current high.
That's how simple this strategy is.
Multiple time frame analysis provides the extra level of security.
Strong lower time frame confirmation substantially increases the win ratio of a trading setup.
❤️Please, support my work with like, thank you!❤️
I am part of Trade Nation's Influencer program and receive a monthly fee for using their TradingView charts in my analysis.

DOW JONES - BULLISH MOVE !Hello Traders !
The Dow Jones Index failed to create a new lower low
The price broke the higher high (Break of structure).
So, I expect a bullish move🚀
_______________
TARGET: 41600🎯

Should I hold my short at $3,305.69, or exit now What do you think, fam? Should I hold my short at $3,305.69, or exit now with gold so close to my stop-loss at $3,306.57? Drop your thoughts below—I’m curious to hear how you’d play this XAU/USD setup! If you’re one of the two ready to join me at Academia for Forex Trading, let’s talk—we’ll hunt these markets together. And while you’re at it, check out Icon Collections Store—does RiverSide, Desire, or Icoca vibe with your trading energy? Let me know!

BTCUSD 2H | Breakout Flow + BOS Confirmation – CelestiaPipsBTC is slowly developing a breakout structure on the 2H timeframe .
Multiple bullish BOS points and a solid NY session demand base formed.
Price is currently retesting the breakout zone after sweeping short-term liquidity.
If price holds this zone, we could see continuation toward 88,900.
I’ve mapped out the entire flow – BOS, entry zone, and final target.
Watch how price reacts from this level.
— Shared by CelestiaPip

Looking LongEUR/JPY has finally shown a Break of Structure within the higher timeframes. This gives me clear indication that the CHOCH yesterday was correct. Thus I should be looking for buyging positions.

Super Micro Computer (NASDAQ: $SMCI) Faces Critical SupportMarket Movement:
Super Micro Computer, Inc. ( NASDAQ:SMCI ) is experiencing a notable dip, down 2.27% in Monday’s premarket trading. Investors are closely watching the stock as it approaches a critical structural support level within its long-standing symmetrical triangle pattern, a formation that has persisted since March 2024.
Technical Analysis
The symmetrical triangle pattern, marked by converging trendlines, signifies a prolonged phase of consolidation. A significant technical structure has formed, with the baseline aligned with the December 2023 pivot. If NASDAQ:SMCI breaches this support level, the downside potential is substantial, possibly leading to a retracement toward the $17 support level. However, should the stock witness a breakout above the Break of Structure (BOS), it could catalyze a strong rally, aiming for the highs seen in March 2024.
The RSI (Relative Strength Index) currently sits at 40, indicating that the stock is teetering on the edge of bearish sentiment but not yet in oversold territory. The RSI’s ability to maintain this level could determine whether a bounce from support materializes or if further downside pressure ensues. The next few sessions will be pivotal in shaping NASDAQ:SMCI ’s short-term price trajectory.
Recent Earnings Overview
Despite the recent price dip, NASDAQ:SMCI has demonstrated impressive financial performance. The company reported a staggering 109.77% YoY revenue growth, reaching $14.94 billion in 2024, compared to $7.12 billion in the previous year. Earnings also surged by 88.77%, totaling $1.21 billion. These figures reflect strong operational efficiency and growing demand for its high-performance server and storage solutions.
Analyst Forecast & Price Target:
According to 16 analysts, NASDAQ:SMCI holds an average rating of “Hold.” The 12-month price forecast suggests a target of $57.74, implying a potential upside of 102.45% from its latest price. While analysts remain cautiously optimistic, the stock’s future hinges on whether it respects its current support levels or experiences a significant breakdown.
Conclusion:
NASDAQ:SMCI is at a technical crossroads, where a break below the symmetrical triangle’s baseline could signal further downside pressure, while a successful breakout above resistance could reignite bullish momentum. With strong fundamental backing and an impressive growth trajectory, the coming days will be crucial in determining whether the stock can reclaim its bullish potential or succumb to market pressures.
Traders and investors alike should keep a close eye on the Break of Structure (BOS), as it will likely dictate NASDAQ:SMCI ’s next major move in the market.

Yesterday, the chart dropped sharply. What should we do next?Based on the plan I made for the week, I anticipated that the price of XAUUSD wouldn’t drop below 2735. However, the result was that on just Monday alone, the chart dropped significantly, breaking through all 3 demand zones I had planned for.
Therefore, today we’ll adopt a day-to-day strategy. For today, the focus will be on selling since the price has shifted CHoCH at 2735 in both H1 and H4. We will wait for the chart to retrace to our POI zone , form a CHoCH in the smaller timeframe , and then look for an entry point from the newly created supply zone."

NY session trading plan"Due to the recent sharp decline in price from the supply zone, we will be waiting for confirmation from the M1 timeframe . For now, we should wait for the price to touch the POI demand and look for a clear candlestick pattern on the M1 timeframe before entering a trade."

NVDA Stock Update: Downtrend Alert!📉 NVDA Stock Update: Downtrend Alert! 🚨
Attention traders!
As we analyze the current market structure for NVIDIA (NVDA), it's crucial to note the recent developments on the daily chart.
Key Observations:
Market Behavior Since December 20, 2024: NVDA has been in a ranging market, characterized by significant volatility.
Bearish Signal: We witnessed a huge bearish engulfing pattern, indicating strong selling pressure. This is a critical signal for traders to consider.
Break of Key Level: The recent higher high can now be defined as a Lower High (LH) as the base of the order block at $129.60 has been broken.
Expected Support Levels:
As we move forward, we anticipate the following support levels:
$124.94
$120.33
$115.78
We are particularly focused on potential accumulation within this Demand Zone. It's essential to stay vigilant and adapt your strategies accordingly!
Happy trading, and stay safe! 📊💼
