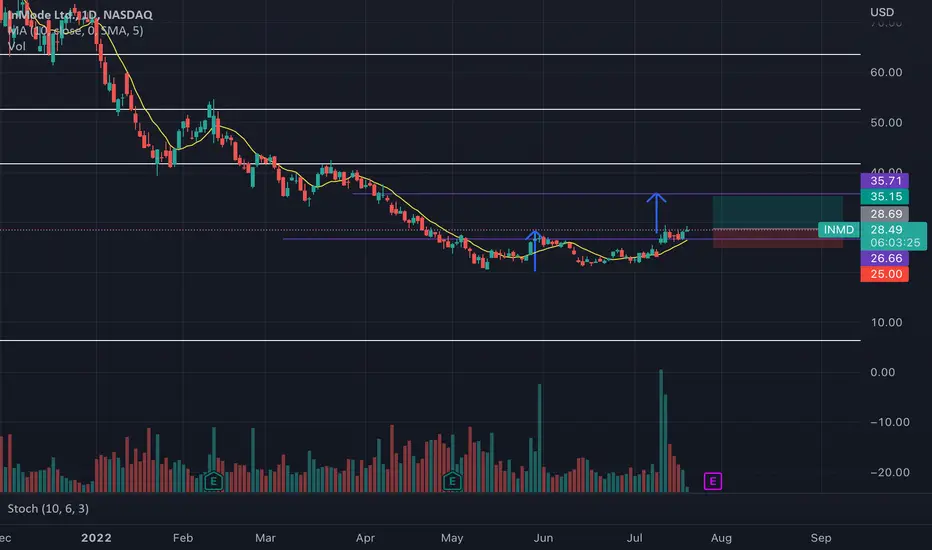
Tripple bottom if FRS raise only +0.25 or +0.5 % 27 July. If frs raise only 0.5% we will see tripple bottom + rebound to 28.000$
Bottom

BTC Bottom will be in a week or so around 14-16k. The RSI is still very bearish, we need a divergence to confirm the bottom, a big crash is likely, this will be our final capitulation candle.

Timing Indicates Crypto and BTC bottom #3 I can hear your comments now "messy charting" etc. this is my proprietary pentagrams and pyramidS TA I used to call bottom on July 20 2021, BEFORE BTC went back above $30,000!! This corroborates with my other 2 posted charts! October 7 ish $77,000 ish !! ERC-20 tips accepted at 0x8aC6A06463733eA4A78B1C5Ee6E5446499f579F9.

Bottom In for Bitcoin and Crypto Bull Commences Now #2here is the 2 day chart to show the trend lines on a macro scale since 2013, this chart correlates with my other chart just posted.

Timing Shows Bitcoin Bottom is in and Bull starts now....if we keep weekly close above $21,800 tonight. I will publish 2 other charts that corroborate this idea. One a 2 day macro view of same chart stretching back to 2013. Also my proprietary pyramids and pentagrams technique.

BTC ! Am I right about BTC bottomI'm looking at monthly timeframe. As I told you earlier BTC has already bottomed based on history data. I'm very confident about it and this analysis proves my previous posts which shows BTC bottomed at 17.5K on 18.06.2022. You can find my other analyses about BTC bottom bellow this one. So in every bear market bottom these 3 things happens simultaneously, only 3 times in the whole history))
If you like my analyses don't forget to like a follow.

The bottom will be printed this week; it will be 16k? 300 WMA?1 - every Fed meeting with hike increase did a 33% dump (could it be priced in?)
2 - RSI doesnt show any bullish divergence yet
3 - 1D RSI shows FOMO and correction due
4 - HS pattern on indicator
5 - there will be no Fed meetings for 2 months
the divergence printed during this dump will mark the bottom of BTC.

APE/USDAnother view huge vol jump signal a turnaround get in at the bottom. This is where the money is made. Buy the dip this is no dip it is the bottom.

Bitcoin Reversal Criteria and SignalsOne condition which could indicate a reversal is the dmi - (red line) reaching the 40 line (purple horizontal line) on the 5 day time frame. Looking at the history of dmi, the dmi - reaching the 40 line/level has been indicative of the bottom being in. Nov 2018, March 2020, both bottoms coincided with the dmi - reaching this level. While it's not necessary, this is one of the signs I'm looking for. It doesn't mean btc price will rocket to the moon straight away once that level's hit, what would be another good sign, following that level getting hit, would be the dmi + and dmi - (blue and red lines) crossing, and then both remaining close, flat, crisscrossing one another for a few weeks, or months. That would be accompanied by the flat price action which often precedes a reversal, not unlike after the low was put in in Nov 2018...it took a while.

DOUBLE BOTTOMInteresting double bottom completed, over a multi week base, indeed, volume surged at last week closing above accumulation area, minimum upside potential can dictate a 1.7 R/R.
⚡️ #BTC OUTLOOK - 19/07⚡️⚡️ #BTC OUTLOOK - 19/07⚡️
60:40
Bullish: Bearish
Been keeping an eye on the Pi Cycle Indicator recently and it looks like the bottom has come in. This thing has called a perfect top consistently.
Like with all TA and Indicators nothing works 100% of the time....but so far this has worked 100% of the time.....so as always in trading probability is pretty much your only companion.
Check this one out - it is a free indicator on Tradingview search "Pi Cycle Bitcoin High/Low" by NoCreditsLeft - give it a like too for making an awesome tool!
Coupled with the timing between the halving's and also a big buy signal on the Alpha Wave on the Weekly we could be looking at a potential bottom.
Excitingly also S&P500 showing buying pressure
🔸 S&P500 corporate insiders are in the heavy buying zone.
🔸 This has historically led to very attractive returns in a 6-12 month time frame.
BTC is and has been correlated with the S&P - so this will likely spill into BTC. Very promising signs
*Data not verified so please DYOR

EUR/SEK potential bottomRight now EUR/SEK is trading at strong support, which goes in line with Fibonacci and Volume Profile indicators. As long as daily close remains above this support area, we should see the formation of the bottom. Potentially, this is the beginning of a medium-term rally, towards 127.2% Fibs

Btc Bottom? Elliot wave analysis of bitcoinAccording to my analysis btc complete elliot wave and correction pattern and it is ready to start it next bull run. It is the best opportunity to long term trade.
You can also check that rsi macd and stochastics all are giving the early bottom signal
Please do your own reasearch it is not a trading advice just idea


btc may fall from 23k level btc may fall from 23k level
Im bullish upto 23k level and thn drop from there and if price dips today or tomorow you can see the supports in the charts wost case 20k
Not a financial advice

Longterm Bitcoin ChartWhile I'm looking for dmi - to reach certain extremes before I feel comfortable claiming reversal is imminent, this old chart implies we could have already tagged the bottom. There's the caveat of the dmi, and if there is another drop, I'd think it would be around ...maybe the 21st, give or take a day. I don't think you're supposed to try to time it cuz you end up looking foolish, I guess. Maybe btc hits 24k first, and if it breaks that...might just be green light to 30k.

We are currently in a bear pennant. Bottom very near. We are currently in a bear pennant. The total breakdown for the pennant has a target of 5k…if we just take the triangle part the breakdown is 14k….I think we go slightly below 14k then find our bottom aroun 13.7-13.9k Before the rebound. Of course there is also a slight chance we’ve found our bottom already in which case it will just break upwards instead of down. *not financial advice*


BTCUSDIdentifying the bottom with EMA.
History can provide a broad overview of possible results.
It doesn't matter if it's the absolute bottom or the absolute top if you generate profits between the two.
Profit is always great, yet following the herd always results in losing money

BTC bottomed -No doubtI'm looking at monthly timeframe. As I posted earlier in my previous Analysis BTC has already bottomed at 17.5K on 18.06.2022: I will bring another prove and show you that BTC bottomed definitely. In every bear market, when these 3 things happens simultaneously it marks the bottom.
Check my other analyses about BTC bottom attached bellow. Don't forget to like and follow.

BTCUSDTypically, we print a BUY signal following a miner's capitulation.
The price hikes after this signal.
The results of macroanalysis are not optimistic because of rising inflation and geopolitical instability.
Most likely, this pump will be a bear market pump, and an ATH for bitcoin is not coming.
Meanwhile, altcoins are looking good for a pump.
For a short duration, $17.5k may be the bottom. In the long run, we might come back to this price level.

KAVA short term possibilities KAVA short term possibilities
there are resistances as well look for the break out
not a financial advice

CHR/Chromia price updateCHR/Chromia price update
some news are comming will take 20 to 50% and exit
not a financial adivce
