Is AAPL gonna miss and find a bottom?Will APPL be able to overcome this candle syndrome?
In case it misses its earnings, this is how I see it finding a bottom. I think Apple is being used to "manipulate" the market and keep the indices up.
Otherwise, enjoy the continuation of this rally during the 2nd semester! :)
Bottom


Auto finance price analysis Auto finance price analysis
price is at break out or break down point with a week it must break out or break down watch the chart for the possible outcomes.
not a financial advice.

BTC/USD cycle bottom found - time to celebrate?This analysis is not intended to be a piece of financial advice.
It is affirmative to believe that Bitcoin Cycle Bottom is technically formed and found. The market may show some rally, as well as a reversal to retest the Cycle formation so the swings will benefit. Markets may anticipate some relief as the labor report is above expected numbers. The next interest rate may likely be not 75 basis points; instead, it is likely that Fed may reconsider going for 50 basis points that will help sustain the Bottom Formation. Still not a time to go Long. If one should, setting a limit of 18.8k can prove to be a wiser move.

BTC BottomBTC is printing for 3rd time Pi Cycle Bottom
There are also indicators for the bottom that indicate the possibility of the bottom.
If the price is falling, a DCA strategy is needed.

BTCUSD PredictionPrediction based on historical trend, and Indicator.
Still waiting for Vortex Indicator to become blue.
Trade safely.

BTC ! The most important channel in BTC history. I'm looking at monthly timeframe. Every time when BTC touched the upper band of the channel it toped and every time when it touched the lower band of the channel it bottomed or pumped very hard.
Pay attention every time when BTC topped or touched the upper band of the channel RSI> 90 and every time when BTC touched the lower band of the channel or bottomed RSI<50.
BTC touched the lower band of the channel on 18.06.2022 and at the same time RSI bellow 50. This is another prove that BTC has already bottomed as I mentioned in my previous analyses.
Check all my previous analyses attached the bellow that proves BTC has already bottomed.

BTC has already bottomed at 17.5K on 18.06.2022I'm looking at 2w timeframe and comparing all bear markets with each other. History data shows in every bear market this 3 things happen at the same time.
1. BTC bottoms at 0.38 fib level/from bottom to the top/ length of bear market 400-450 days from top to bottom/
2. These magic moving averages/ in pink circle/ crosses on the exact day/ 3 times in history.
3. The bellow indicator has 0 value the day when above 2 things happen.
Check my another Analysis I made on 18.06.2022 which proves that BTC has bottomed. I attached the link bellow.

Pi Cycle top signal: are you ready to buy BTC right now?Pi Cycle Bottom indicator has given a BUY signal, who is willing to strongly believe in the recovery of BTC in the near future?

🔥 Bitcoin Pi-Cycle Bottom Indicator Signals Bear Market BottomBefore we dive deeper into the analysis I want to give a quick overview of what the pi-cycle bottom indicator is,
"The indicator comprises a 471-day simple moving average (SMA) and a 150-period exponential moving average (EMA). Furthermore, the 471-day SMA is multiplied by 0.745; the outcome is pitted against the 150-day EMA to predict the underlying market's bottom."
In short, the Pi-Cycle bottom indicator is similar too the Pi-Cycle top indicator, but with different values.
Historically, the Pi-Cycle bottom indicator has signaled the BTC bear-market bottom within 3 days of the signal. This would mean that the BTC bottom will be in within the next three days.
However, will the pi-cycle bottom indicator work again this time? There's only two previous instances of the indicator working, one can't really deduce statistical validity from an N=2. Funnily enough, people said the same thing about the Pi-Cycle top indicator last year. In hindsight, the Pi-Cycle top indicator did a great job signaling the technical top for the current BTC cycle (technical top = top based on indicators and on-chain metrics).
Will this time be different? Maybe.
The current macro-economic outlook is vastly different from the previous cycles. Bitcoin's correlation with the stock market has never been this high and, with inflation still on the rise and a recession looming, stocks are more likely to go down than to go up in the near-future. Unless today's CPI numbers will cause a huge 20%-30% sell-off, I don't think that BTC will bottom within the next three days. Time will tell.
Nevertheless, I think that this indicator is one of the better bear-market bottom indicators. Bottoms never occur when people expect it.

KSMUSDT CORRECTION SETUPCurrently we saw a big upper move with no strong retracement.
What is to happen now is at least short downwards move to 0.5 fib or 0.618
At 4h you can see CCI divergence that has worked out only 2 of 3 waves.
We also touched golden ratio fib (0.618) at 4h correction move.

BTC will history repeat in 2022? Breakout soon?I'm comparing the breakout of 2018 BTC bear market bottom with potential 2022 breakout)) I noticed there is the same ascending triangle pattern which had been rejected 4 times before massive breakout. As I mentioned in my previous analysis I'm bullish on BTC and more likely it will break and pump min to 24-25K, even 28K/my targets mentioned in previous analysis based on my TA. So look at them and pay attention to my other bullish ideas and thoughts)) .

Siacoin - BullishI believe that Siacoin will give us excellent prospects for the next bullrun, it is no coincidence that it presents bottoms that recall a trend reversal in the medium term, therefore in correspondence with the next bullish phase.
I have been investing in this crypto for years because it has a hugely underrated project like Stellar's.

Pi-Cycle Bottom Will Cross Tomorrow Most LikelyThe Pi-Cycle Bottom will most likely cross tomorrow.
If the indicator remains predictive, and consistent with itself, the bottom should occur within a few days of it crossing.
This would imply significant downside coinciding with an important CPI/Fed meeting this week.
There is precedent for the indicator crossing and BTCUSD falling -40% within the following few days.
I've wavered quite a lot on the question of whether the macro bottom is in. Mostly due to Ben Cowen's credibility and views, I'm currently leaning towards the bottom not being in and significant downside still to come. The pi-cycle bottom crossing in this context may impy we will see a large downside move in the next week.

Cycle Bottom Indicator [CBI] - Log Chart [UPDATE 07]For those still following at home, a final update before we get our enviable cross on our custom coded Cycle Bottom Indicator first live test.
As per previous posts, indicator has been fitted using the past two prior cycle bottoms with a 3 day tolerance.

what does it mean for btc?Dxy got rejected from 4h resistance as Spx forming cup and handle formation. As bitcoin follows it's fellow Spx what is about to come? Macro economics promising nothing but charts looks pretty. May be a short term bounce followed by bottom accumulation is waiting for us.

Bottom when?According to Pi Cycle indicator we are very very close to the bottom. May be this week the indicator will give the bottom signal?
Bottom formation and accumulating there for months is a head

BTC Playbook: Relief Rally targets and possible BottomHey all!
It seems like my idea (posted 3 weeks ago) about a potential relief rally is coming to fruition (with a bit of a delay).
I'll keep this analysis quick and simple by giving you all the possible resistances and where I believe the bear market bottom is. Here we go:
Red lines:
The red lines are all my price targets for this relief rally.
I give emphasis on the 200W MA and the 50D MA area. If the price breaks the first, there's a chance we visit the second but I personally believe the probability of heading even higher (towards the 28800 area) is not as great.
If you're wondering why I picked these prices go back to the bull run and you will see those where areas of consolidation during previous upside. As I said tho, for me the most important levels are those around 200W MA and 50D MA.
Green lines:
Green lines are all tested supports. Ironically, all those levels were hiding in plain sight. All of them are levels from November 2020 (right before we broke 2017 ATH)
Those are levels you might considering buying, of course depending on the Price Action (context while visiting each level may vary, making each one a good buy or bad one. Use your brain)
Yellow lines:
Those are untested supports.
For context I've written the dates they come from so you can check why these prices are important.
There's high probability these yellow lines are the bear market bottom. If not then my eyes would target the 11800-12500 area as an extreme bear market bottom
(absolute lowest price I could ever imagine is 10800 and I think it's highly unlikely we'll see it)
Blue background "Zone" = Ranging zone. Not terrible buys but expect a lot of chopping
Green background "Zone" = Good buying opportunity zone. Very good prices to build some spot. Potentially that's also gonna be the bottom unless we go for the extreme scenario of sub 14k.
!!! INVALIDATION !!!
-- My Idea for a relief rally is invalidated if we get extended price action below 20.4k or daily close below 19.2k or weekly close below 19.6k !!!
Generally, I believe we have lee-way, thus, possible upside until either 13/7 when CPI comes out or 19/7 when earnings start to get published.
I am expecting bad earnings to be announced starting 19/7 and on.
On top of that we have FOMC meeting the 27/7 and GDP for Q2 coming out the 29/7 (which will confirm we're in a recession)
So whatever you do make sure to secure profits till 13/7 max 19/7
In short, upside for up to 2 weeks, then return into the inside week range (19600-21800) and eventually towards the actual bear market bottom.
This whole process might take a month or two, so, stay vigilant and be patient.
Good Luck!

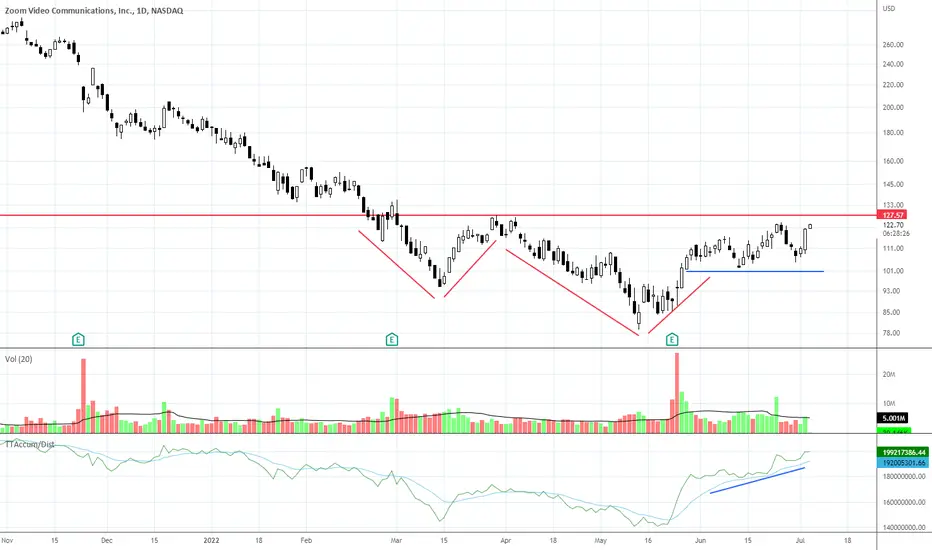
ZM Bottom BuildingThis young company benefited greatly from the pandemic but like all of the some 100+ companies that had huge revenues in 2020 - 2021, it was not sustainable due to the artificial inflation of stock prices via stimulus checks. Since the stimulus was a manipulation of the monetary system and the financial markets, there is no way any firm could manage the situation. So the stock plummeted due to lower revenues and earnings.
Now, it is definitely building a bottom. It is not complete, and I always advise waiting for completion of a bottom because it is emotionally draining for most investors or position traders to watch the stock fall further and wait for it to recover and move up higher thereafter. It takes a lot of discipline and confidence to hold in a final run down in a bear market. So avoid the risk and wait for a completion of the bottom.
BTC Bottom Prediction, Large Fair Value Gap at 12k Area.There is a large Fair Value Gap between $12,058.50 and $12,701.00
I'll check back on this post in the future.

BTC BOTTOM PREDICITION (JULY 5 2022)Heres my best prediction for BTC,
please do note that i am BY NO MEANS at all an expert,
and it would or should and could meet at 85 percent down, 10500
short for now, and long from 12 july onwards, its the bull reversal drawn out here :)

Pi Cycle Bottom IndicatorFor people who are interested in following the Pi Cycle Bottom indicator. I am glad some other people programmed this indicator kudos to them.

Make it or break it for Bitcoin? Make it or break it? Bitcoin will close the weekly candle within two hours. Closing the week below the 0.618 Fib ($ 20.200,-) is not convincing and shows in my opinion weakness for maintaining these price levels. Even $14k is then a possibility; it's the 0.786 Fibonacci retracement level.
An hour ago, Bitcoin made its first attempt to break the 20k level. Volume is pretty low, though, so that doesn't look good for the bulls.
I expect quite a bit of volatility over the next two hours.
Regardless of the low volume, I am still confident that the 0.618 fib is the bottom and a trend reversal is about to occur.
It's time for the bulls to roar; my target is $126.000,-. It is the 1.382 Fibonacci extension.
Time will tell if we'll see $14k first, though.
