$APE's Bottomed - Bull run next 2 DaysPrice Target $16.64 - Bottom is in. I did the work so you don't have to :). Entering Long position now.
Bottom

$GALA 4h_lng_trlngstop tp01: 0.30$GALA long in play.
Adam and Eve / Rounded bottom
Filled at MA cross.
Employ trailing stop.
tp_01: 0.30

SHIB INU - Long As per the pattern made in 1hr chart, SHIB is showing a strong bullish signal. A rounded bottom is a vey strong pattern showing a bullish trend. A long or medium term trade can be held with such outcome of the analysis.
Express your view in the comment section.

ADA is gonna Reach 1.8$ One way or another.🌳ADA has been able to form a Rounded Bottom and It has not been Broken Yet but we can Hope It happens Soon and Satisfy Holders ! There are 2 Bullish Scenarios, One Is That The Price would Start to Increase From Here and reach 1.8$. another one is that the Price wouldn't be able to Break this Pattern and would Want to Do a Little More Correction.In that Case a New Pattern Will be Created which Is called a Cup and Handle Pattern.This pattern will Result in the Same achievement and The Expected Price (1.8$). So In Summary The Price Is gonna Reach 1.8$ one way or another.
_ _ _ _ _ _ _ _ _ _ _ _ _ _ _ _ _ _ _ _ _ _ _ _ _ _ _ _ _ _ _ _ _
Thank you for seeing idea .
Have a nice day and Good luck

ZIL can Reach 0.08$ and there are 2 Bullish Scenarios!🌳ZIL Has been able to Form a Rounded Bottom! Right now There are 2 Bullish Scenarios. One Is that a Bullish Break out Happens Right away & The Price would Increase as much as the Measured Price Movement (The Length Between The Top & Bottom of The Rounded Bottom) another one Is the Price would Do a little more Correction Before Ascending further. In That Case The Price will Create a Cup and Handle Pattern and After That The Price will Be able To Increase . In Both Cases We can Expect the Price to Reach around 0.08$ Which Is a Pretty Strong Resistance as well.
_ _ _ _ _ _ _ _ _ _ _ _ _ _ _ _ _ _ _ _ _ _ _ _ _ _ _ _ _ _ _ _ _
Thank you for seeing idea .
Have a nice day and Good luck

My wishful thinking analysis of Vechain VET-USD hopium VET-USD
I've projected the moving averages to illustrate how long will take VET to start going up again.
hopefully, October will be our bullish month.
I also traced FIb extension to mark my targets. $1.20 will take at least a year.
Finger crossed hahaha.
I want to hear what you think.
Cheers.

LTC 12 HrLTC rounded bottom with a bullish cross on the Stochastic. Money flow curving hard to the positive on a larger time frame. Buy the breakout of the neckline, or the retest. Profit targets are marked. Also, testing the 200ma on the 12 hr.

Top or bottom ? - MAJOR confluence in index futures:Chart shows the combined 3 index. They are weighted so that a 1 point change will imply the same change in $ terms. (For weights see www.barchart.com
In the red box is a confluence of:
Support from 3mo chart (previous 2 candle) in purple
POC of Volume Profile
0.5 Fib of recent HH and LL.
Redbox marks current swing high and low
The Prediction:
Expansion of range
Direction: I assume random

$HOOD has to go up eventually, right?$HOOD is very underpriced here imo, and this looks like it could be the start of a nice bottom

MATIC restart falling wedge with double bottom on 15minMATIC restart falling wedge with double bottom on 15min. MATIC seemed to have held well in comparison to other altcoins

BTC daily ma50 Monday 14BTC daily ma50 will probably curve up Monday 14, by being more than 50 days from its last bottom.

$BTC v $DXYVery interesting correlation between Bitcoin cycle peaks/bottoms in comparison to the strength/weakness in the $USD.
The $DXY is coming into historical resistance, is this time different? or as shown in the past, be an indicator that we are going to see strength in Bitcoin once again?

SOLANA Slope RSI at an extreme pointThere has not been a pattern to confirm the bottom yet and it would be unwise to enter a trade right now but we the indicators are telling me that the bottom has been reached. The honey Cypher VWAP is at a very low point, the previous time it reached this level we got a massive move to the upside. At this point we had a double bottom formation which further increased the likelyhood of a strong trend.
My strategy here is to wait for a reversal pattern to surface and enter a trade with a very small stop loss, -2% with a TP1 5% TP2 10% and a trailing at 3% with -3%. You could also enter a trade the moment a reversal brick get's printed but that is less reliable than the patterns.
Link to the bounded slope oscillator.

ADAUSD Double Bottom Play for ReversalImportant things to note:
I am going to start posting my main market overview in a BTC chart instead of cramming everything into an ADA chart.
I will be posting alt charts throughout the week (this just makes sense structurally).
BTC looks rather good from every angle (on chain, technically, and in the macro space).
I bet in early Feb that BTC was going to 53k in March and here we are so that is what I am expecting.
Not only is volume going up for BTC but alts in general.
ADA has gotten beaten down for some time and nothing lasts forever.
ADA has not seen a substantial increase in volume.
ADA is sitting at last support before a drop to next support.
A bullish scenario would be a retest of support (on going currently) and a reversal.
This retest will tell us a lot about the market level of ADA.
Hey everyone, I'm back! A lot of you have been wondering where I have been so let me update you. I have been spending my time in both crypto and tradfi, trading derivatives aggressively with friends primarily. The volatility has been high so February was the time to harvest some sweet premium. People that have reached out to me in the month that I wasn't updating knew I was still here watching the charts. I really didn't see much need to update anything other than saying buy everything you can, which I have been doing as you are all aware. I do not have much time so I am going to change things up a bit. I will be posting my main market overviews on a BTC chart from here on out because that just makes more sense. I will be posting my alt charts throughout the week including ADA. I have to admit though, getting a chart taken down for mentioning something I am trying to put together to help you guys really soured me when it comes to putting out charts on TV. Especially considering I put a lot of thought and effort into this with the limited time I have. Hope you understand.
The market and ADA - BTC looks great on chain, technically, and has found its place in a harsh macro environment. This was proven by the fact that it held at a very important level. Supply is great and since the only thing we were lacking was demand, the fact that volume has been increasing is a good thing. I can also see the bid sizes looking very healthy. I had BTC pegged in early FEB for a double bottom reversal and a 53k target in March. We got the first part and now waiting on the run to 53k, flipping sentiment. ADA has had a rough go of things as of late. Every time it has found support, it has gotten beat down tremendously. It is currently sitting at the last support before a fall to 45 cents with a brief retest of 75 cents. This next retest of support is important. Mostly because it will determine if ADA can reverse course or fall to the next range (45 cents). Since I believe the BTC reversal is upon us, obviously I think this retest will end up in a double bottom, and a slow grind upwards until alt season hits. This will cause ADA to range primarily until the bit jump up, which will likely be just as fast as the last. A lot of the price action has to do with the fundamentals of a slow growing chain, fortunately or unfortunately depending on how you look at it. Thanks again everyone!
So, tell me what you think!
This is not financial advice. Do your own due diligence.

LINK/USDT - bullish reversal pattern close to breakoutLINK/USDT is currently right at the tip of a falling wedge after having quickly pinged the macro 0.786 fib level which makes me very optimistic about this being the bottom and seeing a successful reversal. In addition to that we can also see significant bullish divergence on the daily which ranges back to December and further increases the odds of a textbook breakout which LINK tends to have especially with falling wedges (examples can be seen in my earlier charts linked below in the related ideas section).
On shorter time frames LINK is currently forming an inverse H&S which combined with the falling wedge makes for a great reversal pattern which produces consistent results and is close to completion.
LINK/USDT 1hr:
Since LINK is a long-term hold for me I usually don't use stop losses and mainly look for prices to accumulate more but for a swing trade I'd consider one slightly below the last 0.786 ping since losing that level would render it a descending triangle breakout and likely lead to a longer bear trend.
Please note that the price projection is just that and should only guide as a visual aid for the direction I expect it to go.
With staking said to release this year this looks like a great opportunity to stock up on some LINK at a discount before the action starts.
Best of luck with your trades and let me know what you think!

LINKBTC - close to the bottomLINKBTC is near the tip of a falling wedge which have a bullish bias and it's very close to the daily 200 SMA.
We can see bullish divergence on almost all timeframes and the 23500 - 25000 range is a zone of major support.
The parabola for LINK/BTC is still intact and it's very close to it.
This all points to a reversal in the near future and looks like a great zone to accumulate for long-term positions.
Let me know what you think and best of luck with your trades!

HEX could turn bullish if...HEX current price is 14.05c
I think the Ukrainan war max fear has gone . If things won`t escalade ,and more countries will step in ,I think there`s a decent chance markets will find a bottom soon . If things will escalade ,then your last worry will be crypto prices ,and you can threw out of the window all TA`...
Hex needs to close above old support 17-18c c (daily ,preferably a weekly candle close) but even 16,5c is good enough to turn NEUTRAL.
23,5c-24c (thats where the 21 weekly EMA is ,but also horizontal S/R) is another major resistance .If you see prices higher then 23c ,thing could turn really BULLISH
In the past 24-48hours, HEX had all the reasons to go under 10c ...didn`t happened and now there is a decent chance price could form W bottom around the 12c (no bullish divergence tho) and go back to at least 16-17c.

Falling wedge on the Weekly VECHAINWe have this beautiful falling wedge on the weekly chart.
As we all know Vechain has great fundamentals but the price is falling like rain, but i think we are at the bottom, because of this falling wedge on the weekly.
I have missed the train and bull run for vechain and now i am happy to have this opportunity to buy that great project so cheap.
The price target should be at the top of the wedge which is 25 cents but i think we can go way above that if the bitcoin goes up which i think it will.
What do you think about this falling wedge?
Feel free to leave a comment.
If you like my ideas please follow me and like the post because i am posting every day and you can find always something interesting on my profile, i am new to Treadingview but i have 6 years expirience in trading.
VET TO THE MOON!

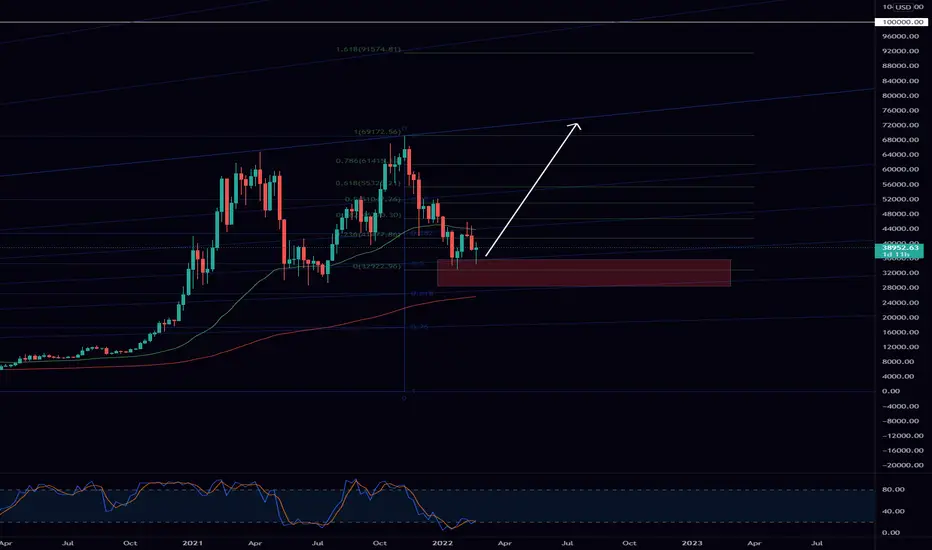
BITCOIN IS BULLISH - CALLING THE BOTTOM!I am not very good at explanations so will let the chart do the talking. Those blue lines are Fibonacci speed resistance fan lines, that have identified the ATH's and areas of support for the last couple of years running. I am quite confident it is up from here, however, this is a weekly chart so there could be periods of delay through micro trends etc. We also have a green reverse FIbo identifying possible areas of support and resistance towards 100k if we are able to break the current fan trend.
The red area zone is the validation zone, I would expect the price to float around this zone if the market is continue with bearish pressure. This being, looking at the weekly candles, I expect 41k by the end of this weekend for the weekly close, which will help validate the chart patterns shown. Total transparency, I am going heavy exposure equity wise with BTC from here (no leverage so no liquidation).
Published the analysis just to look back and see if I was right or wrong in a couple of years- hodl!
-- @MyNamesZergg
⚡️⚡️ #RAY/USDT - Potential 85% ⚡️⚡️⚡️⚡️ #RAY/USDT - Potential 85% ⚡️⚡️
#BLOCKSHOT
Signal Type: Spot - Long
Exchange: Binance
Note: Bullish Weekly Pivot || Bullish RSI Divergence || Strong BTC Movement || Lots Of Long Orders Coming In
Entry: 2.35 - 2.65
Target 1: 2.88
Target 2: 3.17
Target 3: 3.84
Target 4: 4.38
Stop-Loss: 2.00
"Good Things Come To Those Who Wait,
Great Things Come To Those Who HODL"

⚡️⚡️ #EPS/USDT - Potential 103% ⚡️⚡️⚡️⚡️ #EPS/USDT - Potential 103% ⚡️⚡️
#BLOCKSHOT
Signal Type: Spot - Long
Exchange: Binance
Note: Double Bottom || Looking like floor price || Breakout needed
Entry: 0.144 - 0.167
Target 1: 0.177
Target 2: 0.208
Target 3: 0.248
Target 4: 0.293
Stop-Loss: 0.133 or None
"Good Things Come To Those Who Wait,
Great Things Come To Those Who HODL"

HOLD! Don't sell your ADA!Hello everyone,
yesterday after 1 year we had our first lower low, whoever I cannot be anything else that's not bullish.
There is one more low ahead, after that we are going to see the results behind our hard times.
Have a nice trading week!

Could this be ETH bottom?2600 avg all day, and now we see it has been a common support and resistance lv. What could this be? a bottom for ETH? are we gathering rocket fuel? Maybe 1700 and 2200 are now out? Im not sure but it's starting to look that way because low vol and slight move up will triggers bulls to run IMHO.
