BTC Bottom - Macro Running Flat Elliott WaveMacro correction after leading impulse. Compared with the SPX.
Consolidate here. Then Pampet
Bottom

hmmm... bottom's in?well, looking at my line, we can see that there's a falling wedge pattern for BTC USD pair;
if we are in its range, worst case if we fall lower would probably in 28K range as it is also the 0.618 fib level from MARCH 2020 low to the BTC high back in NOV 2021.
Let us see where the BTC will act and move in the coming days..
FYI, if it breaks upwards, target would then be the previous high even though it seems to be very unlikely to happen as there are many resistance BTC need to face before claiming new ATH. But, anything can happen..
What I want to see:
A consolidation for couple of days or even weeks in current price range would be very very good rather than just shoot up and come back down again!!
#DYOR
#NFA

IWM has bottomedWith the move down today and subsequent reversal it is likely IWM has bottomed. We can see that the pattern the last few months is corrective in nature taking an ABC course but the Russell has a lot of work to do to prove it wants to go higher long term. Short term I am am bullish based on MFI reaching very oversold levels, fibonacci extensions being hit and near perfect symmetry with an only 20 cent delta b/w the A and C legs of the ABC


BTC Potentially taking out stops-Local bottom is likely in for LTF
-Liquidity above
-Funding negative
-HTF still bearish, targeting lows.

BTC Some relief?-LTF bottom potentially found.
-Liquidity above
-Funding negative
-Buying some spot, observing for reaction.
-Reasonable probability for relief rally.

The Bitcoin may have bottomed todayHey Trader,
please see my idea on BTCUSD. I went through every single wave and I am pretty confident that I found our bottom.
Please keep in mind that my technical analyzing isn' certain a 100% and that I don't provide financial advices.
Your RT


ADA should you sell? Hello everyone,
I bet everyone is worried about the current situation.
Few days ago we were bullish, ADA price was pumping and now we dipped back to the $0.9 level.
What is going to happen next? Where is the bottom?
Have a nice trading weekend!

i expect 38k bottom. maybe one final dump. then upfalling wedge = bullish. howeever, i am a bear and hope btc to crash to 30k. this will take time.

Bitcoin Dominance double bottom formation❓- Yello, ladies and gentlemen😎!
💎In our last BTC.D analysis in telegram we predicted the drop towards 39.54%, 261.8% Fibs. Immediately after, BTC.D followed the projected pattern and dropped by over 2%.
💎In fact, the BTC dominance formed a double bottom near 39.40% and currently trading at 40.5%. So the big question is whether it will reverse to the upside or the downtrend will continue.
💎Right now, we must consider several important facts.......

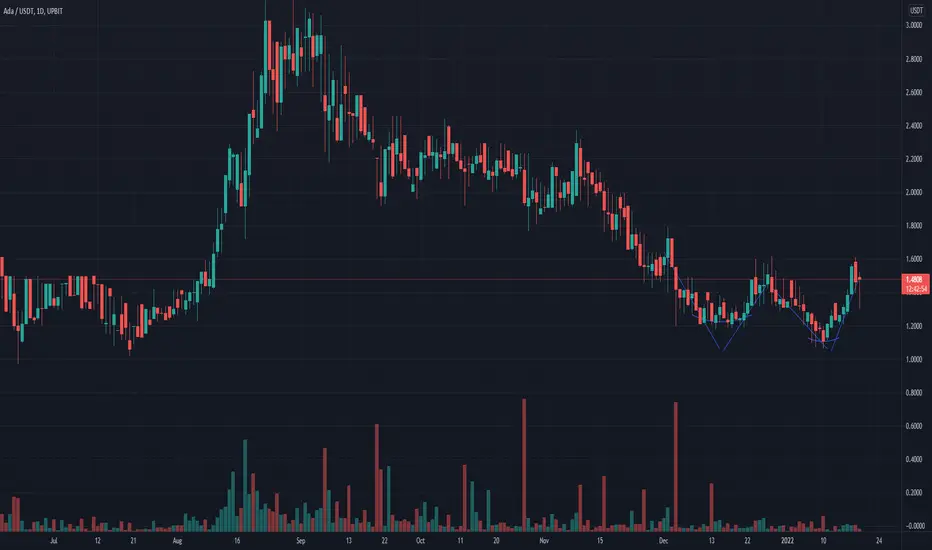
ADA Double Bottom Pattern - Short term bull?double bottom "W" pattern. Still new to this, comment if you agree/disagree !
obv not financial advice
🌳FTM's Possible Movement In near FutureHello every one
FANTOM / TETHERUS
Fantom Is near It's ATH Now which Is quite Good. The FTM which We are Talking about Is a Great Project with a Lot of Potential. But We Want To Talk about Technical Stuff First. So as you Can See, The Price Is in a Big Rounded Bottom which Means The Price Is gonna Increase as Soon as A Break out happens. Since There Is No Break out, We Can Not Determine If It's gonna Happen or Not But when The Break out Confirms The Bullish Trend, We Shall See A Great Bullish Movement as Much as The Measured Price Movement (AB=CD). The Expected Movement Would Create a New ATH Far From This one So It is gonna Be hard & Take Some Time To do That So Please Be aware of This & The ATH right now Is Gonna Be It's Biggest Resistance around 3.4$.
🟡What Is Fantom (FTM)?
Fantom is a directed acyclic graph (DAG) smart contract platform providing decentralized finance (DeFi) services to developers using its own bespoke consensus algorithm.
Together with its in-house token FTM, Fantom aims to solve problems associated with smart-contract platforms, specifically transaction speed, which developers say they have reduced to under two seconds.
The Fantom Foundation, which oversees the Fantom product offering, was originally created in 2018, with the launch of OPERA, Fantom’s mainnet, coming in December 2019.
🔴This is only an idea and not a financial advise ( NFA )🔴
💎Traders, if you liked this idea or have your opinion on it, write in the comments, We will be glad.
Thank you for seeing idea .
Have a nice day and Good luck

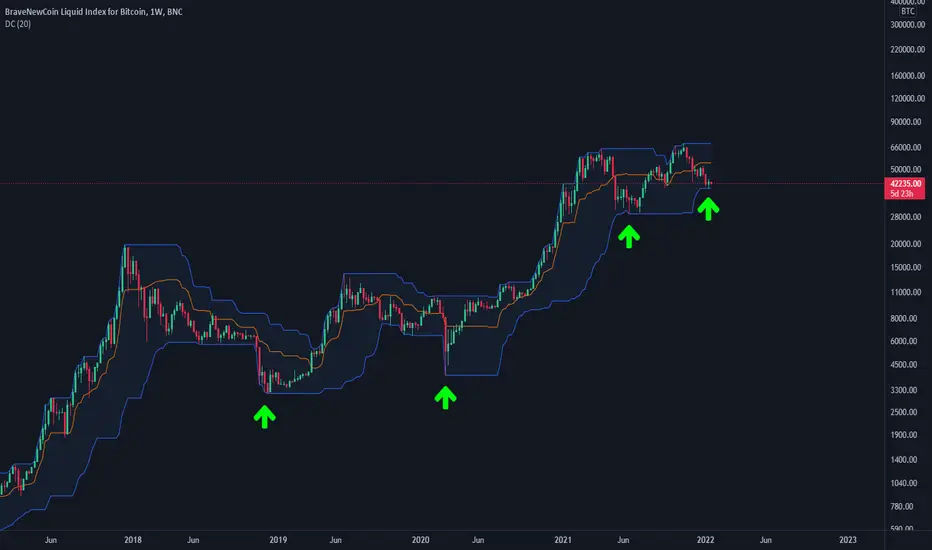
Bitcoin bullish indicator on weeklyI know previous results doesn't guarantee future results, but if we check this indicator we can see clearly when BTC touch this channel levels (bottoms) has performed very well on weekly TF. Does this time will bounce again? Who knows, let's see.
IS THIS THE BOTTOM FOR BITCOIN???Well would you look at that, a Bitcoin analysis.
Opting for the Higher time frames here, from the chart above we have 4 trendlines, all of which have played significant roles in bitcoin achieveing it's current price action.
Looking at the trendline that initiated the bounce on November in the year 2011, bitcoin has found itself at the trendline once again after a tiresome year of sideways movement. You could say this is the bottom.
Now in march year 2020, a sell-off came about due to the news of Covid-19 which was a life event that threw technical analysis out the window and saw us create a new trend support.
Prior to that, Bitcoin took a bounce off the first trend support shown in the chart and went up all the way to our current trend resistance to make a local top of 13.9k before initiating the covid sell-off event, a move which spanned 9months(274days) from local top to global bottom and still managed to close the month just above our Nov. '11 trend support. (Which means it is a strong area of support)
Right now, bitcoin once again has hit that same resistance where the local top was made, and is at the trend support from which the sell off eventually closed its candle but is also on the 9th month of the move (but 275 days instead). Should this monthly candle close without making a sell-off to the covid trendline, i can confidently say this is the bottom and that we would see new highs including a cycle top this year by at least Q2.
But becareful, some alts still havent reached support, so it is possible that this isn't the bottom.
If you agree with this idea, pls make sure to like and leave your thoughts in the comments section.
As always, feedback is appreciated.

Bitcoin. The bottom is in.Bitcoin is at its bottom. Money is flowing off exchanges, whales are accumulating, fear index is high… and several other indicators showing Bitcoin is ready. There is certainly a scenario where one ore two more trend lines are printed below this which could mean a flash crash to 33-36k but would be short lived. I would place buy orders in that range in case. Other than that, load up ladies and gentlemen. We may never see 40k again.

Does Chainlink Have enough Momentum to Push Through this Wave?Projection of Links Wave Movent and its consistent significantl loss of momentum after every wave. Only at the beginning did it throttle through. Is this the next major push?. Possible collapse after $34 yet again. But looks like we may have the cloud in our favor. We'll see.

TIDAL/USDT in bottom? Divergence on daily chartTIDAL/USDT in bottom? Divergence on daily chart, Tidal finance insurance is great project !

The bottom is in for UPSTUPST looks to have finally bottomed. Overblown sell off is a great buying opportunity. Yesterday's candle is very bullish at a level of support. Entering a riding UPST back to at least $150.

ADA this is the BOTTOMHello everyone,
I hope everyone is enjoying the bottom of this bearish market and I hope your bags are full!
Enjoy the video!

Rose Double Bottom inside Cup w/ Handle w/ subsequent upside.When ROSE passes the top of the handle, I'll be looking at an entry (maybe there,) to add to my position!

Has BTC bottomed at 39.5K? Welcome to this analysis about BTC . We are looking at the daily timeframe perspective, the recent events, the established daily falling wedge and some indicators. BTC hit my last and main support at 39.5K September low and made double bottom and rejected at support area with strong buying pressure. It is obvious there is a huge buying demand AT 39.5-40k level. At the same time BTC created a daily huge falling wedge and need to break it up to stay bullish and continue its upward movement. It has to hold 39.5K keeping bullish perspectives. If we lose this level and close weekly candle below 39.5K, more likely we are in a bear market and BTC topped at 69K and we'll see sharp and quick dump to 30K then 20K. But if we see strong bounce from this region to 46K then 52K and close weekly candle above 21, 34 weekly EMA and 50 weekly MA . The mentioned scenario will increase probability to make new ATH and more likely BTC enters to super cycle and we'll see 100K + by 2022. At this moment BTC is in a critical point and is consolidating at the main horizontal support at the lower band of Keltner channels which is not a good sign. BTW daily RSR is an oversold territory and MACD is in a bearish cross which is sign of losing momentum but at the same time we noticed stochastic bullish cross above 20 that could change our momentum to the upside. Another bullish and bearish signs, scenarios we'll discuss at the weekly timeframe a little bit later where I would explain why I think if BTC loses 39.5K level we are in a bear market.
Thanks for your reading.

50K and Beyond. Let's Go!Me Gusta.
But I need to write here something more than that only.
Guys what do you think, are you with me back in bull run?
