Bitcoin Corrective Wave MetricsAnalysis of long-term corrective waves from ATH's of different historic periods
Facts:
The drop of 93.75% back in 2011 was the biggest correction of all time.
With time the corrections after new established ATH's got gradually smaller.
I'll use fibonacci retracement to measure those heavy drops as ATH - 1 and bottom as 0 to document how measurements of historic drops could define levels of forthcoming waves.
-93.75% capture:
2.272 made next ATH of 2013
1.618 defined the 2015 bottom
Similarly, -86.96% fib measurement defined:
Next ATH of 2017 at between 2.272 and 2.414
Level of 1.414 called the bottom
-84.22% drop:
This time 1.618 called ATH of 2021
Level between 1 and 0.786 made 2022 bottom
Logistic curve partially explains why forthcoming bottoms got close to the previous ATHs
The question is, could that be a sign of already saturated market which would cause btc to sidetrend making a long-term diamond pattern. Despite of Bitcoin being deflationary asset, the rate of growth has been slowing down, as the % of bullrun waves got smaller.
Knowing about positive correlation BTC and SP500, we can deduce that BTC wouldn't have grown if not for SP500. This dependence would be a venerability for Bitcoin, if AMEX:SPY drops in the nearest future.
Nevertheless, many authors in TradingView are optimistic about further growth. The fact that current price still holds at previous ATH levels, could indicate that crowd could be actually right.
So to estimate where it would stop, I'll use most frequent fib levels which defined both next bottoms and ATH's.
Levels are: 1.272, 1.414, 1.618 and 2.272
Bottom

MJ ETF (cannabis) - Potential Double Bottom Pattern - MonthlyMJ ETF (cannabis) has potentially double-bottomed over the past 6 months (october 2023 to march 2024).
Either a possible tradable bounce, or a long-term rally could occur over time as more countries partially legalize cannabis and marijuana.
Long-term resistance price targets would be: $6, $9, $14, $18.
Support price targets below would be $3, $2.50, $2, $1.
Cannabis companies and stocks are highly sensitive to Government Laws & Regulation changes, Fundamental Catalysts, and Corporate Earnings.

🚧LPTUSDT is Bullish now🚧 & many Traders don't see it 👀!!!Hi.
COINEX:LPTUSDT
😊 Today, I want to analyze Bitcoin for you in a Weekly time frame so that we can have a Mid-term view of LPTUSDT regarding the technical analysis. (Please ✌️respectfully✌️share if you have a different opinion from me or other analysts).
LPT has Created a Large Rounded Bottom. This Means The Price Can Increase as Much as the Length Between The Top and The Bottom Of the Rounded Bottom. Since the rounded bottom is Not broken. The price can have a good rally after the breakout.
✅ Due to the Ascending structure of the chart...
- High potential areas are clear in the chart.
- Rounded Bottom
- AB=CD
Stay awesome my friends.
_ _ _ _ _ _ _ _ _ _ _ _ _ _ _ _ _ _ _ _ _ _ _ _ _ _ _ _ _ _ _ _ _
✅Thank you, and for more ideas, hit ❤️Like❤️ and 🌟Follow🌟!
⚠️Things can change...
The markets are always changing and even with all these signals, the market changes tend to be strong and fast!!

BTC Road Map🗺️!!! situation+next targets.Hi.
BINANCE:BTCUSDT
Today, I want to analyze BTC for you in a weekly time frame so that we can have a mid-term view of BTC regarding the technical analysis. (Please ✌️respectfully✌️share if you have a different opinion from me or other analysts).
We have a Bullish Structure here
BTC formed a rounding bottom on weekly timeframe🤔
Up we go if we do breakout
✅ Due to the Ascending structure of the chart...
- High potential areas are clear in the chart.
- AB=CD
Stay awesome my friends.
_ _ _ _ _ _ _ _ _ _ _ _ _ _ _ _ _ _ _ _ _ _ _ _ _ _ _ _ _ _ _ _ _
✅Thank you, and for more ideas, hit ❤️Like❤️ and 🌟Follow🌟!
⚠️Things can change...
The markets are always changing and even with all these signals, the market changes tend to be strong and fast!!

SHOPPING TIME
- TheKing is struggling but altcoins are almost bottomed.
-" the time to buy is when there's blood in the streets ".
- All in graph. Stay S4fe and don't go all in.
Happy Tr4Ding !

Bitcoin On The Way To 57K!!!Hi.
COINEX:BTCUSDT
😊Today, I want to analyze Bitcoin for you in a 12h time frame so that we can have a Mid-term view of Bitcoin regarding the technical analysis. (Please ✌️ respectfully ✌️share if you have a different opinion from me or other analysts).
BTCUSD has Created a Large Rounded Bottom. This Means The Price Can Increase as Much as the Length Between The Top and The Bottom Of the Rounded Bottom. Since the rounded bottom is broken. The price can have a good rise.
✅ Due to the Ascending structure of the chart...
- High potential areas are clear in the chart.
- Rounded Bottom
Stay awesome my friends.
_ _ _ _ _ _ _ _ _ _ _ _ _ _ _ _ _ _ _ _ _ _ _ _ _ _ _ _ _ _ _ _ _
✅Thank you, and for more ideas, hit ❤️ Like ❤️ and 🌟 Follow 🌟!
⚠️Things can change...
The markets are always changing and even with all these signals, the market changes tend to be strong and fast!!

BINANCE:FILUSDT - Double is the best for LONG entry ---------------------------------------------------------------
Description
---------------------------------------------------------------
+ FIL has recently formed a notable double bottom pattern.
+ Overall, FIL exhibits strong bullish sentiment, with the next target projected at 8.115.
+ This rebound from support suggests a promising trend ahead.
---------------------------------------------------------------
VectorAlgo Trade Details
------------------------------
Entry Price: 5.399
Stop Loss: 4.630
------------------------------
Targets 1: 5.894
Targets 2: 6.481
Targets 3: 7.193
Targets 4: 8.115
------------------------------
Timeframe: 1D
Capital: 1-2% of trading capital
Leverage: 5-10x
---------------------------------------------------------------
Enhance, Trade, Grow
---------------------------------------------------------------
Agree or Disagree with the ideas ? lets discuss in the comments.
Like and follow us for more ideas.
Regards
VectorAlgo

BINANCE:HBARUSDT - Double bottom is giving double profits. ---------------------------------------------------------------
Description
---------------------------------------------------------------
+ The double bottom pattern stands out as one of the most reliable indicators of a potential reversal in market sentiment. Its appearance often heralds a shift from a downtrend to an uptrend, making it a favored pattern among traders seeking opportunities for profitable reversals.
+ A meticulous analysis reveals a distinct and well-defined double bottom pattern, characterised by two consecutive troughs followed by a significant rebound. This pattern's adherence to the classic double bottom structure further enhances its reliability as a signal for a bullish reversal. Traders recognising the significance of this pattern would undoubtedly find this observation noteworthy, as it strengthens the case for an imminent uptrend.
+ With the double bottom pattern confirming its efficacy through a robust bounce-back, attention naturally turns towards identifying potential price targets. The next target for this trade is projected to be 0.1014, representing a significant milestone in the anticipated uptrend. Market participants tracking this trade closely would view this target as a key level to monitor, as its attainment could signal further bullish momentum in the asset's price trajectory.
---------------------------------------------------------------
VectorAlgo Trade Details
------------------------------
Entry Price: 0.0781
Stop Loss: 0.0671
------------------------------
Targets 1: 0.0817
Targets 2: 0.0854
Targets 3: 0.0927
Targets 4: 0.1014
------------------------------
Timeframe: 1D
Capital: 1-2% of trading capital
Leverage: 5-10x
---------------------------------------------------------------
Enhance, Trade, Grow
---------------------------------------------------------------
Agree or Disagree with the ideas ? lets discuss in the comments.
Like and follow us for more ideas.
Regards
VectorAlgo

ID's Situation: What Shall we Expect!IDUSDT has Created a Large Rounded Bottom. This Means The Price Can Increase as Much as the Length Between The Top and The Bottom Of the Rounded Bottom. Since there are no Break out, There is no Confirmations So we must Wait for Confirmation of a Bullish Trend .
_ _ _ _ _ _ _ _ _ _ _ _ _ _ _ _ _ _ _ _ _ _ _ _ _ _ _ _ _ _ _ _ _
🤑Stay awesome my friends.
✅Thank you, and for more ideas, hit ❤️Like❤️ and 🌟Follow🌟!

EURNZD LONG deep technical analysisFor this video i just wanted to go into a more deeper analysis of currency pair EUNZD and why i feel like buyers will take control. I want to see buyers push price back to 1.78 .

COIN Completes First Post-IPO BottomAs the first of its kind, this young company has a bright future.
Weekly chart: NASDAQ:COIN has completed its first post-IPO bottom formation and is holding above the completion line despite some selling down in recent weeks.
The company reports Feb 15th. The fundamentals are most likely at or near the bottom completion level. The run up became over-speculated so a minor correction is underway that can dip into the completion level, but support from the bottom formation is strong with Dark Pool buy zone patterns.

GBPJPY/GBPAUD LONGIn my previous videos i shorted GBPAUD but all of the pound is showing strong bullish pressure. i got out at a loss and now I've seen gbpaud break a level of resistance now ill be waiting on gbapaud to test the level of resistance and hold as support simple. gbpjpy long is already in profit so im just waiting to see how this plays out.
*GBPAUD
*GBPJPY

PURPLE (PRPL) may be in the process of reversal.PURPLE, yes the mattress company, has bee getting hammered for a while now. Their stock price was mile higher than it is now, but it looks like the bottom may just be in. And, it's gone down so much, compared to what it used to be, that the risk involved in investing, or trading it has decreased as well. Keep in mind that this company is extremely subject to interest rates, and interest hikes/cuts.
This would probably be a good play for some mid to longer term options plays. Just make sure there's open interest in the strike if you do buy one, as liquidity is key to options trading.
Good luck, and always use a stop.

Be patient.A perfect months for accumulation., at least till June. So don't expect new sky highs around the halving in April.

Right time to Long (Datapattn)Must give space in your portfolio (10% to 20% in 20 days)
Why ?
Data Patterns (India) Ltd
ABOUT
Data Patterns (India) Limited is one of the fastest-growing companies in the Defence and Aerospace Electronics sector in India. It is among the few vertically integrated defence
and aerospace electronics solutions providers
catering to the indigenously developed defence products industry. It is focused on in-house development and manufacturing facilities led by innovation and design and development efforts. It is in the business for over 35 years. It has supplied products catering to all the platforms, viz., space, air, land and sea, including products for LCA-Tejas, LightUtility Helicopter, BrahMos missile.
KEY POINTS
Leading Defence Oriented Company
Data Patterns cater to the entire spectrum of defence and aerospace platforms like space, air, land, sea and under-sea. It has design capabilities across the entire spectrum of strategic aerospace and defence electronics solutions including processors, power, radio frequency and microwave equipment, embedded software and firmware and mechanical engineering.
Product Portfolio
Radars, Underwater electronics/communications/other systems, Electronic warfare suite, BrahMos programme, Avionics, small satellites, ATE for defence and aerospace systems, Commercial off-the-shelf (COTS). Leading product of the company is Radar with 54% contribution to the revenue.
Manufacturing Facilities
Company's manufacturing facility spans across 200,000 sq. ft factory built on 8.56 acres of land in Chennai. It has facilities for design, manufacturing, qualification, and life cycle support of electronic systems used in defence and aerospace applications. The facility has EMS assembly capacity of 600 boards/day.
The company has 1,130 employees with 700+ qualified engineers as on 31.3.23. They commissioned a New Manufacturing facility in Q4FY23.
On-Going Projects
The company is currently engaged in the supply of critical products to several prestigious defence projects in India, including the Light Combat Aircraft (LCA), the HAL Dhruv, Light Utility Helicopter (LUH) and the BrahMos missile programme, precision approach radars and various communications intelligence (COMINT) and electronic intelligence (ELINT) systems.
Key Customers
Bharat Electronics Ltd (BEL), Hindustan Aeronautics Limited (HAL), the Indian Space Research Organization (ISRO) and Defense Research and Development Organization (DRDO).
DRDO contributed 42% of the total turnover.
Dependent on GOI Entities
The company’s business is dependent on projects and programmes undertaken by GOI and associated entities such as defence public sector undertakings and government organisations involved in space research and Supply of products to prestigious defence projects in India Like LCA, the HAL Dhruv, LUH and the BrahMos missile programme. Data Patterns derives a significant portion (~45-50%) of its total sales from contracts with GOI entities.
Order Book
As of FY23, company's order book stood at Rs. 924.1 Cr. vs Rs. 476 Cr in FY22.In FY23, company had the highest-ever order inflow of Rs. 901 crores. The company got additional orders from April- May 2023 worth Rs 83.9 cr.
**Liquidity **
Company has Cash and cash equivalents
Rs.682.5 Cr as of 31.3.23.
IPO Details
In FY22, company raised 588 cr. through an IPO of which Rs. 240 cr. was a fresh issue and the remaining 348 cr. was an offer for sale. The IPO proceeds were utilized for:
1. Expanding manufacturing and testing facilities in Chennai and enhancing system integration facility.
Out of the total fund raised, 51.21 crores was unutilized as on March 31, 2023.
Investment through QIP in FY23
Company is making large investments in product development in Satellite, Radar, Electronic Warfare and Communications. It has raised further funds of Rs 500 Cr. through QIP for development of these products. Initially, these products will be introduced in the domestic market.The Company has issued and allotted 4,097,319 equity shares through QIP at an issue price of Rs.1,220.31/- on March 13, 2023. Out of the proceeds, Rs.462.73 crs is unutilized as on March 31, 2023.
Change in Statutory Auditors
Deloitte Haskins & Sells LLP were appointed as the statutory auditors in place of M/s. R.G.N. Price & Co. Fees for FY24 was decided at Rs47 lakhs exclusive of taxes and other expenses.
CAPEX FY23
Company added Rs. 74.47 Crores to their gross block with capital expenditure, including Right to the Assets (ROU) of Rs.47.22 Crores on building & lease, Rs.10.77 Crores on technology infra, Rs.16.48 Crores on physical infra and the balance Rs.1.03 Crores on intangible asset addition.
If you make profit, don't forget me (+919955150786)
Gift a pitza😎

NIO - Massive long at what could be the absolute bottom. I posted this a week ago but not much has changed. It was taken down by moderators because I mentioned something that went against house rules. Nonetheless:
ORIGINAL POST:
Nio has double bottomed on the weekly at local level with bullish divergence on the MaCD. It is also showing a clear shift in momentum on the 4H and Daily timeframes. We took this position a few days ago, and have already taken very small profits at the first tp level. I was unable to post here as my account has been hacked for the past 3 weeks and I have only just gotten it back, hence the lack of updates overall. Having said that the community took this trade.
I am posting this now as I believe that if we get above 8.36 then one could strategise a trade on a backtest of that level, so you guys could enter there if you haven't already.
The weekly is posted below

X Coin or DASH ($DASH)
Dash coin, a pioneer in the cryptocurrency realm, stands as a testament to resilience and innovation. Its enduring history is a source of inspiration, showcasing that even in the dynamic landscape of digital assets, steadfast determination can lead to triumphs. Embrace the spirit of Dash's journey, and let it fuel your motivation to navigate the challenges and triumph in your own endeavors.
Now or Never
#DASH ⚡ Ready for melting the World 🌍 .

Attempting to predict bottom $BTCNothing to be taken seriously - I'm no expert.
30% down after breaking 200 MA on the weekly. This particular percentage downward has occurred twice before, after breaking 200 MA.
Using a trend based fib extension the 1.618 mark is not far of from above mentioned bottom target.
Leaving potential buy zones between 17900 and 15500.
We shall wait and see what the mark has to offer.

I Cannot Short This !!! situation+next targets.Hi.
Time to break out of the rounding bottom on weekly & also above the key level.
AB=CD
✅Thank you, and for more ideas, hit ❤️Like❤️ and 🌟Follow🌟!

ETHBTC - The Final Support and The Final CallBitcoin has been very dominant and managed to push ETH all the way to the final support line. This is a 4 years old diagonal support which crosses with a 6 years old horizontal support line.
Please tell me if I am wrong, I see a three patterns when zoomed out;
First is a massive rising double bottom,
Second is a massive cup and handle,
Third is a massive inverse head and shoulders.
All indicators seems to have bottomed out as well.
And on the other hand, Ethereum network is very active, wallet count is increasing, burning mechanism is working well; in the last 30 days -39,767.33 ETH were burned. It is simply deflationary.
My observation causes my instincts to tell me that this is the final call before the big flippening narrative starts to be spreading again.
I know BTC is the key player in crypto, but I dont see ETH getting crashed any further againts it.
Do you see any bearish patterns or signals? Please let me know in the comments if you agree or disagree with me.

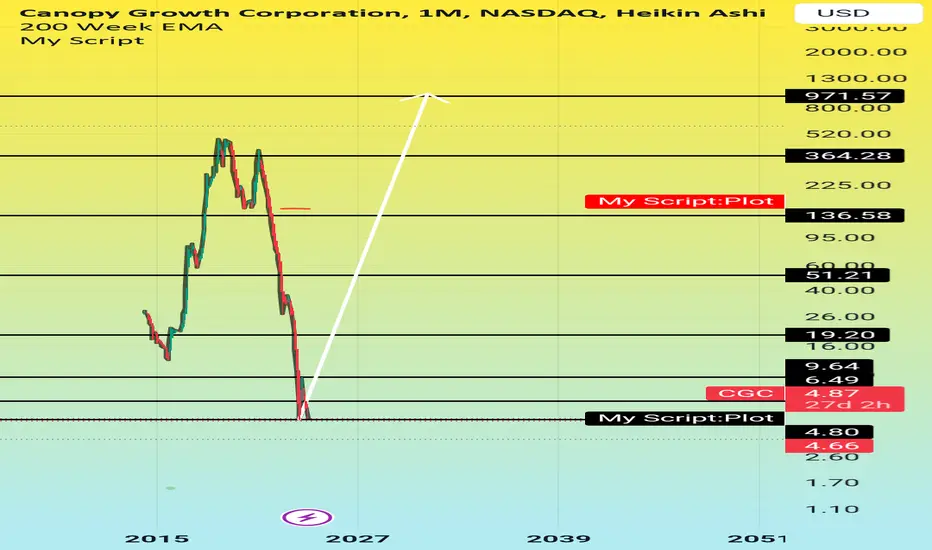
CGC (Cannabis stock )Investing in cannabis stocks has been a rollercoaster ride, with fluctuating values due to legal, regulatory, and market factors. Despite volatility, the future looks promising as legalization continues in various regions. Motivation lies in the potential growth as the industry matures and gains wider acceptance, leading to increased market opportunities and potential profits for savvy investors. Understanding the landscape, staying informed about legislative changes, and diversifying your portfolio can help navigate the uncertainties and maximize the potential of cannabis stocks in the long run
SOLANA Solana is a blockchain platform which uses a proof-of-stake mechanism to provide smart contract functionality. Its native cryptocurrency is SOL. Solana was launched in 2020 by Solana Labs, which was founded by Anatoly Yakovenko and Raj Gokal in 2018.

AUDCAD MULTI TIME FRAME ANALYSIS Hello Traders! 🌟
Today, we're diving deep into an exciting analysis of the AUD/CAD pair. Get ready, as we unfold the story this chart is telling us across various timeframes! 📈🔍
📊 Weekly Chart:
We've spotted a fascinating rectangular channel, indicating a consolidation phase. A key point here is the price rejection at the lower trendline (around 0.85627). Currently, AUD/CAD sits interestingly at the mid-channel point of 0.90564, a critical area to watch.
📅 Daily Chart:
Things get more interesting here! We see a Cup and Handle pattern (or a Double Rounded Bottom), hinting at a bullish future. This pattern is eyeing a breakout at 0.90567 – a level we should keenly observe.
⏱ 4-Hour Chart:
Our analysis shows an ascending triangle, a typically bullish signal. The price is flirting with the resistance, also at 0.90567, mirroring the daily chart's breakout point.
💡 What This Means:
The alignment of bullish patterns across multiple timeframes can't be ignored. If AUD/CAD breaks above 0.90567, we might see a strong upward move. However, always remember, the market can surprise us!
📈 Trading Strategy:
Considering a long position on a confirmed breakout above 0.90567.
Setting stop-losses wisely, perhaps below the recent low or the weekly lower trendline.
Profit targets? Look towards previous highs or Fibonacci levels.
🚨 Risk Management:
It's crucial in Forex trading. Manage your positions responsibly, and don't overexpose your capital on a single trade.
🌍 Keep an Eye on the Bigger Picture:
Global economic news, especially from Australia and Canada, could sway our pair, so stay updated!
That's it for today, traders! Remember, the markets are dynamic, and so should be our strategies. Trade smart, stay informed, and let's catch the next big wave together! 🌊💼
Happy Trading!
