Bottoms upPretty sure this is going to be weekly bottom, daily bottom possibly as well.
My previous idea showing a possible wick down to this area played out after a bit of a fake out to the upside.
We've been in correction since Feb and this looks to be the final capitulation event. I still think there's going to be a massive blow-off top to come within a few months. People selling today will be racing to get back in within a month or two once ATH is reached, then they'll sell again after the blow-off top with 50%+ drop in a single day.
Bottom

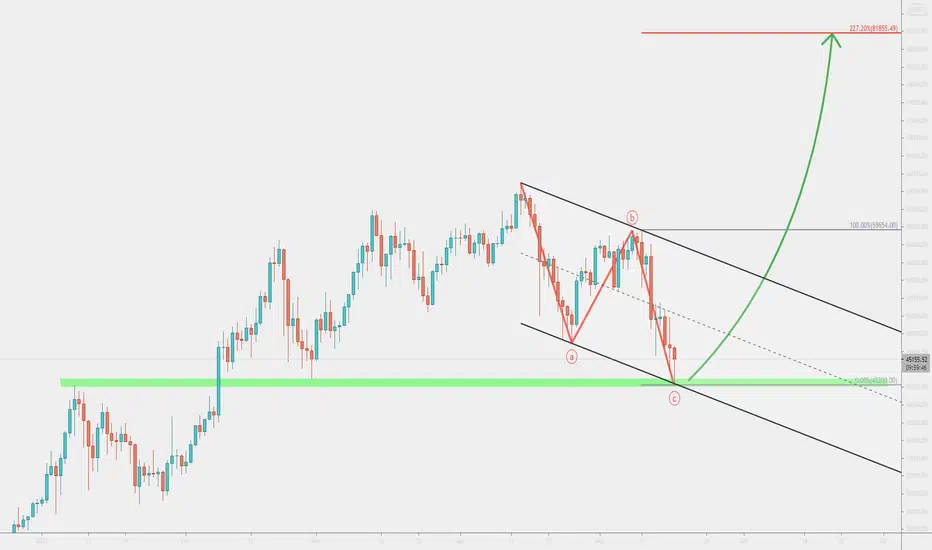
Bitcoin Bottom - here we goPrice action shows that an ABC correction could have come to an end. As long as the current low is being respected, especially if the daily closing price will remain above $42,200, the long-term uptrend continuation will remain highly probable. The Bitcoin should be heading towards 70k, 80k, or even 100k all-time high as the next upside target.

Is here the bottom of next bear market?We can see clearly when bitcoin form red monhly candle in Bull market is most likely here to be the bottom of next bear market.

Possible Bottom on Weekly Chart. I see multiple indicators showing a bottom on the weekly chart.
1. The stock is in a solid uptrend.
2. Last candle is a green doji.
3. The current price is near a clear level of support.
4. The doji bounces off the Lower BB
5. Looking for MACD to start closing in on signal line
6. Looking for RSI STOCH to cross above 20 line.
If this thing turns around, this could be a wonderful opportunity for an Option trade!

Burst 2 Bullish Paths: Bump n'Run Reversal BottomBurst has sucessfully broke the orange trendline (on this one we used the body of the candles).
This has already been tested on lower timeframes, however, as the red path line shows, we might retest it again and see the 0.786 fib hold. It's a great buying area.
However, since Burst has shown so much strenght, got the retrace to 20 sats (0.318 fib, golden pocket), we might just as well go ahead and break the purple trend line (from the wicks). I'd expect to see the price push and then retest the trendline. If you are not in yet, another safe entry would be that retest.
You can check that pattern of bump n'run & reversal bottom has been present on every other altcoin. Burst time is coming.
After that, unleash the bulls!

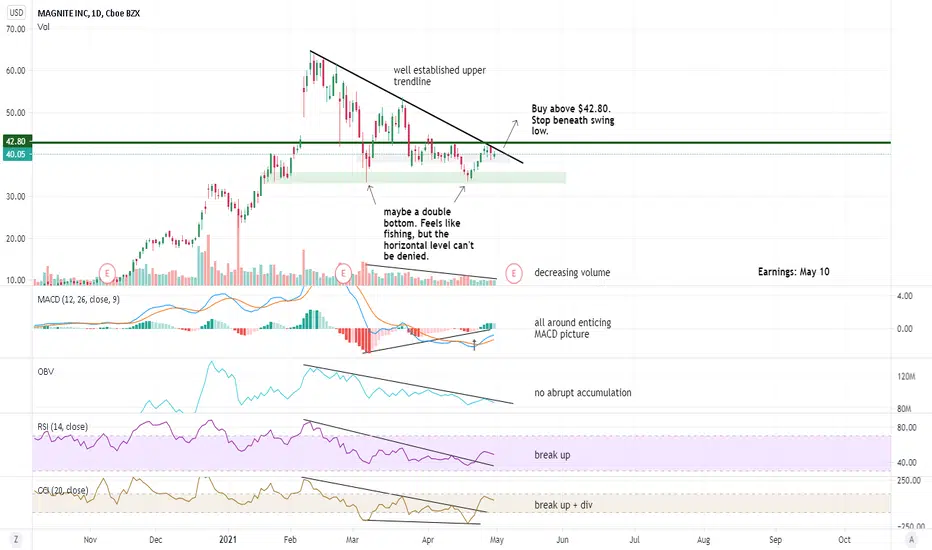
MGNI. Couldn't find any financial setups. Tech will suffice.Looking to the financials for setups now that we are entering the bear months, and fed has announced rates will go up.
None appeared on the scan so I defaulted to tech.
Not interested until it breaks the upper trendline.
I feel like I'm trying to pick bottoms, but I have had some success doing so. Hard to stop when it's working.

NIFTY BANK LONG POSITIONNIFTY BANK IS FORMED AN TRIPLE BOTTOM PATTERN in 1HR Time Frame, and it as Taken Retest to Triple Bottom of Resistance Zone of 32200.
For Long the Entry level: 32603.
Target: 32542.
If any Information is missing in above, Please inform me to correct 🙌.
This Is Only For EDUCATIONAL PURPOSE ONLY...
THANK YOU🥰...

Is This the Bottom for Crypto? BULLS ARE STILL IN CONTROL!🚀Looking at the Total Market cap and BTCUSDT here. There's a lot of confluence showing that next week may be a very bullish reversal for all markets.
TD9 is flashing buy on both BTC and the Total Market Cap. Retracement levels quite interest on both charts with EMA 100 and 50 being our supports respectively. This may indicate more bullishness for the overall market than for btc.
Likewise we can see the total2 marketcap excluding btc, has bounced off the bottom of it's down channel and now has retraced off it's 300 EMA.
Additionally, BTC Dominance, though it tried to reverse on the correction, showed very little actual movement. However it did allow the TD9 to reset completely! Allowing us a full downtrend from here still if we wanted.
This implies a heavy bullish bias towards alts! Which is great for us - as if this seeming support level fails it's like a straight bomb down to the bottom.
Overall, The confluence of these signs of the various chart throughout the market points to this week being extremely bullish, which is deserved after the past week and a half of Bearish downtrend.

LINK short term bottom formingzoomed in on $LINK
The only asset I hold for life and trade for fun.
don't follow this please or really tight SL because it's a tricky market environment atm

Bitcoin likely to bottom around 44k.Hi there,
Here is my analysis on the current bitcoin situation:
The 21week moving average has proven to be a good indicator for finding the bottom in previous bull runs. I think this time will be no exception and we are probably heading for it. The 21week moving average currently lies around 43-44k.
Next to that there is a also rising wedge pattern playing out. The target of this rising wedge can be calculated by measuring the height of the wedge: The 42/44k range.
Finally, by looking at the RSi we can see that its starting to hit the oversold condition, this can also signal that a reversal is near.
Thanks for reading, and if you like this analysis you can give it a thumbs up. Thank you :)
Greetings.

Wyckoff Accumulation also appearing in price action now As shared earlier, the RSI(!) showed a Wyckoff Accumulation pattern.
After recent price action, it seems that also the PA is following along.
Major FA-events occured lately, and a good subscription could force a "buy the rumor, sell the news event", driving prices back down to the huge volume-defined base - holding this area, would strongly increase the theory of the bottom being in, after a semi-long period of accumulation.
Sentiment is slowly turning positive, many are still doubtful, so a surge before the subscription period ends, could cause some Fomo-buys, who will soon after provide liquidity as they panic sell (unknowingly) at a possible Wyckoff Test area after a Spring.
Still very new into Wyckoff, so take all this with a grain of salt.

MFTUSDT BuyHello traders!
MFT is at the bottom of the channel and it has formed descending Broadening wedge pattern and it is ready to give Breakout.
After the breakout, it will touch the high of this channel and I am expecting more than that. Traders can take their profit at the peak of the channel with 100% gains but after the breakout, it will be unstoppable and will shoot to the sky with up to 200% @ 0.06+ target.
Don't forget to hit the like button and follow to stay connected.

$DOGE Triangle PamPHey boiz
After $DOGE got rejected yesterday at 0.0666 as planned, now paints such nice cup there. Maybe for pamp. But take care becaus it might not be the very lowest of risk right here. And do not forget to only do good with some DOGE profits when having some nice tradings.
Good luck #doggonacci

CL > opportunity for large gain over a short time periodOil is showing a classic rectangle bottom. This is a pattern at the end of a down trend. The criteria are. That one of the horizontal lines needs to be touched 3 times and the other 2 times. This fulfills the criteria.
Rectangle bottoms can break out in either direction. Be prepared to take a short or long position on candle close (in this case a 4h candle.)
Rectangle bottoms do even better when the volume goes down as the rectangle moves to the right. This seems to be the case here.
You can also trade this by going short when price touches the upper line and buy when it touches the lower line.
You can see the potential targets and they are substantial. Though I would decrease my position as it approaches the target and pocket some profits along the way.
Please like and follow if this has been helpful.
Ms Bunny

Addition to short term viewBeforementioned shorter term view could also be a part of an even bigger cup / falling wedge breakout

BTC CYCLESAs you can see, there is a pattern of tops and bottoms on BTC if we look on the logarithmic scale with fibonacci settings also on log. If this patterns continues we gonna have the next top on 200.000 area and the next bottom to 60.000 area. We have no reason to believe this pattern is broken so let’s see if and when we go there.


TAAT Buy - Double bottom on a key support level
- RSI and MACD are bullish
- Waiting for a confirmation candle and increase volume

Halo Collective BottomChart painting from the early 21st century, artist Maxi Scalibusa. No investment advice or a recommendation to buy or sell any securities. This is entertainment. Start 0.115 CAD

USDCHF into the ZoneOn USDCHF Daily view, we do not have any possible setup yet. This one is similar to the DXY so we will wait to see what is the future of the US Dollar. Here's a possible scenario, but price can dive inside the support zone for the upcoming week. We can wait until a double bottom can form meaning that the support is rejecting this one.

TEVA BottomChart painting from the early 21st century, artist Maxi Scalibusa. No investment advice or a recommendation to buy or sell any securities. This is entertainment.
Start 10.76 USD
