Bottom of a rocket?Chart painting from the early 21st century, artist Maxi Scalibusa. No investment advice or a recommendation to buy or sell any securities. This is entertainment.
Start 1.17 USD
Bottom

It could be the bottom for the entire marketJumia, 3D Systems, Fubo, Skillz, Virgin Galactic, Plug Power, Nio, Jinko Solar, Xpeng, Li Auto, Momo, Pinterest, Beyond Meat, Peloton, Tesla, Square, etc. Some of them have lost more than 50 percent since the peak of February. It seems they all touched the bottom this morning.
Notice how they move in unison despite belonging to different sectors, the same could happen in the recovery.
NYSE:JMIA
NYSE:DDD
NYSE:FUBO
NYSE:SKLZ
NYSE:SPCE
NASDAQ:PLUG
NYSE:NIO
NYSE:JKS
NYSE:XPEV
NASDAQ:LI
NASDAQ:MOMO
BMV:PINS
NASDAQ:BYND
NASDAQ:PTON
NASDAQ:TSLA
NYSE:SQ

AMC: Be aware of these Key Points for the short/mid-term!Hello traders and investors! Let’s talk about AMC today!
In the 1h chart, we have a support level at $ 7.63 (black line), and a trendline connecting the previous tops, which is working as a resistance. If AMC is about to do anything next, regardless of if it is up or down, it must do a breakout from one of these lines.
The volume has been quite low during the last candlesticks, indicating that the next big movement will occur soon. In moments like this, the 21 ema is totally useless, and it is not a reliable support/resistance level.
Now, let’s see the daily chart for more clues:
We have what could be a huge round bottom in the daily chart, which means that we might see some rally next, up to the pattern’s target, which is around $ 20. AMC is above the 21 ema in the daily chart, which is good. Unlike in the 1h chart, where we have an annoying congestion, here the 21 ema might still work, as AMC is still trending.
But what really caught my attention is the volume . When the stock spikes, the volume increases a lot, but when is drops, it starts to diminish again, showing that the bulls are in control of the situation , and they are really moving AMC.
Either way, if AMC loses the 21 ema and the support level in the 1h chart, the next stop would be the black line at $ 5.22. But if we see any bullish pattern around here, we could see an excuse to buy, and if it breaks the purple trendline, even better.
Remember to follow me to follow me to keep in touch with my daily studies, and if you’ve read this far, you must’ve found this analysis interesting, otherwise you wouldn’t still be here, right? If that’s the case, please support this idea !
Thank you very much!


USOIL going down next days?Is this a reverse coup pattern in your opinion?
We will touch 58,8 again?
Write me your opinion

BTC - I am so bullish it hurtsAt the moment, BTC price is at the exact level where it was in my last post on Saturday: $47.3k and we have experienced another lower low yesterday. So why I have flipped my sentiment overnight?
1. Price action has accurately followed my Blue scenario sofar (I wrote in my post on Feb-24). BTC dipped below $43.7k to f all the stop-losses and bounced back decently, front-running the bids in $40k-42k zone. I have seen a lot of people recently calling $40k-42k as strong support and bidding there. This is a zero-sum game, so if everyone could buy BTC at a good price, that would apparently be not a good price anymore.
2. BTC price touched the Kijun line at $43k. That line acts as good support in the Ichimoku indicator, just as it had in the last correction in Jan-2021. Looking into the 4H chart, we could also see that BTC has retested the 4h 200MA. In a truly BTC bull market, when price touches the 4h 200MA, it fking bounces up.
3. I have seen very strong buying power coming especially from Coinbase since Sunday evening, which has reflected in Coinbase price premium. For those who are new to this space, Coinbase is a prestigious crypto exchange that is institution-oriented. Coinbase provides a good very custody service with relatively high fees, so retails don't like them but institutions do. The fact that there are high BTC price premiums and high BTC outflows on Coinbase indicates the strong buying activities from the institutional investor(s), which is the main driving force that has been pushing the price up in recent months. I would not be surprised if there is news about a big entity (or Microstrategy again) buying BTC coming out in the next couple days.
What I expect next:
Price may retest $48.6k this week, if not today. If the local bottom has been actually in, I want to see BTC ranging for a while, maybe between $49k and $43k, and forming a reaccumulation pattern before moving up again. Meanwhile, I would love to see money rotating into altcoins, especially Ethereum. In case price has not bottomed out and corrects further (possibility is 30% in my opinion), I will prepare for the $30k zone.
In conclusion, I personally think that we have found the local bottom zone and it's time to bid up, homies.
"Those who don't have the balls to buy when it dropped 20% do not deserve when it pumps 200%" (from someone on Twitter)


In the event of a breakdown to the bottom, I will sell (inchalahIn the event of a breakdown to the bottom, I will sell, but if it rises, I will not buy it, because I see Bitcoin will visit low prices (inchalah)

WAS 58K THE TOP (UNTIL NOV 2022)?Measuring historically from Cycle top to Cycle top I noticed 5 weeks added to each cycle making this week the current top until NOV 2022. estimated drop to $21k in the meantime (each dip measured 10% less than the last. 83% dip, 73% dip and now 63% from $58k top). Buy at $21k before the next bull run....

BITCOIN CYCLESPotential top around 200k $
Potential bottom before next cycle around 50k $
DYOR, it's only chart

BTC - price is still struggling to find local bottomThe current bearish vibe is still lingering around the crypto space. BTC is still making another lower low on the daily chart, and a potential bearish engulfing weekly candle is in the making. Although I am not trading solely on candle patterns, the fact that we have a giant red candle on the high time frame chart is kind of worrisome. Because of these, I am still maintaining my conservative strategy and leaning ~60% on the possibility that we have not yet bottomed. That said, this seems to be a reasonable price zone for long-term investors to start scaling in BTC in my humble opinion. As a trader, I am still waiting for a reversal signal before rejoining this market.

Symmetrical Triangle - Today BreakoutIn the next few hours we can see a breakout to the top or bottom. Pay attention!


Bitcoin break through downward trend?To analyse this we look at bitcoin's hourly chart. The price is now close against the falling black trend line. As long as this is not broken, the price will continue to fall. Furthermore, the pink line at $ 51,000 is now a strong resistance.
If we look at the RSI, there is a good chance that bitcoin will break through the falling trend line, because there is a divergence between the RSI and the bitcoin price. This means that the price is falling, but the RSI is rising. We have indicated this on the graph with the black lines. This divergence is often a prediction for a price increase.
Bitcoin has likely bottomed at $ 45,000 -->yellow line.
The black trend line now becomes very interesting to follow. Does bitcoin break through that? Then we can look further up. If not then the price will fall back.
Let me know what you think? Will it break through the black trend line? or not?

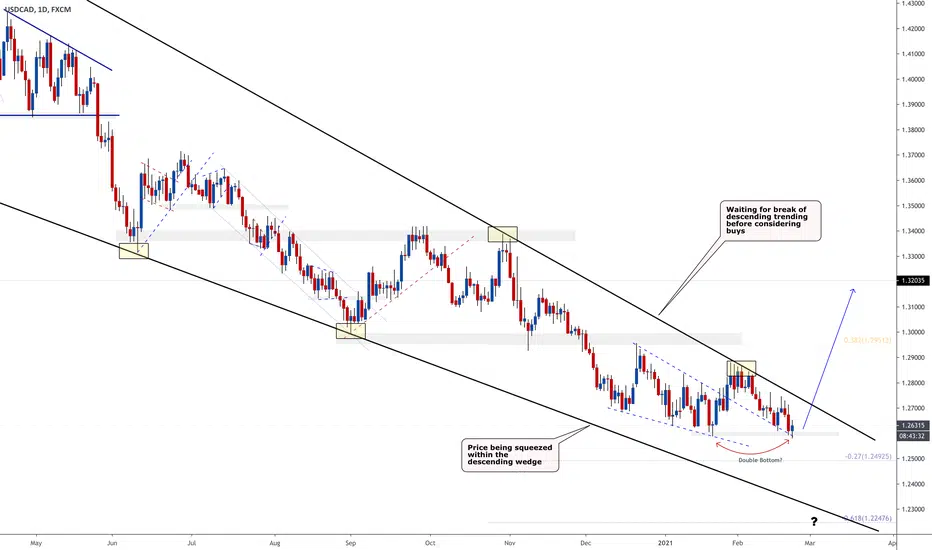
USDCAD - Double BottomUSCAD has been in a descending wedge and is being squeezed. As we're anticipating CAD weakness, could this be the start of a a bullish run for USDCAD?
We could potentially be seeing a double bottom happening now. I would wait for a break of the wedge before considering longs. Until then, I'll be sitting on the sidelines as it would be wise to wait for confirmation than catch the tops and bottoms of a move.
As always, Trade Safe!

CXW Long ideaLong trade setup based on
1. Falling wedge
2. Double bottom
3. High timeframe support
Disclaimer: Im not a financial advisor and this is no financial nor trading advice.

Spx to 3800I believing we have a good set up for a drop to 3820.
We having opening wedge.
We have heads and shoulders which has price now break below
We have strong bear divergence on several indicators.
Rsi also form heads and shoulders on 4h and down below neck line
We have stimulating factor of bad job report for first time in some time.
3820 is strong support and pivots
Let’s see. It is hard to predict being on top or being bottom but I tend to be better at bottom

RECSI BUY signalStrong BUY
Q4 tomorrow friday!
Huge upside potential, limit downside risk in channel.
Fundamentals:
-Info regarding re opening of Moses Lake factory
-Status Butte factory
-status new partnes and status partners already signed with. G14 and VP
-Market update future development

ETH/BTC is bottoming out?We're testing significant 0.5 fib support level, since there is a lot of bullish fundamentals about ETH, I think that ETH will going to pump in mid-short term.

XLM/USDT can reach 4$ in long termHi every one
STELLAR / TETHERUS
XLM/USDT has formed a rounded bottom which means this instrument's projected price movement is upward and as high as the measured price movement !
note that this analysis is for long term
Traders, if you liked this idea or have your opinion on it, write in the comments, We will be glad.
Things can change...
The markets are always changing and even with all these signals, the market changes tend to be strong and fast!!
Thank you for seeing idea .
Have a nice day and Good luck.

Broadening Bottom Chart PatternThe possibility of a fall (50-60%) in the coming days and the opportunity of re-buying.
