Bottom

GameStop - classic bottom with overhype after. 𝙃𝙤𝙬 𝙃𝙚𝙙𝙜𝙚 𝙛𝙪𝙣𝙙 𝙘𝙝𝙚𝙖𝙩𝙚𝙙 𝙥𝙥𝙡 𝙬𝙝𝙞𝙡𝙚 𝙥𝙥𝙡 𝙩𝙝𝙞𝙣𝙠 𝙩𝙝𝙖𝙩 𝙩𝙝𝙚𝙮 𝙘𝙝𝙚𝙖𝙩 𝙝𝙚𝙙𝙜𝙚 𝙛𝙪𝙣𝙙..🤫
𝙒𝙝𝙖𝙩 𝙙𝙞𝙙 𝙬𝙚 𝙠𝙣𝙤𝙬 𝙖𝙗𝙤𝙪𝙩 GME 𝙥𝙪𝙢𝙥? 🤓
-GME YOLO update following the start of the Big Short Squeeze.... hedge fund... high short interest rate ...
It was on 15 Apr 2020. (I place a horizontal line on 01 Apr 2020).
𝙒𝙝𝙖𝙩 𝙙𝙤 𝙬𝙚 𝙨𝙚𝙚 𝙤𝙣 𝙩𝙝𝙚 𝙘𝙝𝙖𝙧𝙩?😎
We see 🚩𝙄𝙉𝙎𝘼𝙉𝙀 𝙃𝙐𝙂𝙀 volume in 3$ - 6$ range. From Jun 2019 to Apr 2020. I see here accumulation or "bottom" after price drop 45$>4$.
I don't see 𝙎𝙃𝙊𝙍𝙏 𝘼𝘾𝘾𝙐𝙈𝙐𝙇𝘼𝙏𝙄𝙊𝙉 on the chart as Reddit guys sad. Nobody SHORT stocks after 90% price drop - it's madness.
📃I see it like this:
1) Smart Money open short on 40$-45$.
2) Smart Money close short on 4$-16$.
3) Smart Money accumulates a Huge LONG position from Jun2019 to Apr2020 - almost 9 months. (buy on bottom).
4) On 15 Apr we have a post on Reddit and the price starts to rise.
5) Pump. Smart Money sell the position to ppl who HODL :)
6) DONE.

BITCOIN Rounding BottomOn 2 hour charts, Bitcoin is building a base (rounding bottom). The Japanese call this a "Fry Pan Bottom". It is a good place to enter a trade as it presages a rally. Thank you for reading.

$KOTouch bottom idk how many times (3) on daily. Thats the bottom. Each retracment so far during covid is avg over 10%. LONG!
few will understand this. counter trade me please.

btc chart 1/28/20 (double bottom)for the first time this whole month we formed a legit double bottom.

Demand Zone + Bullish PinbarFirst touch of demand zone, there has been a good buyer entry. If the price came back to zone, I'm looking at Buy entry at Bottom candle Low price, as the candle is Bullish Pinbar candle. And exit target is based on Fibo Musang (reverse Fibo Retracement), exit at TP2 = level 261.

$CCL Few will understandFEW WILL UNDERSTAND!!!! Watch this play out. Gray boxes are load up zones once broken. And IT HIT BOTTOM!! counter trade me if you think otherwise.

Vaccine raceThe big stories in the new year, though, could come from vaccines that haven't made it to market yet. It's possible that the stocks of the companies developing these experimental vaccines will deliver tremendous gains over the next 12 months. Here are four coronavirus stocks that are especially poised to soar in 2021.
Of course, they are could be very volatile and uncertain because of the licencing. They are in phase 2 or 3.
Innovio(INO) a small-cap company. It maybe has found its bottom and their vaccine has an advantage in that the drug does not need to be frozen, also announced it entered into a collaborative agreement with Chinese company Advaccine Biopharmaceuticals Suzhou. Their vaccine(INO-4800) could be brought to market within Greater China. Inovio's stock could become a great buy if INO-4800 is successful and the Food and Drug Administration (FDA) approves the vaccine. But the problem is that's not a guarantee.
Altimmun(ALT) a small-cap company. Altimmun could regain the high of summer and something getting started. Their vaccine only requires a single dose. It can be stored at room temperature for extended periods.
Vaxart(VXRT) is a small-cap company. Found its bottom in a sideways consolidation and now something makes investor interested by the last day momentum. Their vaccine could be really cool because It's a single-dose tablet instead of an injection. That makes Vaxart's vaccine more convenient to take and to distribute and store.
Novavax(Nvax) is a mid-cap company. Novavax has a COVID-19/flu combo vaccine. It makes me interested in and I like the sideways consolidation last month or more. Now I waiting for an upward break and it could reach a high of 200 or more.
These forecasts were created to support you, but you have to make your trading decisions independently! Which one could be the winner or loser? Who knows? As nobody sees the future, I recommend you that always apply risk management during your trading and highly recommend the diversification!

Buy Signal + Bullish EngulfingI have an indicator that give buy signal at the candle I mark with VLine. At nearest support is Bullish Engulfing zone. I consider try to entry buy at 2 level, first at start of demand zone, and second at bottom shadow of bull.

$PRO TSXV Pershimex Resources CorpPerfect rounded bottom and cup in the making.
100% + gains to be made

H1 Support Zone, Tested 1xLast support M15 that I share, buyer rejection about 100 pt +/-, and currently breaking it. Based on H1, I prefer this zone as this zone has buyer re entry 1x. Looking for more strong buyer here than my analysis before. I prefer to entry bottom candle bottom shadow.

Using WEEKLY EMA 20 to find the BOTTOMHistorically the weekly EMA 20 has proven itself to be a good place to buy bitcoin in bullruns. Will the WEEKLY EMA 20 serve us again in revealing the bottom?
Find out in the next episode of Bitcoin to the moon.
(Note: W EMA 20 will be around a price point of 20-25k)


USDJPY With Several Evidences For A Potential Bottom FormationHello traders!
Today we will talk about weekly USDJPY chart and we will show you many evidences for a potential bottom formation.
Well, for the begining let's talk about wave structures from Elliott Wave perspective. USDJPY is in a downtrend since March, but the wave structure is slow, choppy and overlapped which we see it as a complex corrective W-X-Y decline and we know that once corrections fully unfolds, we can expect a reversal.
The next very important evidence is an ending diagonal (wedge) pattern placed in third leg Y. The ending diagonal is a special type of wave that occurs in wave 5 of an impulse, or wave C/Y of a correction. This wave often occurs when the preceding move of the trend has gone too far, too fast and has run out of steam. An ending diagonal pattern is a type of pattern that can occur at the completion of a strong move. It reflects a “calming” of the market sentiment such that price still moves generally in the direction of the larger move, but not strongly enough to produce an impulsive wave. Ending diagonals consist of five waves, labeled 1-2-3-4-5, where each wave subdivides into three legs. Waves 1 and 4 overlap in price, while wave 3 can not be the shortest amongst waves 1, 3 and 5.
The reason why they are so interesting is because they are indicating a reversal, usually a strong one.
The next interesting evidence is that we are already seeing bounce and recovery with quite big weekly candlestick, completely covered the previous one, called bullish engulfing candlestick formation which also suggests a bullish reversal from the lows.
If we also consider current break above strong weekly trendline, then with so many evidences, we can easily confirm a potential bottom and bullish reversal.
Trade well!
If you like what we do, then please like and share the idea!
Disclosure: Please be informed that information we provide is NOT a trading recommendation or investment advice. All of our work is for educational purposes only.

Have we seen the bottom?There was a substantial upward trend between 1942 and 1981 in the 10 years Us treasury notes. After that, a declining has been ongoing for 39 years. This cycle is getting to its end, and I can imagine that we had already seen the bottom of it in 2020, I think this despite the fact that the falling trend has not yet broken.
Ok I know, now I am visioning a change of regime or a change of paradigm, but today's circumstance could create such a change.
So I don't know if there will be moderate inflation or hyperinflation or something like that, but the 10year Us treasury notes should break out of this falling channel and after that, even the rising could accelerate.
What should traders do if they would like to protect themself from inflation? For me short the bond market!
Now I start to see the market very closely and searching for a good us bond market short ETF and getting involved in this market step by step.
I don't know whether I am right, maybe just 2 or 3 years will come to this change(especially because the FED announced that they won't change this rate policy until 2023). But be aware that because if the time will come and you are not prepared then your money will be burned.
I have just thought that I will share my vision of the next extremely adventurous years, and I am very curious about your vision and your solution
Thank you for your attention!

AUDCAD BULLISH IDEA 4hr chartHello friends,
The price zone around 0.9771 in AUDCAD is acting as a strong support which is evident by the triple bottom seen on the price chart.
Hopefully it will resume its bullish trend after this correction at 4 hour chart.
Buy : 0.9793
SL : 0.9771
TP : 0.9991
R : R = 1: 10

GBP CHF (sell & Buy)Curve forming. This curve so far has an upward and downward curve. I am looking for double tops and double bottom before a trade is placed.

Reversal inbound for XEMBTC?It seems to me that XEM has hit a bottom in the BTC pair.
I think it’s time for a reversal in the daily frame.
Good luck.

Juicy Profits coming for XZC Today I went back looking at XZC chart after following this for a while.
This is now looking very promising as we revisited ATL where we saw a convincing buy pressure.
Here are a few points for going long IMO:
PSAR flip is now giving a BUY signal
Promising PA when we get to the lower support levels
Higher Lows in RSI
Finally getting ready for a further retest of the descending white trend line, drew from August's high
BTC Dominance pointing down if rejected from current levels
More cautious traders might want to wait for price to be back above EMAs (not shown here for the sake of simplicity)
> I believe there are nice chances to see the 618fib tested in the coming weeks.
> If those level are tested, then we are jumping back on the green ascending channel, and the party is gonna become even crazier.
Feedback always welcome,
best from Nips
Not financial advice!

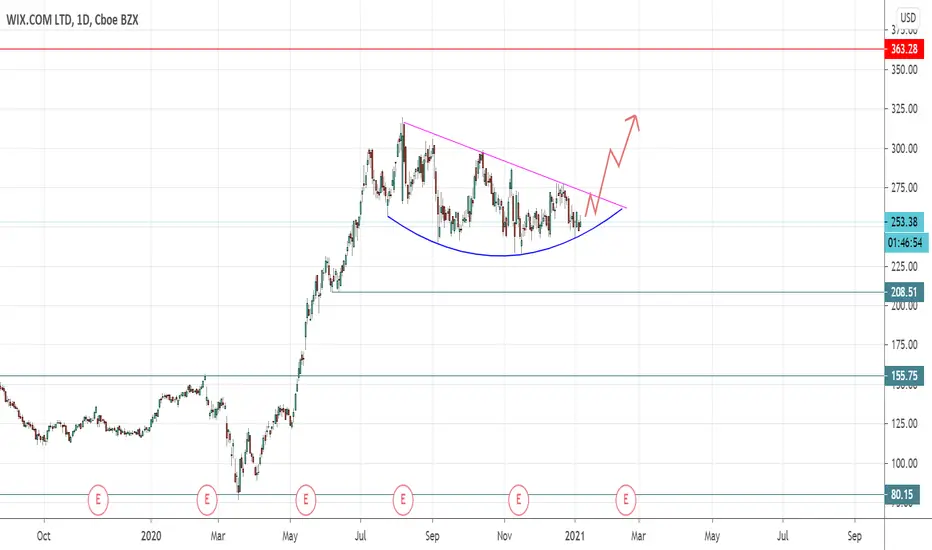
Wix - Great SetupI like the way this one is setting up. Rounded bottom.
Could go a lot higher over the next year.
Thank you
Danone, Quick Trade or Long-term Buy. Both work here.EURONEXT:BN is showing signs that it has already bottomed out and on its way up. We have a relatively safe trade here.
RSI divergence suggests a reversal of trend. It suggests that the low of 29 October 2020 at €46 is the lowest Danone will reach in the short- to mid-term (few months).
An ascending triangle is showing upward momentum. This suggests a target of €60.
At €60, we see strong resistance that has contributed to major reversals in the past. So that's a line to watch. I suspect a reversal at this line back to the top of the triangle.
Just above the €60 line is the 50% Fibonacci level from the recent swing. Crossing this 50% Fib indicates a stronger probability of returning to the swing's top rather than its bottom.
If the resistance at €60 is crossed, then it's a very encouraging sign of the bullish momentum and we set our next target at the resistance above at €65.
The trade should go like this:
You should go long as soon as the triangle breaks upwards, and set a stop loss at either €51.50 or €50.50 depending on your risk appetite.
If the first target of €60 is reached, then we raise our stop loss to the top of the triangle or slightly below it, perhaps at €53.50
Once we cross the resistance at €60 by a full daily green candle above it, we raise our stop loss to that level.
Cheers.

Call Me Crazy, But I'm Buying HereHash rates may be bottoming here.
Obviously Craig Wrights court case is something to speculate on, but the case has been pushed out until mid this year ~June unless it is once again pushed out.
If evidence doesn't show that Craig is irrefutably Satoshi (Which is most likely the case) obviously that is bearish news.
However slight this chance may be, that he is Satoshi, i am willing to take that risk.
None the less if we stay in this channel the only direction is up from here.
Good Luck And Safe Trading.

Bottom in, Where are the sellers ???So as we can see the chart is rising with almost no volume. Seems like there are only few sellers.
looks like the bottom was in around the 2$ mark. So lets see whats going on here but this looks like there is a LOT of Potential in this stock.
Risk reward Ration sucks atm short term, but long term i think there is a lot of room to grow with a Market Cap of around 50M$ only...
Ciao ciao
