Distribution & Follow-Through DaysInvestor Business Daily model follows the model of distribution and follow-through days based on volume as follows:
Distribution days:
A distribution day is defined as a day in which the move by the index is moves -0.5% on stronger volume than the previous day.
Follow-Through days:
On Day 4 or later of the attempted rally, at least one of the key market indexes must deliver a strong gain in volume up from the previous day. That big gain in rising volume is the follow-through day, which confirms that a new uptrend is underway.
A follow-through day can't pick the exact day that a market bottoms, but it can get you in close to the bottom.
Because this model is intended to value the market health, and how market-makers are positioning themselves, this cluster historically signifies a more defensive market.
Bottom

[$BAL] Balancer will outperform ETH in the Cloud ?Support maybe reclaim !
If entering the H4 Kumo , we can see some volatility here !
Trade Safe , Stay Safe
PEACE!

BCHBTC is trying to have a breakout 🦐BCHBTC is trying to have a breakout from the descending channel after the price created a double bottom.
According to Plancton's strategy, we can set a nice order
–––––
Follow the Shrimp 🦐
Keep in mind.
🟣 Purple structure -> Monthly structure.
🔴 Red structure -> Weekly structure.
🔵 Blue structure -> Daily structure.
🟡 Yellow structure -> 4h structure.
⚫️ Black structure -> >4h structure.
Here is the Plancton0618 technical analysis, please comment below if you have any question.
The ENTRY in the market will be taken only if the condition of Plancton0618 strategy will trigger.

Walmart (WMT) rounding out bottom on 65 min time frameLook to buy near the low range of the rounding formation that I drew. Also, there is horizontal support at $135 and horizontal resistance near $139. If it breaks out, it can make new highs again.

BYND BUY OR LONG , TARRGET UP TO $220BYND wants to confirm a "Round Bottom" chart pattern, which is very rare if the price hits $171.5 I will open buy.
BYND buy : $171.5
BYND target : $220
Stop loss : 6%
Wish you a good deal!

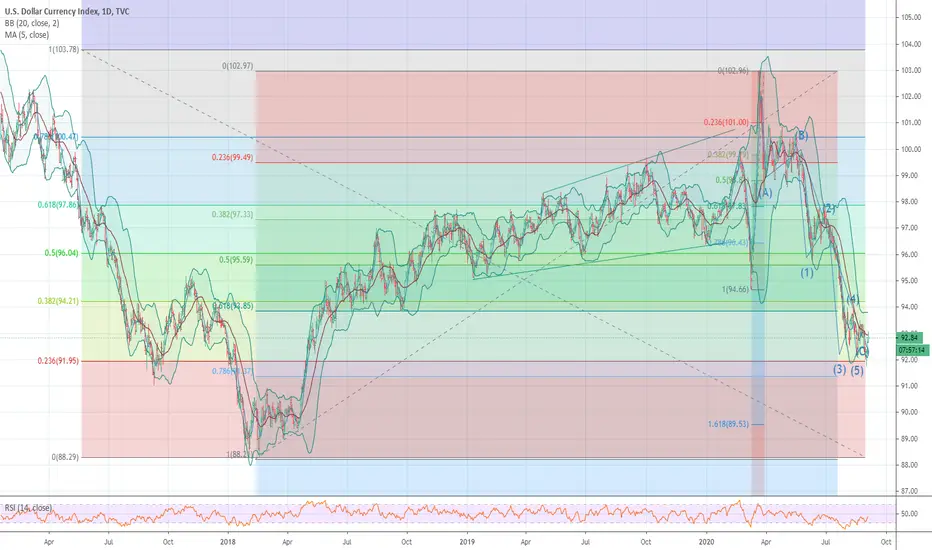
Impressive reversal pattern on the daily with the dollar.Inverted H&S
Break Even Failure Rate 11%
Average Rise: 45%
Throwback Rate 65%
Percentage of Price meeting price target 71%
Trend: Downward leading to pattern
Price: Must have something to reverse, so if the decline leading to the pattern is small, expect a small rise.
Volume: Highest on left shoulder or head
“A short-term drop (0-3 months) leading to the pattern results in the best postbreakout performance. “
"A higher left shoulder valley when compared to the right shoulder valley results in worse post breakout performance." - so one could assume the inverse is true? a lower left would result in Better breakout performance??
Breaking right to R3, and not passing on first go is not unusual.
With a potential bottoming pattern - right now I'd say the trend for the dollar is to hard to call frankly any trade on.
I'm leaning bullish on the dollar, which sounds insane, and does not bode well for commodities - but this pattern on the daily is indicative of a reversal in the dollar. The dollar folks may be getting higher here despite "brrr". Keep in mind how poor the velocity of M2 supply is right now. And keep in mind the Fed giving guidance that rates will be low for years is hinged to their confidence that essentially inflation is really not coming, certainly not hyper inflation or anything high. Very interesting to see if the dollar has found a bottom here. Not advising any trade right now.

ZTS Broadening Bottom (bullish)I found this pattern at tickeron website with the following data:
STATUS = Confirmed
CURRENT CONFIDENCE = 66%
TARGET (EXIT) PRICE = 166.29 USD
BREAKOUT (ENTRY) PRICE = 162.17 USD
DISTANCE TO TARGET PRICE = 2.83%
EMERGED ON = Sep 24, 12:00 PM (EDT)
CONFIRMED ON = Sep 28, 09:30 AM (EDT)
WITH CONFIDENCE LEVEL = 74%
A broadening bottom can be characterized as a bullish reversal pattern. It consists of two divergent lines that form a triangle. The movements between the two triangle sides increase as the pattern continues. Each side must be touched at least twice to be validated.
The Broadening Bottom pattern is formed when the price of a security progressively makes higher highs (2, 4) and lower lows (1, 3, 5) following two widening trend lines. The price is expected to move up or down past the pattern depending on which line is broken first. What distinguishes a Broadening Bottom from a Broadening Top is that the price of the security is declining prior to entering the pattern formation.
Once the price breaks out from the top pattern boundary, day traders and swing traders should trade with an UP trend. Consider buying a security or a call option at the upward breakout price/entry point. To identify an exit, compute the target price by adding the pattern height (H on the chart) to the breakout price. The pattern height is the difference between the pattern’s highest high and its lowest low.
To limit potential loss when the price suddenly goes in the wrong direction, consider placing a stop order to sell at or below the breakout price.
This type of formation happens when volatility is high or increasing, and when the price of a security is moving with high volatility but with little or no direction. It can potentially indicate growing investor nervousness and indecisiveness.

XAUUSDLooking at this W formation I believe the market will reach this particular TP and during that zone continue to the downside.
Link to related idea:


EURCAD Long Set UPEURCAD forming a rounded bottom, setting up for continuation to the upside. Longer time frames show a cup and a candle trade
Share thoughts in the comments
Like and follow for more content
Good Luck

STMXUSDT creates two rounded bottom 🦐STMXUSDT creates two rounded bottoms and the price wants to test a daily resistance.
IF the price will break the daily resistance According to Plancton's strategy, we can set a nice order
–––––
Follow the Shrimp 🦐
Keep in mind.
🟣 Purple structure -> Monthly structure.
🔴 Red structure -> Weekly structure.
🔵 Blue structure -> Daily structure.
🟡 Yellow structure -> 4h structure.
Here is the Plancton0618 technical analysis, please comment below if you have any question.
The ENTRY in the market will be taken only if the condition of Plancton0618 strategy will trigger.

VETUSD - very BULLISH long off possible corrective bounceSince my last trade idea became invalidated on VET due to a longer corrective wave than expected we finally touched major resistance off 0.01 resistance and bounced. Also bounced from double bottom neckline.
VET is showing strong signs of staying alive and keep in mind VET has risen almost 600% (look at my first call on VET) and we are still ABOVE yearly CAM S4.
Keep an eye on 0.015 levels, we could have one more shakeout and a re-test to 0.01. I'll post another idea if price hits 0.019 to see if our past target of 0.044 is still possible.
Short term TP levels are 0.0155 - 0.0.19.
Remember trade what you see and not what you think. Always look at price action and if you don't feel comfortable get out.
NOT a financial advisor, trade at your own risk.

TCTBTC is creating rounded support 🦐After a huge Bullrun, TCTBTC is creating rounded support on 4h chart.
Now the price is testing the first 4h resistance, According to Plancton's strategy, we can set a nice order
–––––
Follow the Shrimp 🦐
Keep in mind.
🟣 Purple structure -> Monthly structure.
🔴 Red structure -> Weekly structure.
🔵 Blue structure -> Daily structure.
🟡 Yellow structure -> 4h structure.
Here is the Plancton0618 technical analysis, please comment below if you have any question.
The ENTRY in the market will be taken only if the condition of Plancton0618 strategy will trigger.

LINKUSD - looking very BULLISH with possible bottom in placeDuring the past months LINK experienced something called a blue sky breakout. The drop from last month was expected as traders need to create new supports/resistances to trade out of (look at TESLA for example). As seen from the chart, it is showing very strong signs of recovery and a bottom from monthly trend-line.
Watch price action at current levels, if it breaks, we may experience another shake out. Keep an eye on 15$ (if it reaches it) to a possible rise back to 20$.
TP levels 15-20$
Remember trade what you see and not what you think, being emotionally invested in anything is not a good idea.
Not a financial advisor, trade at your own risk.

SPX potential double bottomThere is finally some buying volume coming through, but too early to call anything. It is technically a lower high, but reached the wicks of the previous low and rebounded with good volume.
Definitely wait for confirmation before going long because it is also going through a Bollinger Squeeze and has bounced off the MAs.

Bitcoin Bottom is in?This COULD be the bottom IF:
1) We see bullish volume coming into the market
2) We hold the lower yellow dotted line
3) We make a higher-high as indicated on the chart
If we fall below the dotted line, my first target is the 1.618 FIB Extension
and the RED box area. This area would be our last line of support before
taking a very serious dive down into the 8000's.

Did we Find a new Bottom on the XRP daily charts???After sitting on the same support line for 5 days after the large price drop XRP seems to be now breaking out to the upside. I wonder if we have found a new local bottom or if we are just getting a reprieve before a bigger dump? Your thoughts???

For Funsies LTCEh why not nothing to prove so a little wyckoff prediction Could it really hit into single digits? meehhhh Long then short than long then short THAN LOOONNGGG lol

US DOLLAR MAJOR BOTTOM MOVE TO A 90 % NET LONG US $ MARKET A decline has been ended in the correction of the us $ a major low is in place moving to a net long us $ and all us and world stock market nearing the protection target of 3618 and cycle peak was due aug 25 /9187 high to sept 10 focus on sept 4 1929 high three spirals in time and two wd gann date move to a net 100 cash look for a last rally or and abc rally to fall short on most index

elrond h&serd has had a decent pull back since it hit all time highs and now it looks to forming an inverse head and shoulders we should have a breakout @ 0.00000167 if you miss the breakout chances are we will re-test the breakout point then start the climb higher

A rounded formation TOTAL2Rounded formation
These can turn very bullish once completed
Short term it looks bearish, however this is good in the long run.
Giant Bullflag
Strange times

Maybe the price is at the bottomMy idea:
we can clearly see that bottoms are in the red rectangle. currently the price is in the red rectangle. That's why I think the price is at the bottom.
