Reliance made new Higer LowReliance made new Higher Low, could this be reversal towards New Higher highs ?
Bottom

EUR/CHF: Sideway Movement We Need Break To Decide Our DirectionThis is an educational + analytic content that will teach why and how to enter a trade
Make sure you watch the price action closely in each analysis as this is a very important part of our method
Disclaimer : this analysis can change at anytime without notice and it is only for the purpose of assisting traders to make independent investments decisions

AMPLBTC. Is the bottom in? Falling Wedge..AMPLBTC1H. Developed a falling wedge to what may be the bottom? Difficult to really determine as it's a new coin. I've added a bit to my portfolio here.

DPharma - Formation of Cup & Handle PatternThis is DPharma H1 Timeframe Chart, the price is supported by the 50EMA.
It created a "Rounded Bottom" or "Cup & Handle" Pattern
It is a bullish continous pattern, If breakout, It may shoot up to 3.90 level.
Today it creat a Flagpole Pattern in the end of the trading day.

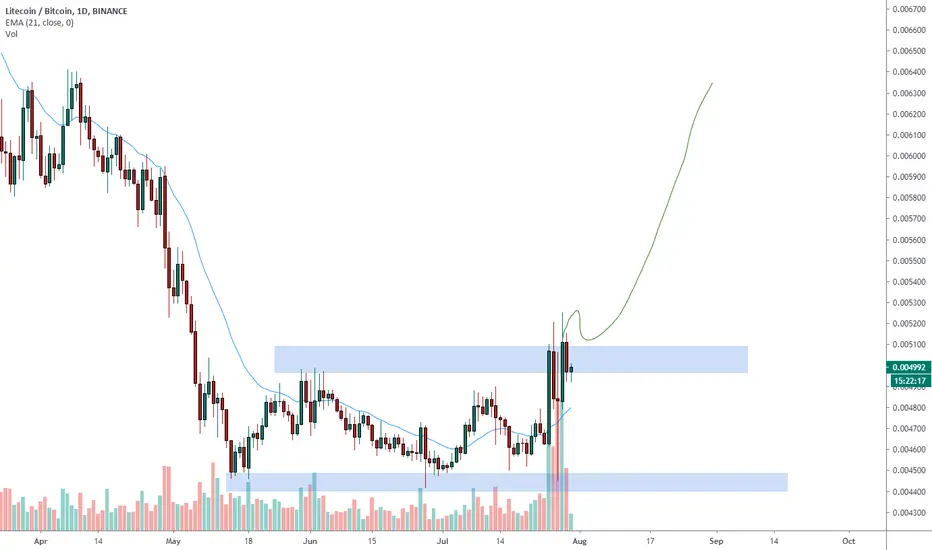
LTCBTC attempting the break 🦐LTCBTC has found a bottom over the daily structure.
Market has attempt twice to break above the range but so far has been rejected.
IF the market will mange to break and close over the structure we can set a nice long order according with our strategy.
Follow the Shrimp 🦐
Here is the Plancton0618 technical analysis , please comment below if you have any question.
The ENTRY in the market will be taken only if the condition of Plancton0618 strategy will trigger.
A Rounding bottom comingAfter 12 months we can now draw a Rounding bottom pattern and, in all likelihood, we can expect it to be close to completion.
Rounding bottoms are found at the end of extended downward trends and signify a reversal in long-term price movements.
So to follow this turnaround pattern could be a good trade.
Best of Luck.

DXY ready for a buy?TF: 12 Hr
DXY looks pretty overold and likely needs a correction. Bullish divergence can be seen developing on the 12 hr for the RSI and slightly on the MACD. Price is also near another significant low which may produce a double bottom, which would be another bullish reversal confirmation.
Let me know what your idea is for DXY below.
See my previous DXY analysis here:

Well known triangle structure by now but you forget halvenings!(dates moved around abit but its within the same week)
This halvening breakout was the bottom each time!
2012 halvening structure
2016 halvening structure
2020 halvening structure
May25 chart


GBPSEK Long / Buy - Double BottomReasons I took this trade:
- Double bottom formed on the larger timeframe / Bounce of strong resistance.
- Pair is oversold on many timeframes.
- Tight stop loss / Good R:R (Risk:Reward Ratio)
- Strong BULLISH candle on 1h timeframe ( Piercing Line Pattern & Possible Bullish Hammer )
- MACD crossover
Entry : 11.44453 (roughly)
Stop Loss: 11.39150
TP1: 11.54250
TP2: 11.65475
Please check against your own analysis BEFORE taking this trade and make sure you are happy to enter.
Open to any critique or advice :)

ICADE - DAILY - Potential Long OpportunityWe can see a triple bottom on this real estate company and developer. Potential buy opportunity once the descending trend started 04/06 is violated. The company was growing and showing solid fundamentals in pre-covid period, earnings release next week.
Always keep in mind it is a game of probabilities.

Bitcoin Long Term Analysis- " No chance to buy back in " not a good mindset when trading.
- My goal is to find the next Bitcoin bottom. Disclosure, I currently have no position in BTC.
- In the long run, the halving will kick in 2021. Look at halving charts.
- First wave of alt season happened. This short term down trend will bring a lot of weekly pump and dumps.
- This is the time to find bottoms and get into juicy positions.
This chart is not the best. Take it with a grain of salt.

When will the scallop/rounded bottom end? XRPXRP Idea
I feel the demand for XRP is high even though price action is low
just my opinion though
Included some key levels

👀 ETH at a Critical Point 🤞Hey guys,
Just a quick one with Ethereum today - it's been trending in an upward channel for some time now, 4 months or so, hitting the high (resistance) line and deflecting to the low (support) line, and back again!
It's currently sat rock bottom on the "Support" line - a great time to open a Long trade, right? Maybe, maybe not. No one could blame you for wanting to go Long here, the odds seem to in your favour; but after a big pump of around 4 months of sustained growth it might just break that support, and if support is broken, down she falls!
We could be looking at lows back at $186 if a break down out of the channel occurs, THIS would represent a cracking time to enter a Long position! Or, (we think more likely) the price will continue within the current channel, possibly not hitting the high end as that would be breaking all kinds of previous resistance!
We're currently going for a Long up to $270-$280 (you watch the price plummet now! :) ), followed a decline in price, to where is still up for speculation!
Most importantly, you should be enjoying your trading, if you're not, you are doing it wrong!
All the best,
theCrypster

Double bottom | CADJPYAfter the successful trade on May 25, today we have new potential at CADJPY.
The price forms a double bottom with a potential of 80.41
If you are not familiar with this formation:
A double bottom pattern is a technical analysis charting pattern that describes a change in trend and a momentum reversal from prior leading price action.
It describes the drop of a stock or index, a rebound, another drop to the same or similar level as the original drop, and finally another rebound.
What Does a Double Bottom Tell You?
The double bottom pattern always follows a major or minor down trend in a particular security, and signals the reversal and the beginning of a potential uptrend.
Consequently, the pattern should be validated by market fundamentals for the security itself, as well as the sector that the security belongs to, and the market in general.
The fundamentals should reflect the characteristics of an upcoming reversal in market conditions. Also, volume should be closely monitored during the formation of the pattern.
A spike in volume typically occurs during the two upward price movements in the pattern. These spikes in volume are a strong indication of upward price pressure and serve as further confirmation of a successful double bottom pattern.
Common mistakes
1.Do not looking for the pattern within an up trend!
2.When the bottoms are equal or second is lower than the first one - this is not a double bottom.
3.Don't be greedy and do not rush, always wait for confirmation.

XRP. Long for pivot and H3. Monthly camarillaIt is good to go are far as I am concerned. Target Pivot and monthly H3

Dont buy dash now, wait its 400 buks?hello Traders,
this is a monthly analise, 2 patterns spotted, diamond bottom & ABCD with TPs arround 200 and 400 buks. Time frame 9-12 and 12-16 month away.
Pre-US election pump tp arround 96-106 buks.
not financial advise, trade safe

PRTY - Potential Bottom Swing PlayParty City is in no way sheltered from the current state of things. Most stores are probably shut down, but with all the increased buying I believe we have hit a bottom and can break up to an upper channel off its most recent move.
I do not have any shares of PRTY but will be looking on monday to buy in the area of 0.58-0.61 if I get the chance. First price target is 1.18 and depending on how strong the move is, I may ride some up to 1.66.
This is only a swing idea, I am not necessarily bullish on PRTY, but I do believe in the swing potential setup here.

Ucrest DailyI-Medic is one of the products from United Crest healthcare:
I-Medic bridges the physical gap between your Doctor and you, allowing you to receive personal care from your doctor no matter where you are.......With the Coronavirus incident, it is important to realize the important of health and the speed of detect symptoms is crucial to get cure as soon as possible, and for the future, almost every one need online healthcare service in order to keep tracking the body condition, the services from UCREST expecting to be benefit from it.

#NCC - good one for #retirement planning this has to be one the BEST stock I have charted today, monthly levels at extreme support, you got so little to lose here & plenty to gain, allocate small chunk & forget for few months years to come!!


USDCAD LONGDouble bottom and a bullish gartley pattern (M), but beware the tendency is downwards since we are moving inside a descending triangle
