LIVIDITIUM [BTC] {PREMIUM}Optimised dynamic fib channels for BTC on the 1D chart.
Major "BUY!" signal triggered.
SCRIPT URL:
Bottom

$VIX leaving logarithmic channelThe volatility index, which was recently at 2008's levels. Is starting to go lower, as the S&P is trying to make a bottom.
We are also trying to move out of a logarithmic moving channel (400%+ in less than a month).
The 10 Simple-Moving-Average, is becoming increasingly important; as we are testing it as support and resistance, for the $VIX and the $SPX respectively.
For more information on the $VIX, click on the related ideas.

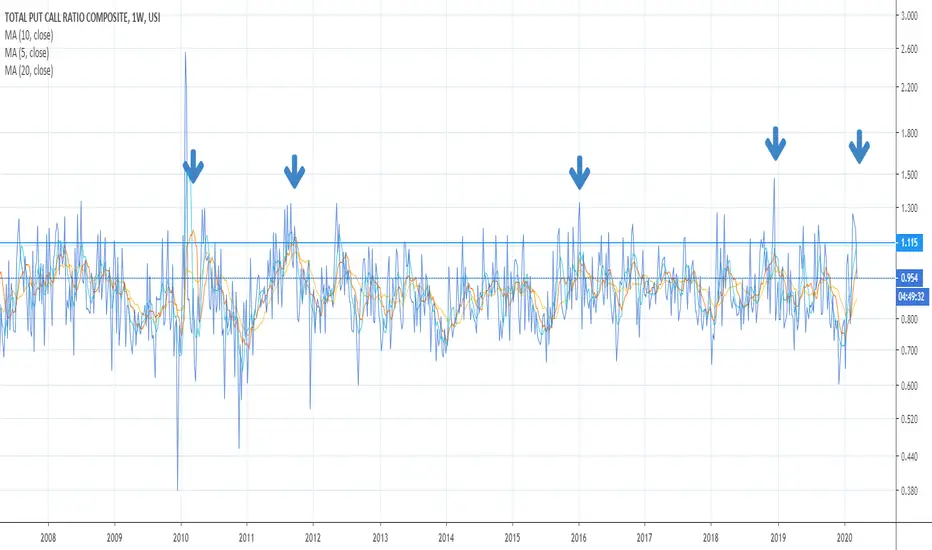
5 10 20 WK P/C NEARING A LONG TERM BUY The chart posted is one of my best tools we are close to the I.T. and LONG TERM BUY


TSLA to stop dumping at 200s? this is my target lets seeI wanted to post this sooner but i forgot about this. But looks like tsla will come back to the trend start just like BTC did back in 2018.
Good luck trading everyone


LUN/BTC Sits on 9 Month Low. Great Buy OppurtunityHi my friends. BINANCE:LUNBTC sits on its 9 Month low price ( Strong Support Level ) it seems a good buy opportunity.
be careful it is not a trade signal.
buy between 0.0000820 - 0.0000880
tp1: 0.0000978
tp2: 0.0001028
tp3: 0.0001124
tp4: 0.0001259
tp5: 0.0001362
tp6: 0.0001462
stoploss : 0.0000790
Inshallah we will reach all targets in 30 - 60 days.
Push like button.

XBC , Ready to bounce?Trend line well respected for over a year. Even considering the volatility of the recent week, it closed on the trend line. Keep in mind company got a 9$ price target a couple of weeks ago because the management is executing very well

BTC now at 200 weekly SMA support.I am cautiously accumulating back in (via cost averaging) again now with stop loss set and constantly updated now.

Total Cryptocurrency Cap (Bitcoin next Try) April - JulySome numerical matches on a chart with different sources
Orange fractal copyed and increased from april `19 (left square)

BITCOIN - WHAT YOU NEED TO KNOWHey there,
Thank you for supporting this idea with likes and make sure you follow me here on TV.
so I think everyone in this space saw what happend yesterday. The biggest percentage and point drop in Bitcoin in all of its history.
A rounded 40%decline in 1 day. An incredible number for any trader.
There are now some key questions to be asked:
What really valuable asset is able to drop 40% in one day?
What could have caused this spike and will it happen again?
Is this the end of Bitcoin?
To all of these questions, I sadly cannot anwser. You have to decide for yourself wether or not you still see value in Bitcoin.
It is very significant that Bitcoin broke the bottom growth of curve of the data science models and has not yet managed to come
back up to those.
While I do think that this is the final capitulation some people like Tone Vays have been waiting for and that the bottom is now in,
I too am troubled and have doubts in the real value of Bitcoin, if it is able to be manipulated by this degree.
Of course no fundementals have changed and Bitcoin is still the same as yesterday and the day befor, I do have doubts, wether
or not people will accept it as a store of value, if even after 10 years of existence, Bitcoin just now had its sharpest and steepest decline in 1 day.
So there you go. Technicals are not really applying here imo, since this is beyond any comprehensible movement.
Now is the time to BUY THE DIP. Even if I have doubts now, I have learned that it often is best to buy BTC when everyone is doubtful.
Oh and btw, there is now a 3DAY 9 buy of the TI Indicator Sequential, so this could be your time to buy.
Cheers,
Konrad

Start of new bull cycle for Bitcoin?Yesterday's crash strengthens the great similarities between current and previous Bitcoin cycle. A sharp sell off made an end to the bear market with only upside seen from thereon. Besides these similarities, looking at the weekly BLX chart (Chart has yet to be updated as of today) with the 200 MA shows a bounce from this moving average, even more so indicating a potential long term bottom.

Silver is Real Money not BTC be smartSilver may not be part of our currency, but it is still money. In fact, silver, along with gold, is the ultimate form of money, because it can’t be created out of thin air (and thus depreciated) like paper or digital forms. And by real money, we do mean physical silver—not ETFs or certificates or futures contracts. Those are paper investments, which don’t carry the same benefits as silver or gold.
Physical silver is a store of value, just like gold. Here’s why.
Silver has…
• No counterparty risk. If you hold physical silver, you don’t need another party to make good on a contract or promise. This is not the case with stocks or bonds or virtually cryptocurrency any other investment.
• Never been defaulted on. If you own physical silver, you have no default risk. Not so for almost any other investment you make.
• Long-term use as money. A scan of monetary history shows that silver has been used in coinage more often than gold!
Physical Silver is a Hard Asset
Of all the investments you own, how many can you hold in your hand?
In a world of paper profits, digital trading, and currency creation, physical silver stands in contrast as one of few assets that you can carry in your pocket anywhere you go, even another country. And it can be as private and confidential as you want. Physical silver is also a tangible hedge against all forms of hacking and cybercrime. There’s no “erasing” a silver Eagle coin, for example, but that can certainly happen to a digital asset
Silver is Cheap and will have a parabolic rise years to follow...crypto will be gone by then...meanwhile silver and gold will be alternative for smart investors than will get early in.
What if I said you could buy a hard asset at 1/70th the price of gold—and it would protect you just as well against crisis?

Bottomless or reached bottom?Hello there beautiful person!
How are you all feeling after a red week in stock and crypto market, with still even more red day today?
Are you looking for buy-in, or selling to cash out?
On my part, I did not expect this heavy drop in crypto this fast. I expected a drop, as I do with gold price before it goes up, but not this fast and so hard though.
BTC/Euro is at a very interesting point right now at 5044, and it crossed a very large support line at 5268.
The million dollar question is: will the price hover around that major support line or not?
Next support line after 5268 is 3680, and that is the support line I think is the most likely bottom.
However the optimist in me tells me that 5268 is the lowest low we will have this time around, until next bad news comes our way.
Personally, my buy order got activated around 6500 so my cash is spent; and now it is time for me to watch this unfold.
Wish you all a safe week, and dont forget to wash your hands well.


How I see the future of BitcoinThe last days have shown Bitcoin is still in the same bear market it has been in since the all time high. Every pump in between is just a correction (see: Elliott Corrective Waves) and has nothing to do with the start of a new bull market. A new bull market will start when most people have forgotten about cryptos and want nothing to do with them. That's what a bottom is - a period in time where there is close to no interest in the given asset class (see: BTC 2015 - 2016).
I see the start of the new bottom at around 2021 - the start of a new bullrun in around 2023.
Many people (mostly those who are emotionally bonded to BTC or want to get rich asap) see this theory as impossible or call it the death of Bitcoin - just like the last time Bitcoin went through a bubble in 2014 and did almost a 90% retrace. To me this is a normal thing to happen in cryptos so I would not worry, quite the contrary. The faster we reach the bottom the faster it will recover.
Good luck to everyone involved!

Is the bottom for bitcoin in? Retest of logarathmic growth curveWe have retested the bottom logarithmic growth curve which is historically the cause of the next bullrun

LONG - MDA - Trading OpportunityLooking like a double bottom here, sell volume looks all dried up.
Entry: 0.00006491
Target 1 : 0.00007482
Target 2 : 0.00008397
Target 3 : 0.00009410
Target 4 : 0.00010583
SL: 9301
CryptoCue is not providing investment advice and is not taking subscribers’ personal circumstances into consideration when discussing investments. Investment involves a high degree of risk and should be considered only by persons who can afford to sustain a loss of their entire position.
CryptoCue is not registered, licensed or authorized to provide investment advice and is simply providing an opinion, which is given without any liability or reliance whatsoever. The information contained here is not an offer or solicitation or recommendation or advice to buy, hold, or sell any security. CryptoCue makes no representation as to the completeness, accuracy or timeliness of the material provided and all information and opinions provided by CryptoCue are subject to change without notice and provided on a non-reliance basis and without acceptance of any liability or responsibility whatsoever or howsoever arising. You hereby irrevocably and unconditionally waive, release and discharge: (a) any and all accrued rights and/or benefits you may have against CryptoCue in respect of any opinion expressed or information conveyed by CryptoCue at any time; (b) any and all Claims you may have against CryptoCue arising out of any opinion expressed or information conveyed by CryptoCue at any time; (c) CryptoCue from all and any claims (whether actual or contingent and whether as an employee, office holder or in any other capacity whatsoever) including, without limitation, Claims you may have against CryptoCue arising out of any opinion expressed or information conveyed by CryptoCue at any time. ("Claims" shall include any action, proceeding, claim, demand, judgment or judgment sum of whatsoever nature or howsoever arising.) You hereby agree to indemnify and hold harmless CryptoCue in respect of any and all Losses paid, discharged, sustained or incurred by CryptoCue in the event of bringing any Claim against CryptoCue. (“Losses” shall include any and all liabilities, costs, expenses, damages, fines, impositions or losses (including but not limited to any direct, indirect or consequential losses, loss of profit, loss of earnings , loss of reputation and all interest, penalties and legal costs (calculated on a full indemnity basis) and all other reasonable professional costs and expenses and any associated value-added tax) of whatsoever nature and/or judgment sums (including interest thereon).

BITCOIN HITS BOTTOM GROWTH CURVE - Outlook over next monthsHey there,
Please support this post with your likes since this could be one of my most important ones!
Also comment down below and make sure you follow me here on TV!
Bitcoin just hit the bottom log growth curve, which has been the leading indicator for Bitcoins long-term
price swings imo. If you take a look back at the 2017 bullmarket you will see how precisely price respected the forcasted
growth curves and how it is still doing so.
On Bitstamp the lowest band is currently sitting at 7624 and with a daily bottom (03.09.2020) at 7636, that is a very
sufficient bounce/confirmation in my opinion. Keep in mind that it is actually rather common that Bitcoin moves along the
bottom line for a while, befor swinging back to its upper ones, so there is still room for a perfect touch.
Price has often wicked below the bottom band, but never managed to break through so I will not expect it this time either.
Also this indicator is respecting Bitcoins long-term growth potential and has more to do with data science and hard coding
facts, than with simple subjectivity.
Trusting this indicator and trading around it gave clear trading opportunities, which I will now try to utilise.
In addition to that we now have the potential for a huge inverse head and shoulders playing out over multiple weeks and months.
The neckline is alining perfectly and the second shoulder would be expected to bottom in the vacinity we are currently at.
Since Bitcoin loves ascending triangles as reversal patterns, I think it is likely that we see one here on the bottom, playing out on the
daily timeframe over a few weeks.
Maybe price will move along the bottom band in an ascending triangle formation, bringing price back
to the trendline drawn here on the chart, befor breaking above it. If price manages to find a higher low on the weekly/monthly compared
to 6.4k and ralleys back above 10K in the future, then not only would the chance for this inverse head and shoulders increasing exponentially,
but it would also confirm an ascending triangle with the bottom band of the growth curves and the neckline at 10400USD.
While all of this might seem a bit far-fetched for now, it would give one of the most bullish scenarios for Bitcoins longer term growth.
Of course my analysis is biased in the way that I strongly believe that Bitcoin will succeed long-term, so keep that in mind.
The next target would be the 200 day MA and the second growth curve messured from the bottom.
I will try to updated you on this indicator regularly, so make sure you follow me!
Cheers,
Konrad

The Short Term Bottom Almost Here!We posted this chart back on Feb 28th (see related ideas chart) and we said that we were looking for the number of stocks below their 200 DMA to hit the lows of 2018 before we see a Short Term Bottom. We are now in this area as you can see in the chart (white parallel lines). We are now looking to put Long trades on over the next 1-3 days.

XRP Last Round In The Chamber Last fib level for reversal Stochastic RSI heavily oversold. Seeing a possible double bottom pattern playing out right now. Exciting times if you remember the days prior to last ATH when XRP teased us at this exact same price range. Interesting to say the least...
Not Financial Advice.

Bottoming of the BMW share?We may see the beginning of a bottoming out of the BMW share with a subsequent upward movement in the medium-term price development.
Before it's here, it's on analysta.net ;-)
...read the full text on www.analysta.net
Math Is The Answer.
