Btcusdt also completed its Distribution so we are near to bottomBtcusdt also completed its Distribution so we are near to bottom ,
i am seeing next move for Bottom so it ll be a confirmation btcusdt prive move downward to 13k+ so i ll buy ..
13k+ ll be our bottom no more bear in my views .. near market is going to end soon next bull run i am expecting to 50k
maximum FUD expecting for soon ..
no more Bearish Scenario
Not a financial advice
my expectation btc ll bounce from 14380 or 13300+ tooo 50k
Bottom

100% profitable strategy to find lows of the marketIt all starts with the basics, SUPPORT.
My theory is, in order to find a bottom in this bear market, we must reach an area of support that has never been tested before.
I'm using the high timeframe of 12M on SPX for example. How I determine a pivot low (or support) is a 3-candle pattern. The middle candle being lower than the one before and after it is the pivot low. (green lines)
Every time a candle falls down through a pivot low that has not been touched, you will see the 'Untested Low' buy signal on the open of the next candle. If you were to buy on the candle of the signal, it will either be the next pivot low or the candle after it, meaning this would be a profitable buy! You can even go down to lower timeframe to confirm entry with the same strategy.
This untested low signal is what I will be looking for to indicate a long term buying entry in this current market.
** LINES AND SIGNALS CREATED BY THE HAZEL HERITAGE STRATEGY **

DGSTACC: SPY MICRO ANALYSIS / CHANNELS CONFIRMATION & SUPPORTS In the chart above I have provided a simple analysis on SPY that takes into consideration channel confirmation estimated by using an average deviation in the two hour timeframe.
1. As you can see previous pennant support has been broken to the down side.
2. Forcing price action to fall down too 375 where price action has seen a STRONG DEMAND before in November.
2. With data from November, if price action is to be supported by 375 this would confirm sideways action is in play with a SUPPLY ZONE AT 390 .
3. Channel up above our current one found support between 390 AND 405 so one can also conclude that SPY likes to move between a 15 POINT DEVIATION month to month.
4. Break down of 375 can push us down into the next fibonacci channel of 360 - 375 .

BNTX: NICE BOTTOMING BASE ON THIS VACCINE PLAYBNTX (BioNTech) Healthcare sector
German company. Produce the BioNTech biotechnology. Partnership with Pfizer.
Nice long bottoming base since March.
Triple bottom .
It looks like a rectangle pattern .
All moving averages turning up .
A move above the blue zone (>195) could take it to 248 and maybe more.
I'm long with a stop at 165.
Trade safe!

SPX: A BOTTOM sign! Pay attention to these Key Points!• The index is reacting above our support level, as expected, and it seems it wants to bounce;
• A reaction was already expected, since the SPX just filled our gap;
• This is a bottom sign, but the main trend is still bearish. The SPX must break its 21 ema again, in order to resume the bullish sentiment;
• In addition, the 3,911 is another key resistance – the 3,911 worked as a support/resistance multiple times in the last semester of 2022;
• On the other hand, in order for it to resume the bear trend to the 3,744 (next support, red line), it has to lose the 3,818;
• Right now, the index is a no man’s land, but we’ll see some definition soon.
Remember to follow me to keep in touch with my daily analyses!

BTC: WILL MANAGE TO HOLD THIS LEGENDARY SUPPORT LINE??Hello everyone, if you like the idea, do not forget to support it with a like and follow.
Welcome to this important weekly BTC update.
As 2022 is about to end, If you still manage to survive in this bear market and read this update then congrats you almost make it, and soon this bear market pain will be over.
We have been in a bear market for more than one year. And the biggest question of this year is "WHERE IS THE BOTTOM OF THIS BEAR MARKET?" So in this analysis, I'm trying to give you some hints and my thoughts regarding this.
As you see in the chart, we have a very crucial support line at around the $15k level. BTC manage to hold this trend line for the last 5 years. Every time price touched this trendline, we got a very good bounce. So there is a very high chance that history repeats this time also.
In the worst case, if we got any weekly close below $15k then be ready for a $10k-12k level but as long as we hold this legendary trendline support bottom is here.
What do you guys think about this?
Share your thoughts in the comment section.
If you like this idea then do support it with like and follow.
Thank You!

All major bottoms have repeating elements (2008, covid, now)Pt.3All these major crashes within these last 2 decades, as well as the one we are experiencing now, deemed the "Great Inflationary Crash" all have the same repeating factors when price is close to a bottoming price, it is nothing for certain but it is just a repeating factor that may very well repeat again at the bottom of this downtrend. I think this specific crash will be much different from the others as we are in an inflationary bear market, which is the worst type of bear market. Apart from that the SPX has not drawn down as much as it should've by now so we will definitely go really low to one of those two targets I outlined which will mark the bottom. The only question is... which level will be the bottom? In the end, only time will tell so let's submit to time and let it take its course, will update.

All major bottoms have repeating elements (2008, covid, now)Pt.2All these major crashes within these last 2 decades, as well as the one we are experiencing now, deemed the "Great Inflationary Crash" all have the same repeating factors when price is close to a bottoming price, it is nothing for certain but it is just a repeating factor that may very well repeat again at the bottom of this downtrend.

All major bottoms have repeating elements (2008, covid, now)All these major crashes within these last 2 decades, as well as the one we are experiencing now, deemed the "Great Inflationary Crash" all have the same repeating factors when price is close to a bottoming price, it is nothing for certain but it is just a repeating factor that may very well repeat again at the bottom of this downtrend.

BTC Wall Street Cheat Sheet - Completely for funI'm a Bitcoin bull but I decided to take a look at the bear side and see if I could apply the Wall Street Cheat sheet to Bitcoin.
It's hard to fit it but if the bears want to make the case that the top is in, this is one extreme scenario. It won't be popular.
Do not get excited or mad at the chart. I put it together in a short amount of time as a fun chart.

BTCUSD bottom end yearyear 2022 will end, and BTCUSD will find its bottom. A potential bottom price of 12K is on demand.

Bitcoin TA bottom in 2023If you draw a trendline between two cycle top whats next too each other and clone it to the cycle bottom that line will cross with the next cycle TA bottom. Fact thats line currently 25% under the bitcoin price and some banks and hedge founders predict to 2023 a 25-20% crypto and stock market crash.

PIDILITE INDIA, ANALYSIS!!a monopoly stock, with great returns in a year, is the greatest thing to have.
a detailed analysis is written down:
firstly , the red trend, is the original trend past corona crash.
now since the markets had become bullish post corona crash, it has formed a new trend, and that is drawn by dark black line. the red line resistance, has now become support of stock.
after the rally, markets were consolidated, and the stock was moving sideways. then came the june- sept rally 2022, since then markets got consolidated, and became volatile.
since then from 3 months, stock is forming a good traingle pattern, there could be a breakout.
moving to next point,
since the stock is bottom of its trend, this makes sure that is in its support zone, a good pullback was show today.
RSI ANALYSIS: average time of stock's rsi moving is from 50-70. currently the stocks rsi is 50, this says that unless there is a bear market for pidilite, the stock is bottom off. this again shows a bull move, coming.
i predict that, if volume not supporting the price, and if INDIA'S bear market for shorter term, continues, stock could fall further, but since the stock has been mostly bottomed out then if stock started showing a positive move, then one can take some swing positions, and may exit around 2800. if it breaches the 2600 support of traingle formation, then i see downside till the 2500.
i hope that stock would move about 7% upward.

This indicator could say that we hit the bottomLooking at the Anchored VWAP Indicator (Volume Weighted Average Price)
Each time using the previous cycle bottom from the last cycle. (2015 and 2018)
It could represent something significant, return to the average, meaning the bull and bear cycles are done, and the long term trend continues, unless we enter a long term perma bear trend territory ofcourse, but if nothing fundamental has changed with crypto, I don't know yet why the long term trend would reverse, fear will turn to greed eventually.

BTC Breaks Downward Resistance from ATHIf we view the all time chart on three separate time frames - Monthly, Daily, 4H, we can see that we have broken ATH all the way up to the 3D chart. Weekly and Monthly confirmations coming soon I suspect. To expect Bitcoin to drop further below from this channel into the "Birth Channel", we could see it in 13k's. This channel has only existed in a period once prior, however - before institutional capital started flowing into Bitcoin. To see BTC price go yet even lower than the "Birth Channel" is to expect Bitcoin to drop to a price channel where the only people using it were supernerds, stoners, and their dealers.
You tell me if that is reasonable or not. In my humble opinion: bottom is in, yall.
This is not financial advice.

HNT Helium is at the bottom.If it holds here, it may signal the end of the bearish move for this coin.
Hard pumping would be shown in a stable market.
-Right time for holders
-Low risk to scalp

$BTC Micro and Macro TargetsAll details are mentioned in the chart.
If you have any questions, please feel free to ask. Btw, I'll buy alts, not $BTC (it's for multi-millionaires). Alts like $Dot at $3-4, $Avax at $9-11. DCA
I'll invest in 4 strategies:
(i) 3-5 Blue-chips --> 80% portfolio
(ii) Fundamentally strong low MC --> 10-15% portfolio
(iii) Lower MC with strong community --> 2.5-10% portfolio
(iv) NFTs, ICO, others --> 2.5-5% portfolio

BTC MARKET UPDATEThe bears couldn't push the price below 16800 Support. The price bounced from the 16800 support due to the massive BUY ORDER BLOCK and moved above the 17000 key level. If we notice the daily timeframe then the price is under the consolidation box for a long time, any movement outside this box with a strong confirmation will be massive (whether upside or downside) Trade Carefully and Stay Tuned!

LTC BOTTOM – RSI StudyLTC is in very similar bottom fractal in price action as well as in RSI. If the fractal is to be repeated, we are expecting one more down wave and consolidation with higher lows after that, before the next bull market.

CARVANA to 0 will be a big indicator! (Bottom)ENG:
- Carvana is a used car dealership that operates like a unicorn. (they don't make money, they operate on loses).
- Sadly, Carvana is NOT a tech company that can generate additional revenues in any other way other than: SELLING CARS.
- Used car sales for the past 2 years went crazy towards the upside, and are now crashing fast.
- Most car loans generated in these last 18 to 24 months are underwater by quite an insane margin.
- The Car Repo Business has acquired long term properties, to not drop all inventory into the market at once, and kinda stabilizing prices.
- High interest rates make it impossible for average people to buy new or old cars at the moment and for the next year or so based on what the Fed says.
THESIS: Carvana shouldn't exist. They took advantage of being funded like a technology company, when their business model never evolved further than any other conventional car sales company.
Carvana is ONE OF MANY companies that shouldn't exists in this market. Until we see these companies go bust and what the consequences to the investment firms that poured money into them are, we can't call it a bottom.
-----------
- Carvana es una concesionaria de autos usados que opera como un unicornio. (no ganan dinero, operan con pérdidas).
- Lamentablemente, Carvana NO es una empresa de tecnología que pueda generar ingresos adicionales de otra forma que no sea: VENDER AUTOS.
- Las ventas de autos usados durante los últimos 2 años se volvieron locas hacia arriba y ahora se están desplomando rápidamente.
- La mayoría de los préstamos para automóviles generados en estos últimos 18 a 24 meses están bajo el agua por un margen bastante gordo.
- El negocio de reposesion de autos, ha adquirido propiedades a largo plazo, para no dejar caer todo el inventario en el mercado a la vez y asi estabilizar un poco los precios.
- Las altas tasas de interés hacen que sea imposible para la gente promedio comprar autos nuevos o viejos en este momento y durante el próximo año, según lo que dice la Reserva Federal.
TESIS: Carvana no debería existir. Aprovecharon que se financiaban como una empresa de tecnología, cuando su modelo de negocio nunca evolucionó más que cualquier otra empresa de venta de automóviles convencional.
Carvana es UNA DE LAS MUCHAS empresas que no deberían existir en este mercado. Hasta que veamos que estas empresas quiebran y cuáles son las consecuencias para las empresas de inversión que invirtieron dinero en ellas, no podemos llamarlo fondo.

BTC Break downOn the 2 weed LOG chart you can see how the pattern falls over, Its getting to the point where it breaks down according to the 4 year :\"bare bottom" cycle
On some major trend lines it has already broken down but you cant see it on the daily chart.
Channel pattern below represents the price structure on how it normally flows.

Bitcoin head and shoulders Are we seeing a possible head and shoulders forming here on the 4-hour chart for Bitcoin? This would coincide with the $9500 target and possibly a slightly lower price into the $8900 level for Bitcoin. This price action would actually bring us into this Gareth Soloway yellow trendline.

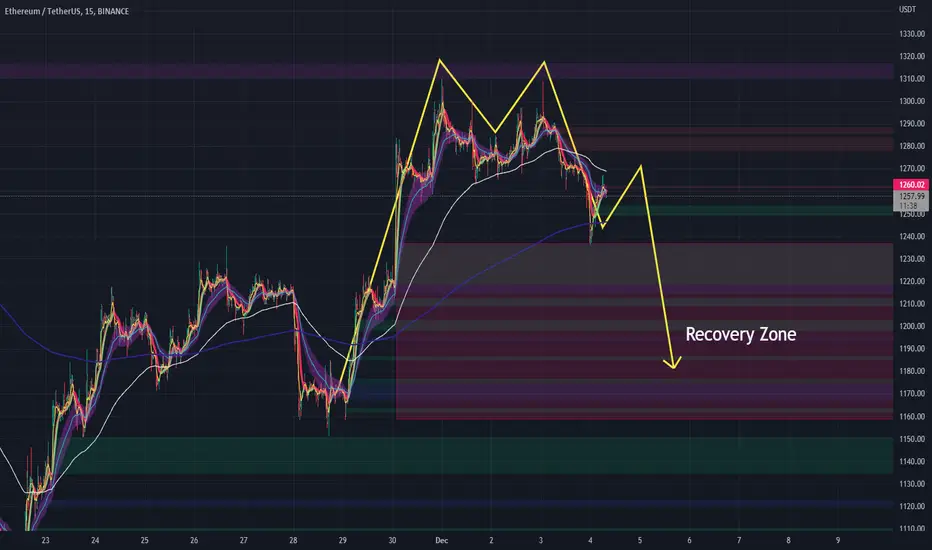
ETH Short SignalWe got a clear M formation and lots of zones to recover marked as "Recovery Zone".
A SHORT Entry would be between 1250 and 1270USD on ETH/USDT.
Monday we will see the play when markets are open.
Until then, keep your feet on the ground an prepare.
Have a great Sunday