FIVERR Showing Life @ Bottom Consolidation Zone Hi Guys, Welcome!
This Technical Analysis is about Fiverr (FVRR), its on the 3 Day Timeframe.
Since May 2022, we've been in what i believe to be a BOTTOM consolidation zone.
As you can see we are back around the prices where FVRR first became public.
This is about 90% from the TOP of Feb 2021.
The BOTTOM Zone is shown as the GREEN Rectangle with the RED Borders.
The Upper RED Border indicates MAJOR RESISTANCE
The Lower RED Border indicates MAJOR SUPPORT
I believe price action to be CURRENTLY moving to the BLACK RESISTANCE LINE labeled July 2021, the date being when the resistance first formed.
I believe this to be our current target as we have only touched it 2 times before.
Its been about 1 year since we've INTERACTED with the BLACK RESISTANCE LINE.
When we reach however, we will have to see how PRICE reacts with the BLACK LINE.
Since we have NOT interacted with this LINE 3 or more times, it could be a potential area for a PULL BACK, thus can be a potential SELL ZONE.
NOTE: TREND LINE theory states that for a trend line (whether resistance or support) to be broken, it requires ATLEAST 3 touches.
We have closed our RECENT 3 Day Candle Today, where the head is ABOVE 50 DMA (GREEN MA). Our next candle or couple of candles needs to CONFIRM SUPPORT above the 50 DMA (GREEN MA). Doing so will also add to the PROBABILTY we get to the JULY RESISTANCE.
KEEP IN MIND: If we DO NOT stay above the 50 DMA, we may go back down to test FIRST, the 21 EMA (ORANGE MA), if we fail that then back down to the BLACK or RED SUPPORT lines.
We need to watch how the 21 EMA (ORANGE Moving Average) reacts with the 50 DMA (GREEN Moving average). Note that the GREEN Circle with BLUE Arrow shows that when it CROSSED, PRICE moved UP.
Currently, 21 EMA is curved up, indicating that we may be close to a CROSS. This would be a MAJOR catalyst for BULLISH MOMENTUM.
Notice also how the 50 DMA has been FLAT, this may be an indication of prices stabilizing and a possibility of a BOTTOM.
Take a look at the LOWER BLACK SUPPORT LINE near the LOWER RED BORDER of RECTANGLE.
This LINE coincides with the lower BLACK upsloping line found in RSI.
-> This indicates a BULLISH DIVERGENCE, which is a BULLISH PATTERN where PRICE shows LOWER LOWS as it interacts with BLACK LINE but INDICATOR shows HIGHER LOWS.
On the RSI we are currently peaking our head over our 1st RESISTANCE. In the coming weeks we need to test this as SUPPORT and CONFIRM.
I think though, once we get ABOVE the previous HIGH in the RSI, we may be underway on breaking OUT of the CONSOLIDATION RECTANGLE.
As of posting this, STOCH RSI AND ADX are bothing indicating that we have plenty of MOMENTUM still left in the tank for this current move to continue, strengthening the probabilty we continue up to JULY RESISTANCE.
LASTLY, Notice the ORANGE Trendline labeled "From FEB 2021". This is our MAJOR MAJOR TREND LINE. Above this, we are in a Definite FVRR BULL RUN, in my opinion. It is about a 100% increase from current prices to reach here, to give perspective.
CONCLUSION:
It is likely that FVRR is either in the late stages of BOTTOMING or has already bottomed with its LAST touch of the BLACK SUPPORT LINE. We've been in this range for over 1 year, indicating accumulation. Currently, we may be in the process of moving towards the JULY 2021 Resistance line, and attempt for a TREND CHANGE. Even though traders don't have a crystal ball, evidence in the charts can help point to probabilities, 2 being the STOCH RSI & ADX which show that there is still enough Bullish momentum to push prices. Signs also point to a potential 21 EMA 50 DMA CROSS, which can help push price UP. The formation and eventual play out of the BULLISH DIVERGENCE may be a sign of a BOTTOM and also be what is needed for us to push past the BLACK RESISTANCE Line.
Hope this was insightful. Please follow, boost and comment to support my ideas and let me know what y'all think and see as well! Would love a discussion. Thanks!
DISCLAIMER: This is Not financial advice i am not an advisor. The thoughts expressed here are my opinions on TA and for educational purposes.
Bottomfinder

The Bottom(s) You Should Be WatchingChikou span up crossing price, generally forecastimg a breakout.
However, this move will likely take months to play out due the time frame being on the weekly.
Price action has been making higher lows and higher highs since November 2022.
TRIX illustrates how deeply oversold this was based on technical indication.
Despite the move up in momentum signaled by the TRIX, it still hasn't broken above the zero line, since the initial sell off began.
Guy n' Girls be on Tinder, Bumble, and Hinge, but y'all watching the wrong bottoms. 🍑 👀
As always, DYOR. This is not a signal. This in simply an analysis of price action and a forecast.

TSLA: Bottom nailed! What's next on it?• TSLA did a powerful bottom sign just after it hit the $165 support line, the key point that I mentioned yesterday, on our previous analysis (link below this post, as usual);
• Now, TSLA is trigged a short-term reversal structure, as it did a higher high/low, breaking a pivot point at $169.51, and it is above the 21 ema (which is pointing up now);
• So far, there’s no top signal indicating a possible correction, and since TSLA reacted above our support level, it is avoiding a sharper correction, for now.
• On the daily chart, TSLA is still bullish, as it has been following the pattern of higher highs/lows, and our key support at $165 did an amazing job yesterday;
• In addition, TSLA broke the 21 ema resistance today, which was acting as a resistance yesterday (yesterday’s high was just at the 21 ema);
• The next technical resistance is at $177, which is the previous high and the trigger point of another bullish pivot point. By breaking this pivot point, TSLA will resume the bull trend and seek higher levels, probably around $200;
• Lastly, the gap at $177.65 wasn’t filled yet, so TSLA has more upside left.
I’ll keep you updated on this, as usual. Remember to follow me to keep in touch with my daily analysis.

Reminder for Ethereum buyersSame for bitcoin but for Ethereum is a bit different. Ethereum had made of its own roadmap; so it’s going to be a bit of a roller coaster.
400-550 area is the bottom for Ethereum. The blocks from it going to be incredible before bitcoin halving in April of 2024.
History is slowly repeating itself of all cryptos ( some of it had gone there before).
The new uptrend needs to be created ASAP; old trendline couldn’t hold much longer but has to create new lows & new bottom to form an stronger uptrend.
The new high for Ethereum is $10,000 but I can see will hit $5,000 more before 2030.
Overall: The buys going be short and mid term just to meet resistance before the big crash and the bears are already back will be stronger than ever. Trade safe and watch any reversals do your thing.
Let’s make this bag

Reminder for bitcoin buyersReminder in case forgets; 15K isn’t the bottom.. the floor from it isn’t enough strength for the bulls.
The strongest floor for bitcoin to bottom in is inside $10,000 area; apparently about 10,800-10,200 area around there.
It be a lot lower only if it happens we will see because experts said 5000-8800 area; could happen maybe.
After the big drop the buy will be short and retrace to complete the correction; some will be short or mid term.. watch the reversals and the candles movements.
Where it’s at right now should be able to hit 35 or maybe 40K before the longterm sell off downturn comes around.
Anyways trade safe and let’s make that money

TSLA: A Bottom Signal (Finally)?• TSLA has finally made a bottom signal above the support line at 154.76, indicating that it should jump to higher levels;
• The problem is the key point around 164, a previous support level that is acting as a resistance now. This is the same key point we mentioned in our previous TSLA analysis – the link is below this post, as usual;
• Also, despite the bearish signal, there is no bullish reversal signal (two different things) - as long as TSLA remains below 21 EMA, sentiment will remain bearish (medium-term);
• If TSLA loses support at 154.76, that would frustrate this bottom signal, and TSLA would just fill the gap at 146 next.
• On the 1-hour chart, we see that TSLA is reversing the trend, as it is making higher highs and higher lows. The 21 ema is still flat, and price is dancing around it, but TSLA has given us some promising signals in this time-frame;
• The line at 157 was the trigger point of a Double Bottom chart pattern (as evidenced by the red lines), and that line appears to be acting as support now;
• To see TSLA jump to higher levels on the daily chart, it must confirm a continuation on the 1-hour chart, which means it must react as soon as possible, preferably above the 157 line - otherwise, this bullish thesis may be frustrated;
• For now, the two key points are the support at 157 and the resistance at 164. A breakout in either direction could bring something new for us. I will keep you updated on this.
I will keep you updated on this. Remember to follow me for my daily analysis.

CAD/CHF LONG SETTING UP Here is one that I forgot to publish a couple of weeks ago. I think it will push up soon based on what my indicators are showing. FX:CADCHF

Long last weekStill heavily shorted, fundamentals aren't playing a role in this moving currently. Chart beaten up heavy and volatile. Still has room to go up if it squeezes again. Fib extension for target areas. Small size, wider stop.

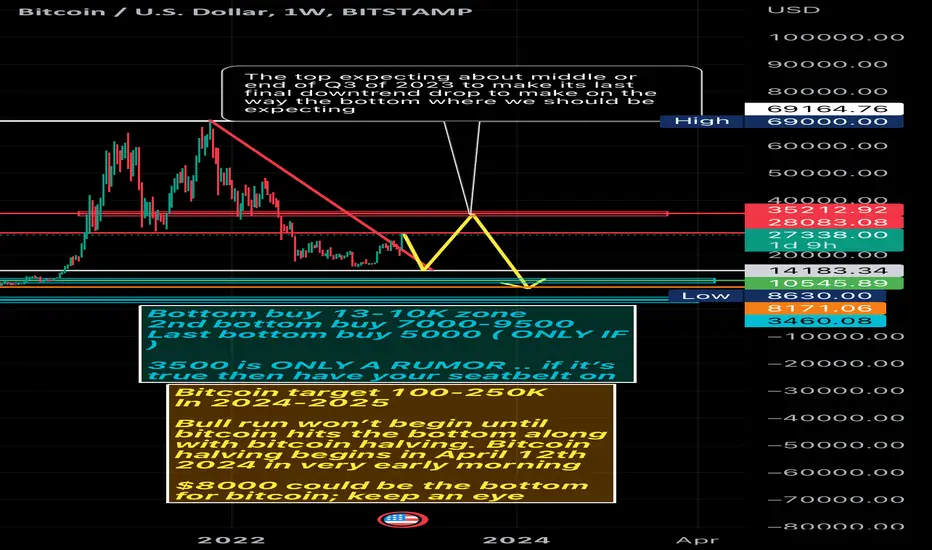
Where to buy and when is the halving .. LISTENOkay everyone listen carefully please like and comment of any of your opinions.
USA and globally is not in a very good shape as we speak. In US 3 banks collapsed and then other few banks collapsed as well; Federal chairman Powell has two choices.. he ether will cut the interest rates and pause interest rate this year and start the money print.. and just watch more other banks collapse or 2 they can just keep raising interest rates to stick of the plan if it is the the inflation will go wild and go higher and higher and everything will be even more expensive than before.
Fundamental Financial Recession is coming as we speak.
Bitcoin has NOT hit the bottom and bull run is not here so please stop saying bullrun because lots of things are happening even nuclear war is coming as well.
I know you don’t like bad news and so don’t I .. everyone don’t like bad news.
Bitcoin hit the resistance but no choice to down drop and go new lows in order to hit 35K after the top hits from 35K bitcoin will be heading to the bottom, should expect bottom is in few months before the bitcoin halving in 2024. My bottom prediction is 13-10K if not then 8000-5000. Those are the bottomed with strong ground floor support; until any of those 4 bottom is in then bullrun will return strong and full breakout from there before bitcoin halving.
Bitcoin halving should be expecting in April in 2024 very early in a morning; during bitcoin night drop a bit and attack upside green to breakout a lot faster.
Please save the date of the bitcoin halving and it’s better to buy before 2023 is over until we welcome 2024.
Hope this helps and do your thing, let’s get rich and have a bless day.
EUR/USD possible deep dig before reversal.My belief for this pair is that price will continue down into the stops of long consolidation periods in January and December. When I see long consolidations, I see very impatient participants. So far buyers been in heat from a down move that lasted 3 weeks. Price is reaching my levels. Truth is that the market may not care about my levels. And that's fine. Maybe it's not meant to be. All I know is that the closer it gets, the higher the probability of it hitting them. So I'm only interested if they are reached. When they are reached and worked down thru, I know that panic is ramping up and I'm paying attention to the large timeframe pattern. My drawing is an overall idea of how I think it will play out so
don't take it as a 1:1 ration prediction. I also approach this as a long and steady outlook. Price could easily collapse down but I think it's more likely that the low will be worked long and steadily. I'm not into what's going on with the news, what indicators are showing, whether price action looks weak or strong, and I don't do support/resistance lines. My predictions are based on what I perceive to be more financially adventitious for institutions and right now I see a ton of money below. When everyone is calling a bottom right at or near already established ''support'' my comfortability is much more deeper. FX:EURUSD

AUD/USD possible bottom with trapped long timeframe breakouts.I see a lot of accumulated volume underneath large timeframe breakout levels.There are weekly breakouts,monthly,and the year being pushed down. Sellers are chasing it down and it has already broken past my first 2 levels. In the coming days or weeks, I'm looking for price to hit the rest of my levels before reversing to hit the chasers and breakouts. FX:AUDUSD

Possible bottom for NZD/USDThis is a similar setup to GBP/USD. I wouldn't expect a deep dig underneath the buyzone.Maybe accumulation and a stops hit below it before reversing. When I'm calling tops and bottoms, that don't mean that price will trend up or down for eternity from there. These are setups I'm confident with to add size into or have a wider stop. I don't know what the market will do but from backtesting, when these levels are generated, there is usually a reversal that follows.Sometimes it's insntantly, sometimes it's over the course of days.I wouldn't enter trades on them especially the first 1-3 levels.

Possible bottom to get into trend earlyI have key levels marked that I'm looking for price to get through. I'm not buying nor selling at these levels. These levels represent a certain distance within a certain amount of time price has moved. When price fulfill these levels and even better overextends past them, I will look for a reversal. This is a swing strategy and where I'm comfortable using a wide stop if I'm confident that the low has been put in well past the last level. I'm also looking at other factors and will mark up the chart of what I'm looking at to confirm my bias.

HOW TO BUY THE DIP- What is considered the bottom for a coin?
- How to identify the bottom?
- What technical analysis tools to use?
- What are the fundamental prerequisites for the bottom?
What is the bottom for a crypto asset?
The bottom is the lowest price level of a crypto asset, after which the price of this asset is expected to rise.
The bottom is not always an absolute measure for the entire history of the existence of an asset, but can be calculated for a certain period: a year, a quarter or a month.
How to identify the bottom
Each trader has his own set of tools to determine when to buy an asset.
Here are some of the most clearest signs to each of us:
There is a protracted flat with the upper border breakdowns
The movement occurs in a strong support zone and is accompanied by high volumes
The order book contains big bid checks
Good news on the market or the project
The price is lower than the sale price (ICO, IEO, IDO etc.)
The bottom we search for is not a new all-time bottom
Protracted flat with the upper border breakout
If you observe that for a long time: 2 weeks, 1 month, - the price is at the same level, while occasionally trying to “break out” up, that is, the resistance line is broken, then this is in 90% of cases - the impulse to the rapid growth of prices.
However, if the breakout is more often than just the support level, then get ready to test a new bottom.
Strong support zone and high side volumes
Determine that there is a strong support zone at this level, that is, it met more than 3 times on the chart for the period under study and is supported by good horizontal volumes (Volume indicator).
Display the VPVR (Volume Profile Visible Range) indicator on the same period on the screen and evaluate whether the maximum vertical volumes for the selected period are at this level.
Big average checks
If you observe volumes above average with a “small” candle body, then there are purchases at the same price for a large amount.
This may indicate "big checks" or high market density.
To confirm the existence of “big checks”, you can refer to the order book and make sure that there are real bid orders for large amounts.
Fundamental prerequisites
As an extra springboard from the bottom, news resources can:
Issue positive analytics from experts on this asset
Record the activity of major players - funds
Report new technologies that have been released or are about to be released by the project
Share the conditions for large investments in the project by large funds, etc.
Price analysis for IDO, ICO and Private Sale
If the project token or coin appeared on the market following one of the popular types of crowdfunding: ICO, IEO or IDO, the most popular one, then you need to compare the Public Sale price with the current price.
If the current price is below the Public Sale price of the IDO, then you can put this in another checkbox on your checklist as a sign of a potential bottom.
If the IDO price was lower, then this is not a bottom, there are still a large number of investors on the market who bought the coin at a lower price, which means they can sell it cheaper.
Our bottom is not a new all-time bottom
As we noted earlier, a support line is formed at the level of the potential bottom.
If the price has never dropped so low in the history of the asset, then we cannot build a support zone, which means that the price can go even lower and find many new bottoms.

BTC Pi Cycle Bullrun SignalHello friends
Today im going to show you a good reason for next Bullrun in Bitcoin.
Pi cycle includes 2 Moving Average:
One Long MA and One Short MA.
when we devide this 2 MA the result equals PI number (around 3.15)
The best Long MA is 471 DAY and the best Short MA is 150 DAY.
I illustrate them in BLX chart and yo see the last 2 times that Pi cycle Bottom works properly.
the first Bottom was on JAN 2015 and second Bottom was on JAN 2019 and NOW on JAN 2023 (as i show them with Red Circles in my chart)
the indicator signal a Potential Bottom for BTC.
If Short MA (RED) surpass Long MA(GREEN) we call it a PARABOLA and the Bottom confirmed.
If you think more about that you understand this cycle happened every 4 years actually on January.
2015 - 2019 and NOW 2023.
So i explained Technical and Time Cycle Analysis for this Strong Indicator.
Hope it predict Bottoms WELL.
Be Profitable
Thank You for reading my Idea
Share me your Opinion.
Do you think BTC make a bottom NOW?

LINK Hello, this is a swinger trader STUKOVA!
On the 6H timeframe we can see a nice up trend. I expect to see the 4th touch of the trend line on my personal red indicator + EMA and then I can decide if I enter a pullback or if I wait to see a breakout. I trade with the trend lines so for me it's crucial to see the real trend and to enter a trade as early as possible!


SP500 | SPY - Bottom for the bearmarketIf we look at the rising trendline from 2008 you can see that we have a strong support there around 320 SPY . The fibonachis line up pretty well with that too. We also have strong support around that level from the coronadays.
If you measure in M2 supply you can clearly see that we should atleast go down to 2000 levels, low as 2008 may be a overreaction. With the current market condition, high rates + high inflation + energy crisis + credit card debt at ATH I believe we should go lower down.
RSI does also point that we should go lower if we are going into a similiar bearmarket as 00 and 08. The drop from top to bottom will be lower than 00 and 08 but there is many more people invested in the market today than it was at that time, which will make a difference. We also dropped 2 years ago during covid, and that was a massive drop, due to that drop we may not need to drop as much as 50% this time.
During the coming earnings this Q1, We will see many companies with lower earnings . Due to lower spending from customers, expensive goods and a smaller workforce.
320 SPY may be the bottom and that is where I will start buy. The road to that bottom could vary, The potential for more upside is still likely but if so we need to break the decending trendline which will be very hard to break.
NFA
DYOR
Good Luck
/aFinancialMind

TSLA: Dead Cat Bounce or not? Key Points to watch from here!• TSLA is going up nicely, as we expected since our previous analysis on it. We nailed the bottom at $110, and now it seems it is just heading to the next resistance at $126 (the link to my previous analysis is below this post, as usual);
• In the 1h chart, we see that TSLA corrected since it hit $123. This is acceptable, but it must not too much from here, otherwise, it might ruin our thesis that it’ll hit the $126, and just resume the bear trend (which is still extremely strong, by the way);
• In addition to the $126, there’s a trend line in the 1h chart, connecting the previous top levels, and this could work as a resistance as well;
• Only if TSLA breaks this trend line and the $126, it might have some chance of bouncing to higher levels, like the 21 ema in the daily chart - otherwise, it is just a Dead Cat Bounce;
• The situation is still delicate on TSLA, but let’s watch these key points carefully from now on. I'll keep you updated on this.
Remember to follow me to keep in touch with my daily analyses!

Btcusdt also completed its Distribution so we are near to bottomBtcusdt also completed its Distribution so we are near to bottom ,
i am seeing next move for Bottom so it ll be a confirmation btcusdt prive move downward to 13k+ so i ll buy ..
13k+ ll be our bottom no more bear in my views .. near market is going to end soon next bull run i am expecting to 50k
maximum FUD expecting for soon ..
no more Bearish Scenario
Not a financial advice
my expectation btc ll bounce from 14380 or 13300+ tooo 50k

AAPL: Pay attention to this Multi Resistance level!• AAPL is stabilizing, and now it seems it wants to bounce. This is expected, since it dropped sharply recently;
• Since it lost our previous support at $134 (which I mentioned in our last study – link below this post), I was expecting that AAPL would seek the $128, the next support level, but the bears could only take it to the $129s;
• Although this is a bottom sign, the bias is still bearish in the daily chart. The strongest resistance on AAPL, in my view, is the $140 area;
• The $140 worked as a support level on Nov 29 – 30 and Dec 07. The 21 ema is at $140 as well. In addition, the $140 is the 38.2% retracement;
• Only if AAPL breaks this key resistance area it would truly reverse this bearish sentiment;
• For now, AAPL is doing a bottom sign. If it closes above the $134 (red line, previous bottom), it’ll be perfect, as the $134 is supposed to work as a secondary resistance in the short-term. I’ll keep you updated on this.
Remember to follow me to keep in touch with my daily analyses!

SPX: A BOTTOM sign! Pay attention to these Key Points!• The index is reacting above our support level, as expected, and it seems it wants to bounce;
• A reaction was already expected, since the SPX just filled our gap;
• This is a bottom sign, but the main trend is still bearish. The SPX must break its 21 ema again, in order to resume the bullish sentiment;
• In addition, the 3,911 is another key resistance – the 3,911 worked as a support/resistance multiple times in the last semester of 2022;
• On the other hand, in order for it to resume the bear trend to the 3,744 (next support, red line), it has to lose the 3,818;
• Right now, the index is a no man’s land, but we’ll see some definition soon.
Remember to follow me to keep in touch with my daily analyses!

AMC: Hit our CRITICAL SUPPORT LEVEL! What to expect from here?• AMC hit our support level at $5.05, which I mentioned in our previous post, here on Tradingview (link below this analysis);
• Now, it seems it is stabilizing, but we don’t see any bottom sign yet (not confirmed, at least);
• If AMC does a bullish reaction above this support, we can expect a bounce, at least, to the 21 ema in the daily chart;
• A bullish reaction could be any bullish candlestick pattern/structure above this key support;
• On the other hand, if it fails in react around the $5 support, AMC would seek the next support around $3;
• Either way, AMC is in a critical situation, and it is an interesting to put on our watch list, as regardless of what happens, it has a lot of potential;
• So far, AMC’s movements have been easy to read. I’ll keep you posted on this.
Remember to follow me to keep in touch with my daily analyses!
