S&P Bounces At $4000The S&P 500 continued to decline last week. Past levels of support formed from
previous lows, so we had to look at the next obvious level of support.
In this case, it was not a previous high or low but a psychological level in the form
of the $4000 round number. The weekly timeframe clearly displays a reversal candle
that did not close below $4000, which is a good indication of it being a strong level of support.
Price could still break this level, but for now, it is holding. What we want to see going
forward is a bounce from support and a resumption of the bull trend. A pattern of higher
highs and higher lows will indicate bullishness in the market.
If you like enjoyed this post, make sure to like, and follow for more quality content!
If you have any questions or comments, comment below. We reply to every comment!
See below for more information on our trading techniques.
As always, keep it simple, keep it Sublime.
Bounce

XAUUSD (GOLD) price actionGold showed a dead cat bounce after hitting a fresh three-month low at $1810.
Technical:
The near–term support is around $1800, a breach below targets $1750.

Bounce tradeBecause the market is in such an extreme short term oversold condition now it makes it easier to trade a bounce. because you don't have to be in near the bottom


Potential Bullish BTC 11 May 2022BTC 11 May 2022
The current implied volatility is at 81.61%/year
So that converted into daily is 5.14%
The opening price was on 30970
So based on that our
TOP 32600
BOT 29410
This channel has a 88.3% change to sustain based on the last 290 candles
At the same time with 79.3% changes
TOP 32200
BOT 29800
From fundamental point, today we have CPI release and this marks a huge volatility moment
From volume point, current POC is around 31100
So based on this, and how the SPX market moved in the last 12h aprox, I can expect a small bullish moment
for this we can wait and make a long entry around 30k, with a stop loss on 29750/29500/29410
The other was is to not wait for the rebounce on the support and instead just enter now, with the same stop loss values.
For take profit look for 31k+, after 31k you can start securing some profits and move the stop loss on break even.

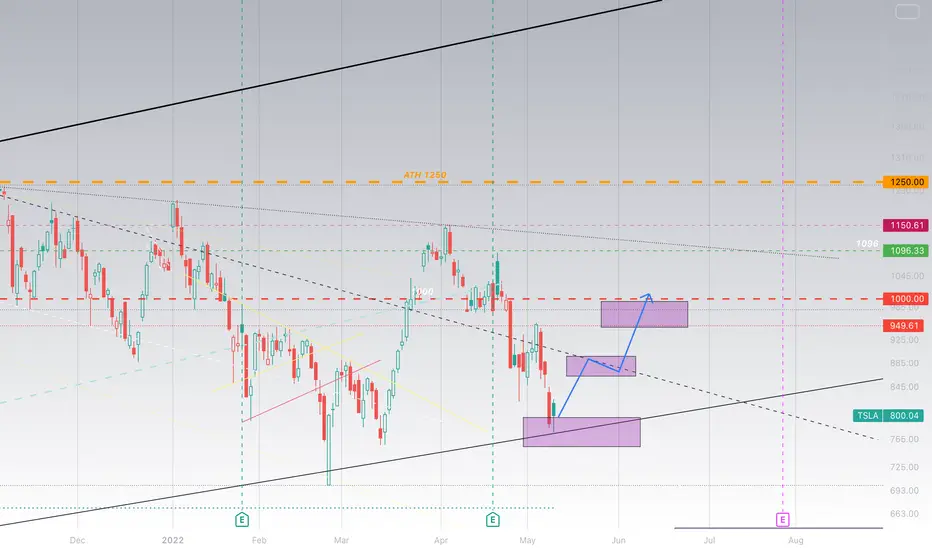
TSLATSLA is at bounce zone right now off of the trendline. Regardless underneath 800 is a buy and I think we see this have a nice sized bounce in the coming days or next week.
1000 test isn't out of the woods.
AR - Scalp short. Follow it before it's too late!We can take short either on breaking two levels that are lower or when price makes false breakout of local high. Be aware about btc strip.
⭐️ BTC bearish
⭐️ Trend is bearish
⭐️ Volume at top
⭐️ Good levels nearby
⭐️ Doing last pullback to kill bears
⭐️ 161 ATR
Will enter when price squeezes to the level on lower timeframes, the base will form and the strip will get faster.
Fix profit by parts:
1% - 1/3
2% - 1/3, stoploss to breakeven
What's left, hold to the maximum
What do you think of this idea? What is your opinion? Share it in the comments📄🖌
If you like the idea, please give it a like. This is the best "Thank you!" for the author 😊
P.S. Always do your own analysis before a trade. Put a stop loss. Fix profit in parts. Withdraw profits in fiat and reward yourself and your loved ones

BTC: BOTTOM IS IN OR MORE DUMP AHEAD?Hello everyone, if you like the idea, do not forget to support with a like and follow.
Welcome to this BTC update. I know it is a very tough time for each of us but remember these tough times are always a big buying opportunity also. First of all, do not panic still we hold an important level of support.
Let's get to the charts first.
BTC is reaching the lower trendline of the parallel channel which is formed in the weekly time frame. BTC holds this channel since the starting of 2021. Every time price came to lower support we have seen a very good bounce in it. I'm expecting the same this time.
Although, we might see some wicks below the channel the important thing to watch out for is the next weekly closing. If next week closes below the channel ($30k) then our next main support level is at $19k.
Right now this is the best time to buy BTC and some good Altcoins because the risk is very low here but don't buy with leverage. Buy only on spot. And if the weekly close is below $30k then I'm exiting the market and focusing only on short positions.
What do you think about this?
Do you think we get a bounce from here or do you think that it's over for the bulls?
Share your views in the comment section.
If you like this idea then do support it with like and follow.
Thank You!

Pick up that COIN when it hits da floorWhen a coin drops it is merely instinctual to pick it right up, thats money we're talking about, can't leave it on the floor...
Using a term I coined, harmonic wolfekraft, I have obtained the following scenario for COIN.
Summary
- Look for a bounce around 135 this week (4/18-4/20 range most likely). The bounce zone is 130-140. If it drops below that we might have a bigger problem on our hands and it could drop as low as 92. More likely to bounce in zone though.
- Initial target of 166 by around 4/25 (before the Apr 29 expiry)
- Intermediate target of 227 -240 by mid-June (the 227 is actually possible by 6/2 )
- Max Target by 6/24 is 350s - this is theoretically possible, but not statistically plausible... the time-series adj. target by 6/24 is 288.
Explaination :
- The bigger picture is that COIN is working toward completing a larger bearish harmonic, with the X at its ATH right after its IPO, the C is TBD but I used logic from the nested smaller harmonics within, levels from wolfe waves, proprietary control charts, and MMM by how options are currently priced to determine a bounce zone/bottom likely in the 130-140 range (worth watching closely this week).
- Within the AB of the larger developing harmonic, COIN completed a nested bearish Crab within a bearish deep crab back on 5/12/'21 - 11/9/'21. From there it started downside to the larger C.
- There is a new nested bearish harmonic development that aligns with a bottoming around 135. A bounce from around 135 would setup for a potential completion of a nested Bearish A Butterfly within a slightly larger Bearish A Butterfly, and interestingly, their D would form right at the intermediate targets I am getting using wolfe-wave EPA-ETA off the 1-4 resistance. These same levels are also showing up as critical levels in a stability monitoring algo I created using control charts and robust rando cut forest. Essentially, below 135 in a weeks time would make COINs level a statistical outlier with over 90% probability of explosive bounce.
- looking at the MMM for Apr 22 the range is 135 -160 which aligns with bounce zone and point bounce level. The MMM for Apr 29 is priced for 130-165 - the initial target/time to target I am getting from using the minor wolfe wave (blue) in chart is 166. I do love this setup. Note the relatively huge wolfe wave buy signal that just occured (bottom panel (wws)); at smaller time frames (5-15 min), there are trace buy signals starting to show up which indicates bounce is near.
- finally, the intermediate targets using the major wolfe wave 1-4 projection (grey in chart) are, indeed, statistically plausible: fitting a time series model to COIN, an optimal selection is ARIMA(2,1,2) w/ p = 0.42. The upper 80-95% Prediction Interval on 6/2 (223-263) spans the intermediate target range of 227-240. The adjusted target by 6/24 of 288 is the 95% PI.. although such a move would be kinda crazy, it could occur in a scenario where BTC explodes and COIN follows and runs to meet its 1-4 projection prior to ETA (not impossible, but not expected TBH).
I am expecting a bounce to initial target and then a continuation on that momentum to the intermediate target range and am considering the following play (FOR THE CURIOUS, OBVIOUSLY NOT FINANCIAL ADVICE):
COIN May 13 160 calls IF it bounces at or before 135 this week
COIN June 17 185 calls IF it bounces at or before 135 this week
Bless you all,
The Alpinist

harmonics showing daily bounce attemptid call it 68/32 that we have a daily bounce attempt if we hold these lows. id look for a lower weekly high, and some additional bearish activity going into this week.
weve had a good rundown toward support that did break lower on the real body of futures and cause momentum toward backwardation. 5-6 weeks of red usually calls for a countertrend rally and elliott wave scenario is playing out correctively. this is why im sticking to the plain red path in the middle.

PYPLPaypal major collapse, could be making a massive weekly head and shoulders.
Currently though bouncing off a weekly double bottom.
Outlook is some more chop into a bounce, beginning the right shoulder.
However, might just start rallying from here. Also not sold that a right shoulder would complete, more of a bounce higher from this level trade.

BITCOIN BREAKOUT BOUNCE off bottom support channel! HUGE APECOINBITCOIN BREAKOUT BOUNCE off bottom support channel! HUGE APECOIN
BITCOIN HEADING TO 40k
if it breaks 40k i see 42k-45k
50-52k if it doesnt reject 45k
APECOIN IS GOING PARABOLIC!
BREAKOUT
APECOIN $30 + Target Price

Big Bounce Incoming Possibly!!!
Hey Guys,
With the major bearish sentiment around I believe this has opened a great opportunity if you look at the data and patterns closely. DXY is now gone parabolic into extreme overbought conditions as people dump shares and hold US dollars, this acting as a double wamy against the overall market. But it is all in anticipation for the FOMOC and interest rate decision and people are betting on the at least a .5% rate hike with a possible another one to be confirm for june. Now if you step back from the bearish out look and see that it means the upside potential rises if everything thinks this way you might see some interesting points to be made for a Bull bounce. GDP figures have come out and they are down 1.4% it would be political suicide to slow the economy down more then it is because that will guarantee a recession and the blame to solely be on them. So with that in mind I believe we could see only a .25% raise and at most the .50% meaning a more dovish fed to try and keep us out of recession. This would in turn send markets higher as a more bullish outlook and as people buy stocks back the DXY (USD) will fall back to normal levels. Looking technically at the charts we have MAJOR bullish divergence on the RSI on the US100 and S&P with the AUD/USD just above major support with an engulfing bullish candle. So I'm personally Buying Citi mini warrants AUD/USD with .69c as my stoploss with a target at .75c.
Image above is the DXY showing overbought
Image below is SPX e mini showing divergence

Will Apple Bounce Off The Branch Or Fall From It?Will Apple Bounce Off The Branch Or Fall From It?
Apple ( NASDAQ:AAPL )bounced off of its "branch" or trendline four times on the daily timeframe! It would be nice to see a bounce from the "branch" for a fifth subsequent time. 3 out of the four times APPL bounced, it was trading above the 200 MA! The fact that it bounced a fourth time from the same branch is significant because it was trading under the 200 MA. In my opinion, a candle would need to form under the branch to take Apple to the downside. The formation of a candle under the branch would give us another strong area of confluence. At the point, we could say, "Apple feel from the branch!"
Take a look at the Apple branch and ask yourself, "Will apple bounce off the branch or fall from it?"
Peace & Prosperity,
Al

APE longdon't usually post top tier shitcoins here but worth a long at this area.
-20% on the day, hit off 0.618 on the pitch fan, why the hell not.
worth even a small long considering the volume on exchanges atm for this coin and a bounce thats bound to happen. keep your stops tight and happy trading folks.
more of a gamble than anything else so take this as you will
pitchfan pivots incase anyone wants them
#1 9.5280 - 20
#2 15.5845 - 63
#3 10.5000 - 121

ETH retested and bounced,Ethereum has bounced and retested from the symmetrical trend line, hope to see 4000 in coming weeks

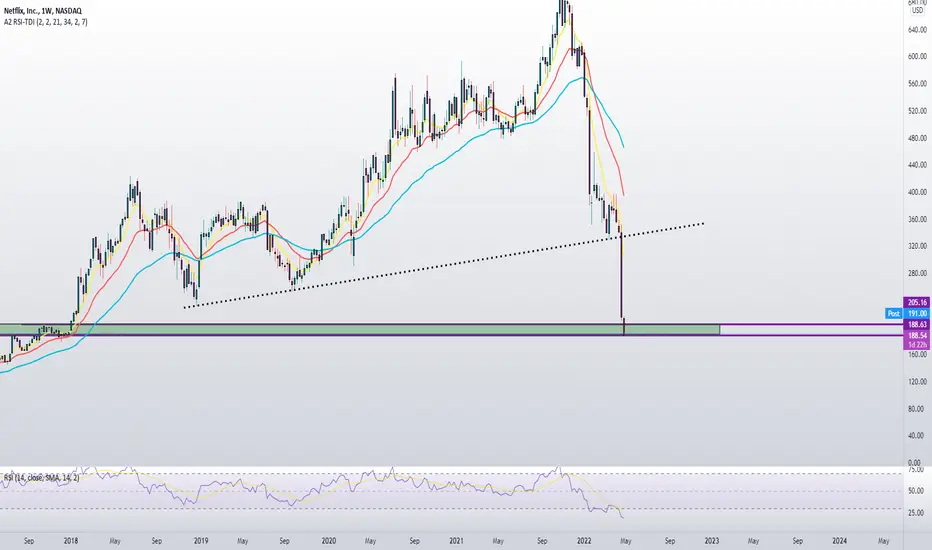
NFLX bounce?NFLX sitting at long term support after reporting ERs,
Could see a bounce from here to retest the trendline.
Great R:R with SL right below support.
ALTPERP INDEX UPDATE! A RELIEF BOUNCE INCOMING FOR ALTS!!Hello everyone, if you like the idea, do not forget to support with a like and follow.
Welcome to this ALTPERP INDEX update. ALTPERP INDEX is basically used for perpetual coins (Futures trade).
ALTPERP is forming a falling wedge like structure in 4hr time frame. Also, holding an important support level (green box) so far. Currently, it is bouncing from the lower trendline and showing some strength. Expecting a good bounce in altcoins soon.
I'll also sharing some good profitable altcoins setup soon. But remember do not trade without a stop loss and do not use high leverage.
If you like this idea then do support it with like and follow.
Also, share your views in the comment section.
Thank You!

Bounce from Lower Band of the ChannelAlthough Bitcoin does not currently bounce from the lower band of its newly formed channel, it seems that it will exhibit a steady rise towards the upper band of the channel in the short term. Although the daily and weekly stochastic relative strength index shows a negative stance, the 1-hour and 4-hour stochastic relative strength indices seem to indicate the expected rise in the short term. We are currently stubborn above the 200 hourly simple moving average and h/200ma will support us if we hold this level.

SHOP: BOUNCE ZONESHOP (Shopify) has dropped 70% since November 2021.
Yes we can drop more. However I like the risk reward ratio here as the price is now sitting on a trend line (in green) connecting the lows of Nov 2019, March 2020 and March 2022.
The weekly RSI is slightly oversold and we're starting to see a bullish divergence .
Bonds are bouncing already, which could support a bounce in growth stocks .
I'm a buyer at this level for a possible bounce to 640. I can cut my position quickly and without too much damage if I'm wrong.
If we drop more, the next levels are between 437 and 413...
Trade safe.

Ignore the Noise... Recognize a Buying OpportunityAt the end of the day as long as this stays above 233.68 its a Buy.
- Bigger picture is NFLX can complete a Running Flat C wave if it stays above 233.68 (i.e. does not retrace more than 100% of wave B
- The 5 count of wave C has formed a wolfe wave with the equilibrium point slightly above where it looks like it will open today (i.e. supply = demand near 272)
- look for a bounce at open to test the equilibrium level:
If it breaks above it expect a run further to try and re-enter the wolfe channel [ Initial target 307 by May 2nd ]
If initial target is reached expect that momentum to carry it higher to test upper channel [ Intermediate Target 335 by May 24 ]
A breakout from wolfe channel will give it the setup to run Target = 475 by July 22nd . If this materializes I do not expect it to complete gap fill to 500s without undergoing a minor correction or a least consolidation first.
*** If NFLX has a sustained break below 233.68 it opens up a short opportunity - will re-eval. based on how it behaves in the 234-272 range. But subscribers, I assure you, have nothing to do with this. NOT FINANCIAL ADVICE.
Have a blessed day,
The Alpinist

BTCUSD, Neutral position. Intraday strategy, Pivot bounce!Hey there, it seems BTCUSD is in a price range, it is having a pivot bounce with not enough strength to show an uptrend.
Let's take a look at the intraday strategy's results. We should be ready as soon the prices break those bands, either to go short or long trade.
R2 41,471.38
R1 41,012.98
PP 40,391.60
S1 39,933.20
S2 39,311.82
S3 38,232.04

BTC SIDEWAY IN THE LONG WEEKEND
Hello Everyone!!!
I just checked a very interesting scenario in the Hourly Time Frame. Seems like we moving in an Ascending Channel/Bearish Flag Pattern, and I think we're going to have a big move soon, perhaps in the New York Session even though it's long weekend.
Please leave me your thought about my opinion, and if you guys like to, maybe I will create YouTube channel for English language.
**BTC Idea**
This is not change my Daily perspective on BTC, recently I posted about BTC Moon Cycle, and so far almost in every Full Moon Phase, we had a nice rally.
But, still we can't ignore the lower time frame, and as a Trader, there's so many opportunity to look out on the lower timeframe.
In the 1-Hour Timeframe, right now I see a potential SHORT Opportunity, only if BTC can Breakdown very impulsive against the Trendline here.
A couple things that make me think that, this is a good opportunity to SHORT is a potential scenario for Dead Cat Bounce Pattern and also Head & Shoulders Pattern.
Although H&S is more preferable in the Uptrend, because of the characteristic of H&S that changing the Direction of the market.
Still, I'm considering the same situation right here, and looking the recent Resistance as potential Lower High for BTC price movement.
This is not a financial advice, it's just my humble opinion and I could be wrong somehow.
I also have the alternative Scenario in case you guys want to see.
Good luck for you guys!!
And I'll be waiting for your reply on your thoughts.
God Bless and Cheers!!!
www.tradingview.com
