BTC what's about to happenThe momentum waves are building for another big run up. I'm predicting we will be paying a visit to mid 70k within the next week
Bounce

After over a day of retracement What is next for BTCWatch closely as we have a descending trend line forming that could lead to an EPIC bounce! Don't buy the initial break out (IMO) wait for the retest and resumption! Good luck out there and Have a Terrific Taco Tuesday!

$ORN: If it's gonna bounce... it's gonna be here.Price action for $ORN has just touched that lower .5 pitchfork prong. As well as a perfect confluence for the previous pennant's top trend line. I think there's quite a bit of FUD in the market right now. We're in a disbelief area of the market cycle... "This is it, it's over, we're going back down now."
Staying patient and stacking more of these massively bullish, high potential projects is the move. Do you have less that 1k $ORN? Fix that asap.

MP Watching for Breakout at $41Narrow range today, minor down tomorrow and breakout possible if the market finally goes up on stimulus news.
If stim won't buoy the market, it'll get even uglier soon.
Interesting company with a 17% share of the worlds rare earth metals used to create magnets for electric motors.
Huge upside as the world electrifies.
*NOT FINANCIAL ADVICE - NOT A FINANCIAL ADVISOR*

$PTON Big Doji candlestick suggests Bounce to 130-132 Over sold indicators supporting Friday Big Doji candlestick around 105 . Above 98 Short-term suggests bounce to 130-32 then consolidation or other pullback lower than 93. Battle ground around 123
Resistances: 115.2 - 123.4 - 130-132
Supports: 98 - 93 - 85 Stops for longs.

Good chance to short DOLLAR We can notice very interesting point 92.5 On DXY number 92.5 was respected many times from both sides of zone and act as support/rezistance, even FIBO 61,8 level is in our side to bounce down and short with good 2.5 : 1 risk. :D RSI is also very close to overbought.

TSLA Weekly OverviewA very simple count...
we could see a bounce to 800+ followed by another down move, to get to 500.
I would sell at 800 and buy and 500 or less.

PLTR Bounce on Support with Bullish MACD crossoverI will be watching for a strong bounce on support here in which case I think we will see some nice quick upside to $25.50+. However, if support is broken I expect a significant drop and a retest of support at 21.10 level that we can clearly see on the 2 hour chart.

BYND - Bounce soon?BYND watching for a bounce from here.
Perfect touch of the weekly demand zone and hard bounce on 3/5, leaving a hammer candle to close Friday.
Also filled daily gap at same level.
Stoch oversold.
Also Held the important $135 level.
27 days down this reversal would be 'on time'
A Large long fib setup first traded in November 2020 with target at 232.74 and is still intact.
Formed weekly demand zone after double bottom and bounced.
BYND announced a partnership with Pepsi, massive gap up and then the sold it all the way
back down to the weekly supply zone, with earnings along the way.
Ideally looking for a gap up monday 3/8 to confirm

QQQ very clear 5 waves down - The 'A' wave may be finished QQQ 5 waves down - the fib extensions measure out cleanly.
Because it appears there have been 5 waves down this implies it is the A wave of an ABC correction.
Now will watch for the B wave up dead cat bounce, before the c wave finishes it and could bring it lower.
There is another more bearish possible count here but wont post that just yet. If this ABC is the pattern that has started it, could play out something like this.
Many other tickers have this similar 5 wave structure down.
Look at the perfect bounce on this monthly candle level which was the monthly open for september 2020.
Volume climax.
Getting into oversold areas.
VIX never really spiked on this first drop...
Bigger fib extension long setup (yellow and red lines) could take this to the green target at 362 as long as the red line holds.
The more bearish elliott wave count would invalidate the fib setup.

TSLA very clear 5 waves down - The 'A' wave may be finished TSLA very clear 5 waves down and measurement levels are clean.
5 waves down is corrective and has 2 possible outcomes, this being the less bearish of the 2 and i lean towards this more conservative count for now.
It looks like tsla has put in an A wave of an ABC correction, and its very possible the A wave down is done.
Looking for a B wave bounce to start soon.
Other tickers as well as the QQQ have very similar 5 waves down.
Price bounced at the 50% fib of an extension fib setup. The longer term target for this fib setup is 1068 as long as 465 doesnt break.
Trendline Support.
Volume climax at lows.
RSI and Stoch oversold.
Watching for the start of the B wave up. Resistance into recent supply levels would make sense possibly up to 840.

$BTC: 200 ema on the 4 hour = Potential repeat?I love the 4 hour chart. Last time bitcoin fought back above the 200 ema and then retested it and successfully closed above? We saw a pretty nice run. I get the sense that this $BTC pa is just some coiling of the spring, a consolidation of momentum as we load up for the next run. Obviously things can go south from here for sure. I wouldn't be surprised to see a second break below, and another "double bottom" style pattern form. But if this 200 holds, we might see some nice push to up around 70k.

$SOL Descending ChannelDouble bottom support would be a good entry. Still more downside but keep on your watch list. Set an alert so you catch the bounce

GET READY!!NIO will hit the EMA 200 whilst also retracing to its former trendline from may 2020. I expect a massive run-up from this point.

ADA USDT pair is coiling! Prepare to get in if you aren't!Not only is this chart showing an amazing breakout in the works, but the fundamentals behind ADA right now are too impressive to skip over! DYOR and look at how amazing ADA is.. you will not regret getting on this ride!

AUDUSD SETUP 1:5Identified a clear bullish trend and key support and resistance levels.
Currently prices have bounced off support level but there is still time to get an entry before an impulse move to the resistance.

NZDUSD SETUP 1:5Identified a clear bullish trend and key support and resistance levels.
Although price has moved off the support, previous price actions show that it is possible for prices to drop back down before an impulse push.

Weekly Outlook! 3/1 - 3/5Here we go over last weeks video and we take a look at a few things we are keeping an eye on for the coming week!

Can NVDA Hold Trend?NVDA failed to hold above $600 and didnt breach the $610 target for entry. With the market mid-pull back and tech weaker than industrials and financials, Im on the sidelines waiting to see buyers step in it and hold above trend support.

btc bitcoin. hunt before drop. an ideajust seems like it makes sense to me. I think we go and hit daily H3 and Pivot. Then we maybe fall back. Wider cpr. Using camarilla pivots. Lets see the reaction on L3

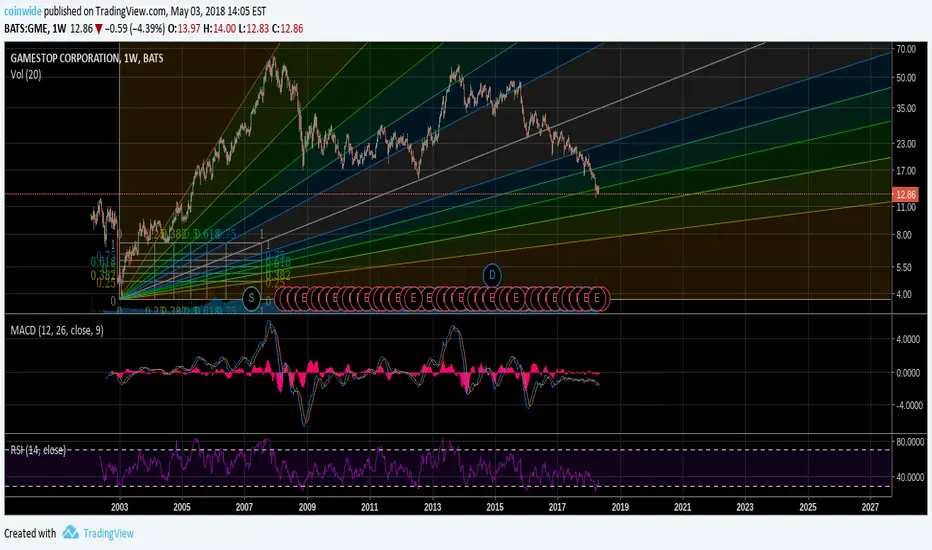
Gamestop at reversal pointEvery 3rd time RSI got below 30 we saw a good bounce
Fib line 0.50 fits bounce too up to 0.75
in the meantime while holding it pays 0.38 USD per share every 3 months
this is not a trading advice - just for my review
GBP SETUP 1:6A general bullish trend has formed on the H4 timeframe.
The trend line was adjusted slightly to connect as many major bounce points as possible.
The slight dip below the trend line was regarded as an anomaly as it did not invalidate the uptrend.
Looking to go long after the next bounce which could possibly happen within the next 2 trading days.

$TSLA - bounce followed by deeper correctionThis is the chart to watch.
If this is the completion of the primary cycle that started in summer of 2019 then we can expect to see a bounce in the near term. This would correspond with a new mini bull run in the overall market that will last till april or may. followed by a larger correction/crash where tesla comes back to 380-480. This will be my buy zone for long term portfolio.
For short term, you could take a chance here for the bounce play to $765
