LINK long swing & pivot testCamarilla + CPR pivots. (The coming monthly pivot is also at 11+) opportunity perhaps
Bounce


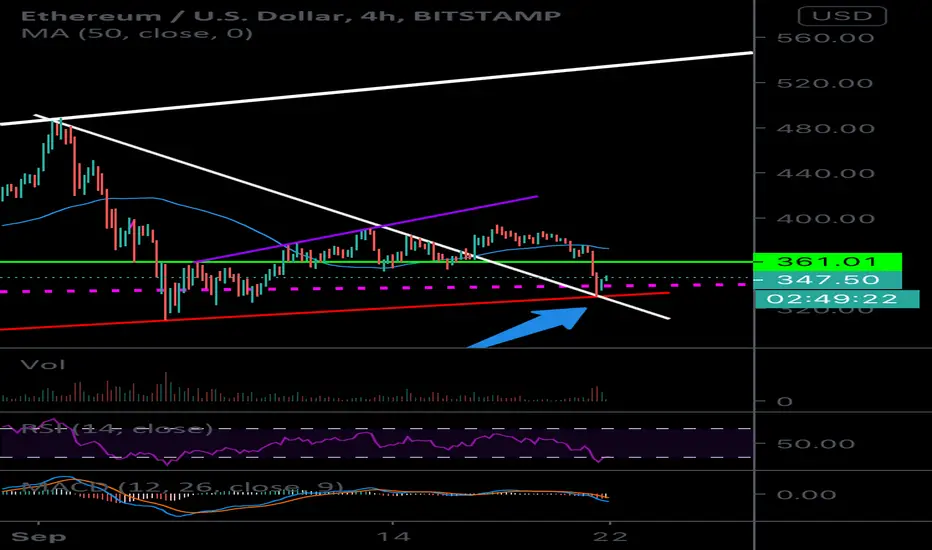
Crypto bounceI really love how perfect these bounces are off my trend lines. As you can see ethereum has bounced up over the white downward trendline ( wedge resistance) and then bounced perfectly on top hopefully turning it into support.


KSMBTC bounce on daily support 🦐KSMBTC bounce on daily support and now the price is forming a bull flag
IF the price will break the bull flag According to Plancton's strategy, we can set a nice order
–––––
Follow the Shrimp 🦐
Keep in mind.
🟣 Purple structure -> Monthly structure.
🔴 Red structure -> Weekly structure.
🔵 Blue structure -> Daily structure.
🟡 Yellow structure -> 4h structure.
Here is the Plancton0618 technical analysis, please comment below if you have any question.
The ENTRY in the market will be taken only if the condition of Plancton0618 strategy will trigger.

EURUSD LONGEURUSD is moving in a channel on the daily. Taking this long from the bottom of that channel. bullish divergence on 4H

2day comparison. to recent fall and now. IndicatorsI recently posted a much more bearish outlook for 4day and I think weekly as well. However, I think the 1-2day looks like a potential bottoming point perhaps. I am posting both because I think there is still time if bulls acted and turn the larger timeframes and weekly occilators around late or last moment it could reach back up for maybe at least a higher retest. some of the signals we have now are the near exact opposite of the same ones that made me so bearish around 12k. It is hard to know or tell. so keep eyes open on all things

SET50 what are you thinking??Hi fellow traders! Hope we will all get a positive answer, to yesterdays bounce; are you done with going lower?
Yesterday, SET50 bounced of the Panic Gap Island's lows, and will it be enough to break the negative trend and start the second run to the north, from March lows.
Or if this was only to trap the buyers, in the bigger negative trend further down south.
Happy Trading and Never Forget To Protect Your Losses!

BTCUSDT - Short the Retest / 15% GAINS !!!-NEW author on TradingView
-2+ years experience in markets
-Professional chart break downs
-Supply/Demand Zones
-Key S/R levels
-No junk on my charts
-Frequent updates
-Covering crypto/US stocks
BTCUSDT 4h: BEST level to SHORT 15% gains (SL/TP)(NEW)
IMPORTANT NOTE: speculative setup. do your own
due dill. use STOP LOSS. don't overleverage.
🔸 Summary and potential trade setup
::: BTCUSDT 4h chart review / outlook
::: small bounce possible right now
::: likely setting up for a bigger move downwards by rejecting major resistance 11100-11500 USD
::: however short-term I recommend to focus
::: on selling HIGH from confirmed resistance
::: key resistance: 1125-1400 USD
::: key support level: 8925 USD
::: recommended strategy: SHORT IT 1125-11350 USD
::: SL 11600USD TP 8930 USD
::: good luck traders

BTC. sometimes you gotta go for itcoming to daily pivot and support. intested weekly pivot at 10.7. if we bounce and broke pivot it could turn into a bigger move. worth the risk with support area so near. because most untested pivots at least get tested


weekly close BTC pivot retracement and minor bounce likely. we have a new weekly pivot estimated to be coming in around 10.6ish. if no new highs or lows are made this level will remain (solid white lines are estimated next weekly range. the dashed line is estimated coming central pivot. and those when gone untested... always get tested. so if you are looking to short. wait for that. if wanting to scalp long. try to get in lowest as possible and later in the day you could

AUDUSD Long Bounce TradeAUDUSD has pulled back to strong horizontal.
This will be a great setup to go long early next week if price creates a bullish price pattern on the lower time frames at the daily horizontal.
Strategy is a simple breakout and bounce

BITCOIN UPDATE. Camarilla. monthly lvls. Daily chartfor the next BIG move. if price breaks and closes above L3. long to Pivot + H3 and see if it takes out H4 for moon. If it breaks Under L4 (in the month) the targets would be L5 (safer target to aim for) and L6 (which is coincidentally the yearly pivot point)

The adventures of Wirecard CEO, Bulls, and regulatorsAh, cheap and great investment Wirecard just made a new low.
Now is a perfect time to tell their story.
Massive hordes of "investors" blindly piled on this hyped ponzi based on lies.
And then they laughed at the bears and said they were mad they missed out.
And then the CEO went to jail and it went to zero.
The end.
Thank you for playing.
They say investing should be boring. So wrong. This makes it all worth it.
It is amazing how many independant or amateur investors have been buying and are still interested in buying.
It's always the same with lunatics that think bears are some illuminati or flat earth group making conspiracy theories to drop the price of a perfectly legit company.
Here is one comment that aged well:
Sep 5, 2019
"The #Wirecard $WID bears are doomed! Finally, justice after so many lies."
Entire timeline here:
www.ft.com
Crazy story xd
www.fudzilla.com
Remember the dead stock bounce strategy?


Inverted Chart: The US-Dollar a dead cat ?Sometimes inverting the scale gives an interesting view on a chart.
Looks like there is a perfect "dead cat bounce" pattern on the inverted monthly XAU/USD chart.
What do you think? Will the dollar recover? Or is it doomed?

GBPUSD - Weekly Overview and H1-Entry - Easy ExplanedHi Traders!
The market is in a Longterm Downtrend (weekly).
This time, instead of beginning with the daily timeframe, we'll begin with the weekly timeframe.
Here is it:
Here you can see three main areas, which affects the market bearish :
The weekly Resistance,
the weekly descending Trendline and
the 200 Exponential Moving Average.
]/list}
You see, there are many things which come together at this moment.
Now we move to the Daily:
We want to show you something, that's why the chart is zoomed in.
The price broke out of the weekly Trendline with one green candle.
The next candle closed bearish and even below the low of the previous candle.
You call this Pattern the "Engulfing Pattern" and the situation is called "False Break Setup".
Let's move further to the H4-Timeframe:
Here you can see the market is in a sidewards market.
At this moment it reaches the orange Supply and Demand Area.
Finally, we move to the Entry Timeframe:
It reaches the orange Sell Area.
The SL is far away from it and the Take Profit is at the next Support.
We recommend to trade the market with a confirmation.
Thanks and successful Trading :)!

Spirit Aerosystems a play or not?Spirit Aerosystems isn't spirit airlines. It's own by boeing and makes parts for boeing and inovates in the aerospace sector and from its website is also into space with a virgin galactic partnership. Now I've been watching this for awhile, yet I'm still not sure if i should go in but heres some levels I'm looking at.
Current findings
-Their earnings is they are losing money, yet they are tied into boeing and if boeing isn't making money they aren't either
-They have ties to the space sector, which comparing it to the other space stocks, they are underperforming
-They pay divends, so you could become a long term holder and get paid while hoping this company can recover after COVID
-Boeing has had a 34% drop in its price around June, yet SPR has had about a 50% drop giving this stock a potentional upside of 20% to go side by side with boeing. This reflects that SPR is struggling and can be shown as this company wants to layoff over 1400 people. From a quick search they have just over 5k people working from them. Big hit on their workforce short term.
Buy In
-Now I've market that you may take a position at this level with a 20% bounce back, yet I'll be watching for two key levels.
1: Sub 20 dollars since to be a fair value and has gone down as low as 16.70 (with dropping lower, yet springing back). Sub 20 dollar since like a good start if you want to dip your toes in.
2: An optmistic bull and don't mind gambling is taking a position in when it gets too 24.12-24.5 hoping for a breakout. Now this same level could be profit takers, yet around May 27th when it hit this level it broke out and giving a $12 high profit per a share. Roughly 30% return.
Final Thoughts
Its interesting stock and will just wait if it goes sub 20 and you could be worried if boeing would cut this company to cut boeing's loses, yet thats the doom mindset and don't think that will happen. I'll remain Neutral on this stock
