GBPJPY I Risky short from resistance zone 80-100 PipsWelcome back! Let me know your thoughts in the comments!
**GBPJPY - Listen to video!
We recommend that you keep this pair on your watchlist and enter when the entry criteria of your strategy is met.
Please support this idea with a LIKE and COMMENT if you find it useful and Click "Follow" on our profile if you'd like these trade ideas delivered straight to your email in the future.
Thanks for your continued support!
Brian & Kenya Horton, BK Forex Academy
Bounce

TLTLong on TLT here.. I think we could see 99-102 fairly soon with a huge reversal in the coming days.
100 lvl broke through and sold hard, I believe this will be a fake breakdown and if anything could be bottoming or reversing soon.

BTC: EXPECTING SOME GREENERY TILL THE NEXT FOMC IN NOVEMBER!!Hello everyone, if you like the idea, do not forget to support it with a like and follow.
Welcome to this quick BTC update.
BTC is still holding above the $19k level as you see in the chart, BTC is holding the purple line support very well so far. So I'm expecting some green days from here. We might see a good and slow pump up to $20k-$21k from here.
There is not any Fed event in the next few days. The next FOMC meeting will be held on the 2nd of November so till then we might see a good relief rally in BTC and Alts as well.
What do you think about this?
Do you also think that we see some good bounce in the next few days in the market or do you think that we going for a new low from here?
Share your views in the comment section.
If you like this idea then do support it with like and follow.
Thank You!

GBPJPY Retest the resistance area +250 pipsWelcome back! Let me know your thoughts in the comments!
**GBPJPY - Listen to video!
We recommend that you keep this pair on your watchlist and enter when the entry criteria of your strategy is met.
Please support this idea with a LIKE and COMMENT if you find it useful and Click "Follow" on our profile if you'd like these trade ideas delivered straight to your email in the future.
Thanks for your continued support!
Brian & Kenya Horton, BK Forex Academy

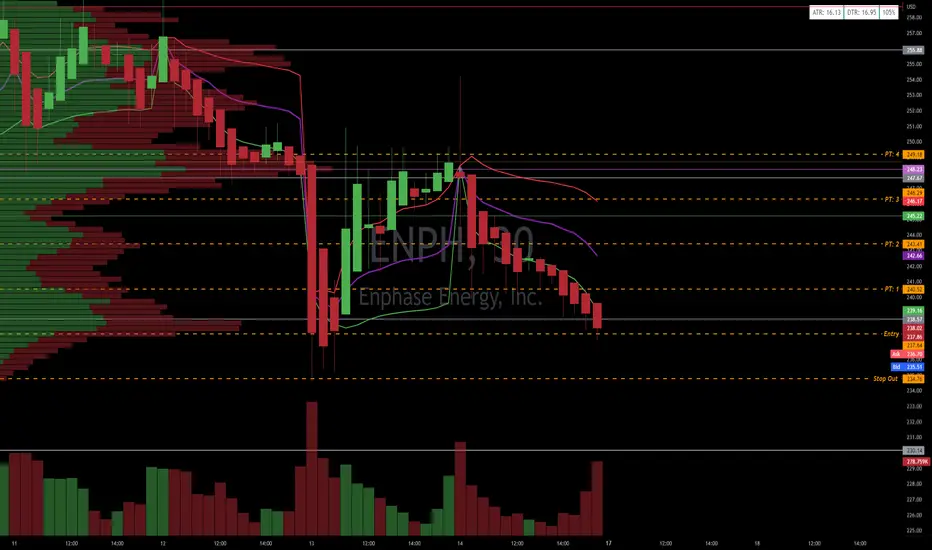
ENPH: Pull Back + Bounce + Active Level RetestBig Picture:
Earnings coming up 10/25/22. Had good Earnings last time. Coming back into aggressive buying from July and last earrings period. (Will the buyers want to fight for the price a little bit now before earnings?)
--------------------------------------------------------------------------------------------------------------------------------------------------------------------------------------------------------------------------------------------------------------
Setups:
07/20/22 - 07/27/22: ENPH broke out out from a volume accumulation + Aggressive Buying
08/02/22 - 09/06/22 Volume Accumulation
09/15/22 - 09/21/22 Volume Accumulation
09/22/22 Aggressive Selling
09/26/22 - 10/04/22 Volume Accumulation
10/05/22 - 10/07/22: Aggressive Selling
--------------------------------------------------------------------------------------------------------------------------------------------------------------------------------------------------------------------------------------------------------------
Intraday Technical:
ATR: 16.13
ATR (200Day): 14.42
DTR: 16.95
%: 105.00%
RVOL: 0.82
Rel Vol (Finviz): 0.75
RSI (14 Day): 30.64
RSI (200 Day): 52.51
Volume: 2,884,739
AvgV: 3.83M
Ch% (FINVIZ): -4.35%
FS%: 3.31%
Shs Outstanding: 135.20M
Shs Float: 132.68M
Inst Own: 75.10%
2 Day VWAP: 244.6
Weekly VWAP: 250.33
Monthly VWAP: 263.01
--------------------------------------------------------------------------------------------------------------------------------------------------------------------------------------------------------------------------------------------------------------
10/13/22
Open: 248.73
HOD: 254.21
LOD: 237.26
Close: 244.59
--------------------------------------------------------------------------------------------------------------------------------------------------------------------------------------------------------------------------------------------------------------
Key Areas of Support:
216.82
230.14
245.49
--------------------------------------------------------------------------------------------------------------------------------------------------------------------------------------------------------------------------------------------------------------
Key areas of Resistance:
257.08
283.43
295.02
315.29
Inflection Point:
245.35
--------------------------------------------------------------------------------------------------------------------------------------------------------------------------------------------------------------------------------------------------------------
Trade Plan:
Look for a pull back to 237.64
If pulls back to 237.64 and see absorption then start long.
If blow through VWAP then Cover and look to add back in a pull back. If add in pull back this is a new trade and make sure to cover this new add at the next neck line.
If hits PT 2 then look for a pull back with absorption and add. Then sell this Add right into the above neckline.
Take original trade to PT 3 and sell
Risk/Reward: 20% of ATR $2.88
Entry: $237.64
Stop $234.76
Exit: $249.18
PT 1: $240.52
PT 2: $243.41
PT 3: $246.29
PT: 4 $249.18
QIUSDT - Potential Double BottomQIUSDT has just touched its all time low for the 2nd time, setting us up with a potential double bottom. If Bitcoin holds steady and QIUSDT can hold support at 850 - 860 sats we could see a decent bounce from here.

Bounce then more chop $SPXSPX seems like a decent area to buy some into end of year holidays.
Obviously market could continue to nuke with some sort of event.
NO idea after end of year

vix should rebound, but continue fallingthe hourly is looking oversold, so id imagine we have some rebound in vix, but the overall daily trend is threatening to confirm return to bear vix while broader market bounces. if we get spx, ndx making new lows of day simultaneously with multiple sectors like xlf, soxx in the red a return to bull vix could happen (highlighted areas where nadaraya watson envelope turns up). solid horizontals are targets, dashed line is pivot.

TTM: BIG SUPPORT on watchTTM (Tata Motors), Indian conglomerate.
TTM in a clear downtrend. However, reversal or attempt for reversal has to start somewhere.
Some positives signs:
TTM is now sitting on a huge support which is the upper line of the downtrend channel and a historical horizontal line at $24.27.
The downtrend channel was broken, which is a positive sign for the bulls, now we are retesting the top of the channel.
RSI daily is oversold.
For Ichimoku aficionados the lagging span also bounced on the horizontal support, so far confirming the bounce. And the price is sitting on the top of the cloud on the monthly chart.
Will the support hold? No one knows. But the risk vs reward is quiet good here for a long trade with a stop at $24 for minimum loss in case it goes against you.
I'm long for a swing trade.
Text major support is around $23.44.
Trade safe.

NIVIDIA - Long Trade Setup - Near Key Support, Watch For BounceHello Traders, here is a long trade idea for NIVIDIA.
The market is oversold and overdue for a bounce. Yes, there is the potential that price heads lower but with the DXY approaching resistance there is a strong probability that we will see a bounce in the market this week.
NIVIDIA is approaching a key support level at $119, this is an excellent entry for a long trade.
Take profit #1 is at $130
TP #2: $143
For a stop loss: Personally I typically average down in trades like this so please use whatever risk management strategies that you typically use that suits you.
After we bounce there will likely be a rather large sell off so make sure that you don't get trapped in the trade.
Thanks everyone and best of luck trading!

SPY: Very bearish! What could make it bounce?• So far, SPY is heading to the next support at $360.69, indicating we have a few more bucks to drop, and there’s no technical evidence pointing to a reversal. In the daily chart, at least, there’s not a single bullish pattern yet;
• We see some open gaps (yellow squares), and they will become targets, in the future, if (and only if) SPY triggers a reaction;
• In the 1h chart we see a possible bullish structure, a Double Bottom chart pattern. Keep in mind, this pattern wasn’t triggered yet, and maybe SPY won’t trigger it at all, but it is important to keep in mind a scenario where it’ll break the $370.21;
• By triggering this Double Bottom, SPY would bounce back up to the $388 (its next target);
• In my view, I would prefer to see it bouncing after a retest of the $360, but this could work too;
• This wouldn’t be a true bullish reversal sign, and maybe would be just a Dead Cat Bounce, but could be the beginning of a true mid-term reversal. I’ll keep you guys posted on this.
Remember to follow me for more analysis like this! Keep in touch.

Preparing to catch the falling market knife - short-term tradersIn this video we recap the US stock market price action from last week and game plan for the week ahead.
We break down the 3 possible scenarios the market may take next week and how to plan/structure trades around them.
This video was specifically recorded for short-term tactical traders looking to catch a multi-day bounce, and does not acknowledge/discuss the fact that we are in a longer-term bearish market environment.

Short term predictionThis is the bounce off the first test of -20%ish decline. I expect a +5% move to happen fairly quickly, then a lower retest near Fed announcement, then a slow retrace to roughly -10% from ATH before the next leg down.

S&P - ES Bouncing At The CenterlineNice how the rules play out here.
ES is bouncing exactly at the Centerline.
This means, there is a high probability that we see at least a pullback to the North if we hold this level on the close.
Let's observe.

SPY Analysis 9/23SPY has finished its H&S breakout. Our target was 371 for EOW and Friday morning we are currently sitting at 369 premarket. I expect today to be a bounce day but I am still bearish long term. Looking for calls above 371 PT is 376 and 380 for today

btc fullbounce mode but running out of steamif we ride the top of this envelope higher we could visit 201, if we reject from those levels and drop further btcusd is still in a bear trend.

sells should climax along base of envelopewere at the lower end of this nadaraya watson envelope, and it looks like nasdaq is at least going to pull back to SSS moving average or TRAMA. if we get a buy signal near the lows i think price could follow this path.

CSPR died in January 2021, like RchainHyperinflation during bear market - same marketcap as we had in 20c in August 2021
The team has bad image - team scolding people in Telegram (already deleted), I have screenshot in case people say I am lying
Not listed on any major exchange since listing - hyped up Binance, never came
Still no use case
Slow chain, slow finality - eth2 coming so completely useless
Same team as RChain was also Casper fork - utterly failed
There is heavy selling pressure from validator - in entire bull market it did 10% up maybe then full retrace. I saw it going up by 10-30% many times during autumn 2021, all to retrace. Casperpad was also a scam - but good enough for final double top

BITCOIN DOMINANCE AT MAJOR SUPPORT! BE CAREFUL WITH YOUR ALT BAGHello everyone, if you like the idea, do not forget to support with a like and follow.
Welcome to this Bitcoin Dominance update. Those who don't know, BTC.D works inversely with Altcoins. It means when BTC.D dumps, Alts will pump and when BTC.D pumps, Alts will bleed.
Now let's get to the chart.
Currently, Bitcoin dominance trading below 40 and it is at the major support level in the weekly time frame. Every time dominance comes at this level we have seen a pump and bloodbath in Altcoins.
BTC.D goes below 39.30 level only one time which happens in 2018. This 39-40 range is a very strong support so we see a bounce from here and if it bounce then be ready to see huge dump in Alts.
It's better to stay cautious now.
Invalidation:- Weekly close below 39.30 level.
If you like this idea then do support it with like and follow.
Also, share your views in the comment section.
Thank You!

Another idea worth considering (end game scenario)Fib pull from the top to the bottom of this move:
A strong rejection off of the 0.5 fib is considered to be a dead cat bounce. In this case, the price was not accepted back above and therefor further down side (below 0) is quite possibly on the line.
Check Morpheus, showing us the perfect setup for a short.
A key support / resistance flip level for me would be the 3810 area (give or take a few dollars). Lose that and it's mayhem.

BTC Replaying 2021BTC is doing the same thing it did in September 2021 - Triangled triple bottom on support. Apart from Weekly divergences pointing to 26-27k and indicators exhaustions with room to the upside - this is an additional pattern being re-played.
Today NFP - Expect anything, but for sure a bounce to the upside soon.
Cheers!

ADX bounce?On 0,786 fib, 200sma on 30m, and previous resistance,
The oscillators look nice, good chance for some kind of bounce...
mind the market if entering this...
Tight SL...
Dont expect much...
Trail it with SL up the levels...
Good luck traders

i think tesla oversold is an intraday bounce candidateqqe recently went long tesla, and i think theres something to it if rsi chooses to reverse and cause some squeeze. if we get the volume trade switch back to the bulls on the hourly, this horizontal might hit. theres short long and pivot targets as well as the path i think tsla might take.
