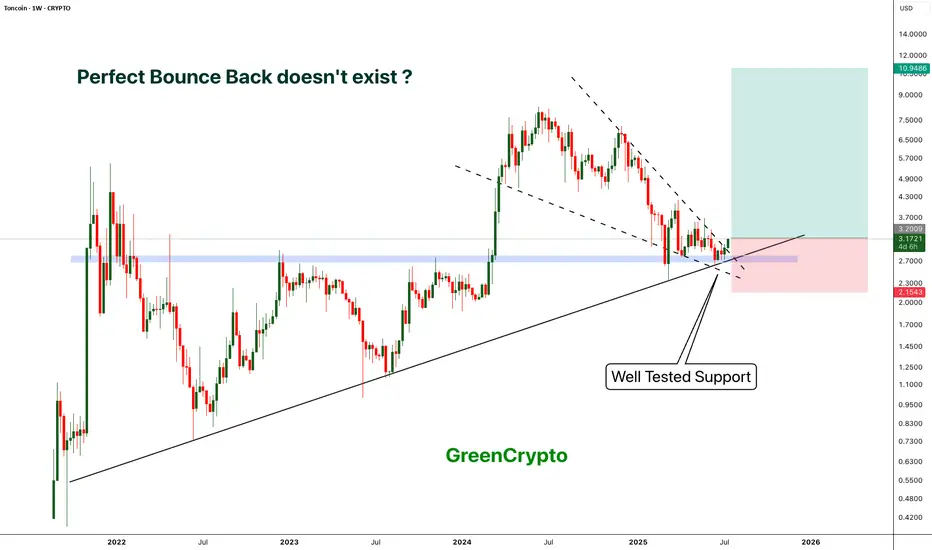
TON - Locked and Loaded for a perfect Reversal- TON is reversing perfectly from its long tested support
- On weekly chart we have clear bounce back and perfect candle.
- This is an excellent opportunity to enter
Entry Price: 3.17
Stop Loss: 2.15
TP1: 4.0796
TP2: 5.2629
TP3: 6.8383
TP4: 8.3298
TP5: 11.0191
Stay tuned for more updates.
Cheers
GreenCrypto
Bounceback
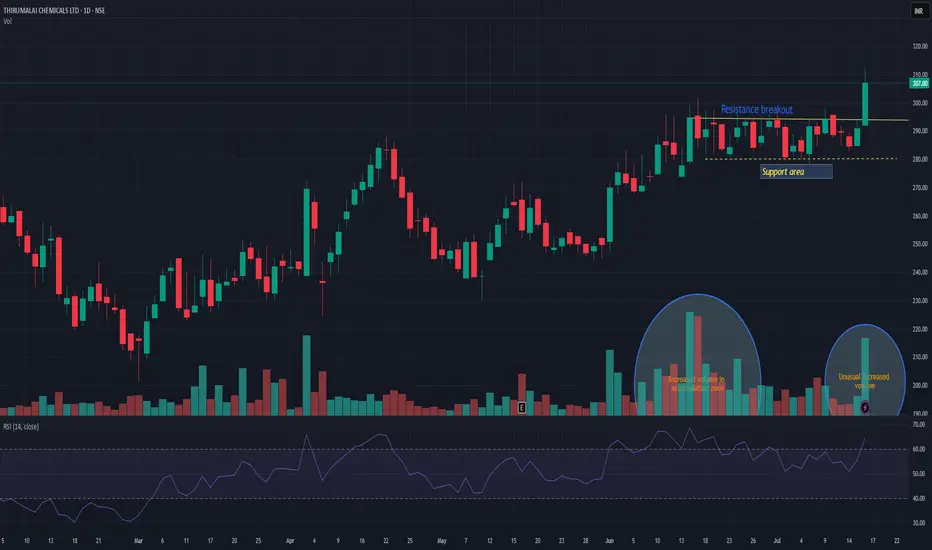
TIRUMALCHMTIRUMALCHM has given resistance breakout with decent volume. Another good thing is unusual volume increased in accumulation zone. Support can be seen near 280 levels. There is high probability that this time it may push the stock in to trend change and may take momentum to the next level. Keep it on radar.
HFCLHFCL showing trendline breakout with higher high pattern. Market participation has also increased since few sessions. Probability of new momentum rally is quite higher. It has also booked highest weekly volume since last 7-8 months.

Bitcoin - 200 EMA is holding Strong#BTC #Analysis
Description
---------------------------------------------------------------
+ Bitcoin has successfully tested the 200 EMA line and rebounded effectively.
+ However, caution is still advised, as the price may revisit the EMA support line.
+ The strong performance of the EMA is a positive indicator, suggesting the bullish trend could persist after a few retests.
---------------------------------------------------------------
Enhance, Trade, Grow
---------------------------------------------------------------
Feel free to share your thoughts and insights. Don't forget to like and follow us for more trading ideas and discussions.
Best Regards,
VectorAlgo

Bitcoin [BTC] - Trading Inside the Channel. Breakout when ?#BTC/USDT #Analysis
Description
---------------------------------------------------------------
+ Bitcoin is currently trading inside the channel and price is around the support zone
+ Price touched support zone multiple times and this is the third touch of the resistance
+ I'm expecting the price to bounce back from this support zone.
+ If the price fails to hold the support then our idea is invalidated.
+ A bounce back from the support of the channel will push the price above 100
Follow the trade details in the chart.
---------------------------------------------------------------
Enhance, Trade, Grow
---------------------------------------------------------------
Feel free to share your thoughts and insights. Don't forget to like and follow us for more trading ideas and discussions.
Best Regards,
VectorAlgo

$ETH Bounces Off Key Support: Reversal Ahead?
Ethereum Weekly Update
Ethereum (ETH) is showing a promising bounce from a significant support zone, ranging between $2,000 and $2,150. This area has acted as a key level of support since mid-2022, and it continues to hold strong. Additionally, this zone aligns with a crucial ascending support line that has supported the price for nearly two years.
On the 3-day chart, ETH has rebounded from a "golden pocket," a technical term that refers to a major support area in the price range of $2,150 to $2,200. Given the confluence of these factors, it's highly likely that Ethereum will maintain support in this range for the near term, although we need more confirmation to signal a full bullish reversal.
Looking at the daily chart, we’ve just seen the first sign of bullish divergence. This occurs when the price makes a higher low while the RSI (Relative Strength Index) does the same, indicating growing bullish momentum. We’ve confirmed this with one green candle close and a higher low on the RSI. If we see another daily candle close in green, it would give further confirmation of bullish strength.
However, despite these early signs of a possible reversal, the larger trend for Ethereum still remains bearish. This means that while we may see some short-term price relief or consolidation, we haven't yet confirmed a longer-term bullish trend. Over the next few days or even weeks, we could expect the price to either consolidate sideways or experience a small upward relief, but we need more signals to confirm a sustained uptrend.
#Crypto

TRX - Slow and easy trade#TRX/USDT #Analysis
Description
---------------------------------------------------------------
+ Price has hit the support line and successfully bounced back from it with a long wick.
+ Overall trend is looking strong and we can expect the price to hit the next resistance line
---------------------------------------------------------------
VectorAlgo Trade Details
------------------------------
Entry Price: 0.1262
Stop Loss: 0.1156
------------------------------
Target 1: 0.1298
Target 2: 0.1333
Target 3: 0.1391
------------------------------
Timeframe:
Capital Risk: 1-2% of trading amount
Leverage: 5-10x
---------------------------------------------------------------
Enhance, Trade, Grow
---------------------------------------------------------------
Feel free to share your thoughts and insights.
Don't forget to like and follow us for more trading ideas and discussions.
Best Regards,
VectorAlgo

MATIC: Support holding strong | Expect a bounce soon#MATIC/USDT #Analysis
Description
---------------------------------------------------------------
+ MATIC has reached a critical support zone, a level that has held strong for more than two years. The price is currently at this same support zone, and while we have yet to see a strong rebound, expectations for a bounce back remain high.
+ This major support zone has been a reliable foundation for over two years, consistently preventing deeper declines.
+ he price is once again testing this key level, and so far, the support has held firm. While a significant rebound has yet to materialize, the strength of this zone suggests that a bounce back could be imminent.
+ Though a strong rebound has not yet occurred, the historical resilience of this support zone indicates a high likelihood of a recovery in the near term.
---------------------------------------------------------------
VectorAlgo Trade Details
------------------------------
Entry Price: 0.4234
Stop Loss: 0.2836
------------------------------
Target 1: 0.5477
Target 2: 0.7841
Target 3: 0.9784
Target 4: 1.4520
Target 5: 2.5783
------------------------------
Timeframe: 1W
Capital Risk: 1-2% of trading amount
Leverage: 5-10x
---------------------------------------------------------------
Enhance, Trade, Grow
---------------------------------------------------------------
Feel free to share your thoughts and insights.
Don't forget to like and follow us for more trading ideas and discussions.
Best Regards,
VectorAlgo

A bounce back is imminent for ZRX.#ZRX/USDT #Analysis
Description
---------------------------------------------------------------
+ The price is heading towards the support zone after reaching a local high.
+ The price is expected to consolidate in this support zone and bounce back from it. It's highly unlikely that the price will go lower than this.
+ If the price bounces back from this support, we can expect it to reach the previous ATH in this bull run.
---------------------------------------------------------------
VectorAlgo Trade Details
------------------------------
Entry Price: 0.2959 - 0.3224
Stop Loss: 0.2461
------------------------------
Target 1: 0.3889
Target 2: 0.5293
Target 3: 0.7136
Target 4: 1.1567
Target 5: 1.6046
Target 6: 2.0365
------------------------------
Timeframe: 1W
Capital Risk: 1-2% of trading amount
Leverage: 5-10x
---------------------------------------------------------------
Enhance, Trade, Grow
---------------------------------------------------------------
Feel free to share your thoughts and insights.
Don't forget to like and follow us for more trading ideas and discussions.
Best Regards,
VectorAlgo

AUDUSD RESITANCE BOUNCEPair: AUDUSD
Timeframe: 1H
Analysis: Trend line, volume profile , support and resistance, trend break, reversal
—————
Key Takeaway: Seen a great bearish reaction from our dynamic resistance and trend line. Will wait for a good drastic bearish reaction from this level before entering short.
—————
Level needed: need a close bellow 0.66660
—————
Trade: SHORT
RISK:REWARD 1:8
SL: 0.66770
TP: 1.66194
—————
DO NOT ENTER OUR SETUPS WITHOUT CONFIRMATION

ONE - Looking like a moon trade #ONE/USDT #Analysis
Description
---------------------------------------------------------------
+ The price has reached the broadening wedge pattern and is currently trading within the support zone.
+ I anticipate this support holding and the price rebounding from this zone. (However, if this support fails, our trade is invalidated.)
+ I'm initiating a short position at this point and will consider adding more once the rebound is confirmed.
---------------------------------------------------------------
VectorAlgo Trade Details
------------------------------
Entry Price: 0.01983
Stop Loss: 0.01595
------------------------------
Target 1: 0.02251
Target 2: 0.02560
Target 3: 0.03124
Target 4: 0.03931
------------------------------
Timeframe: 1D
Capital Risk: 1-2% of trading amount
Leverage: 5-10x
---------------------------------------------------------------
Enhance, Trade, Grow
---------------------------------------------------------------
Feel free to share your thoughts and insights.
Don't forget to like and follow us for more trading ideas and discussions.
Best Regards,
VectorAlgo

TEL - A long term spot trade opportunity$BINANCE:TELUSDT (1W CHART) Technical Analysis Update
TEL is currently trading at $0.003958 and showing overall bullish sentiment. We are seeing the price breaking out from the resistance level and retraced back to the support (previous resistance) Im expecting a continued bullish trend and we have a huge potential for profits. We enter a the trade in spot market
Entry level: $ 0.003958 or lower
Stop Loss Level: $0.002214
TakeProfit 1: $ 0.004624
TakeProfit 2: $ 0.005959
TakeProfit 3: $ 0.008971
TakeProfit 4: $ 0.012754
TakeProfit 5: $ 0.024541
TakeProfit 6: $ 0.035754
TakeProfit 7: $ 0.049193
Max Leverage: spot market
Position Size: 1% of capital
Don't forget to keep stop loss.
Follow Our TradingView Account for More Technical Analysis Updates, | Like, Share and Comment Your thoughts.
Cheers
GreenCrypto

#NiftyPrediction View #Bullish#Nifty Recently Made a Higher high, by breaking an range bound area and sustaining above the Level.
Recent fall is expected to be a correction to the Upmove.
Market is reaching towards #Demandzone. Wait for #priceaction Confirmation for #TrendReversal

Just A View - BSE Double Top Neckline Support📊 Script: BSE
📊 Sector: Miscellaneous
📊 Industry: Miscellaneous
Key highlights: 💡⚡
📈 Script is taking support of level 2075 which is neckline of double top.
📈 We may see bounce back from here.
⏱️ C.M.P 📑💰- 2148
⚠️ Important: Always maintain your Risk & Reward Ratio.
✅Like and follow to never miss a new idea!✅
Disclaimer: I am not SEBI Registered Advisor. My posts are purely for training and educational purposes.
Eat🍜 Sleep😴 TradingView📈 Repeat 🔁
Happy learning with trading. Cheers!🥂

🚀 PBX Potential Trade: Bouncing from Support! 📈💹📊 Analysis:
Current Situation: PBX is bouncing from an area of support.
Trade Consideration: This trade is high risk, so a cautious approach will be taken.
📉 Trade Strategy:
Entry: Consider entering in the $0.0013 - $0.00135 support area.
Stop Loss: Implement a tight stop loss just below $0.001275 for risk management.
Take Profit: Target the next resistance levels around $0.00165 - $0.00174 or $0.002 - $0.00212.
🌐 Note: Given the high-risk nature, use a small amount of capital and avoid leverage. Keep a close eye on price movements and adapt your strategy as needed.

WOO/USDT - Will it bounce after consolidation❓BINANCE:WOOUSDT had significant correction since the last pump which reached up to 0.52 price level. Since WOO has a decent correction, it is currently consolidating around the 0.337 area and getting good accumulation before the reversal.
We can expect the price to bounce back after the consolidation or go into further correction upto 0.24.
If the price bounces back then our entry is around 0.35 with SL at 0.31 and Targets are 0.37, 0.39, 0.42 and 0.47
If WOO continues the downtrend then we can enter a SHORT trade around 0.31 with SL at 0.34 with Targets around 0.29, 0.28, 0.26 and 0.24.
Cheers!
GreenCrypto

📈 SUI Long-Term Holding & Swing Spot Trade Analysis 🚀For market participants considering a long-term holding coin with a swing spot trade strategy, the analysis focuses on SUI. The Stochastic RSI on the daily timeframe is currently oversold, indicating a potential bounce in the near term.
Key Analysis:
Oversold Conditions: The Stochastic RSI on the daily timeframe is in oversold territory, suggesting a potential reversal or bounce.
Buying Zone: The suggested buying zone is set at $0.64 - $0.58, aiming to capture the potential bounce from oversold conditions.
Resistance Levels: Key resistance levels are identified at $0.70, $0.80, and $1, representing potential areas where the price may face selling pressure.
Stop Loss: To manage risk, a stop loss is set below at $0.54, providing a level where the trade may be reconsidered in the event of adverse price movements.

Retest Strong Support | Long BiasOn 4H TF
I figured out two waves had completed, you can see it on the chart.
Now, MAV is trading at 0.204x and accumulating around this level
I expect MAV will go up if it doesn't close below 0.197
Nearest target for bullish around 0.22 that is my view
Wait for next move

Time to go up after bounce the strong suportDaily Chart
Gold OANDA:XAUUSD is on the support zone around 1940 that a strong support by ascending trend line and 0.618 Fib Re
I expect Gold will break 1980 and return to 2000
Wait a next move

GBPAUD I Previous break of resistance and return to structureWelcome back! Let me know your thoughts in the comments!
** GBPAUD Analysis - Listen to video!
We recommend that you keep this pair on your watchlist and enter when the entry criteria of your strategy is met.
Please support this idea with a LIKE and COMMENT if you find it useful and Click "Follow" on our profile if you'd like these trade ideas delivered straight to your email in the future.
Thanks for your continued support!

Long SLV. Silver to shine as dollar bounce wanes. The dollar is in a secular downtrend and after a brief bounce back which we played on the long side, the DXY is looking toppy and should continue to rollover in the intermediate term. Besides stocks, a beneficiary of a weaker dollar are the precious metals. I like long SLV as a high beta trade and expect SLV to continue to bounce higher in the coming weeks.

BTCUSDT BTC Bitcoin Tc1961#BTCUSDT #BTC #Bitcoin #Tc1961
Update Idea 17 December 2022
There Possible Small Time Bounce Back Just For Retest Bitcoin Still Looking For 2nd Bottom
BTCUSDT Chart

SPX will bounceAs 5 waves ABCDE Completed in a triangle pattern
Either Z wave has to extend or E2 wave (3 wave ABC) to form.
This week's price action will tell you the direction of the market. In both the cases SPX will bounce for recovery wave 'A'
