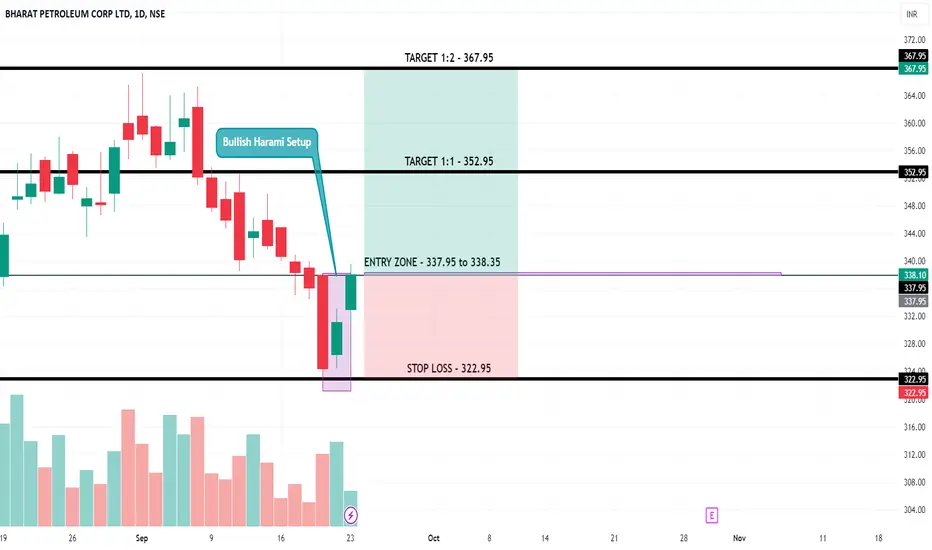
BPCL - Long SetupBPCL has bullish harami setup and already 15m candle has sustained above the price - 337.95 for more than 10 seconds.
Targets are: 352.95, 367.95
Stoploss only when 15min candle closes below the price: 322.95
Disclaimer: This is for educational purpose only and not any financial advice
Bpcllong
BPCL is ready for a bullish break outBPCL has been trading with good volumes on the bourses in recent months.
The 52W H/L being INR 484.60 / 314.10
It is consistently trading above its long-term Moving Average for the past 3 months
There is a positive divergence on the oscillators
It is standing right at the resistance level on higher time frames
Resultantly, I believe that the target price should be INR 545-555
Stop Loss should be INR 457.00
Risk to Reward will be 1:3
The time horizon should be 9-12 months

BPCL - Elliott Wave countNSE:BPCL
NSE:BPCL1!
BSE:BPCL
BSE:BPCL1!
BPCL - The Elliott wave count seems to indicate a bearish market trend.
It's best to avoid buying during a second wave of movement, as a fall is possible.
For education purposes only!

BPCL--Good Buy @340-335 Range??Observations::
--------->> The stock is trending upwards in daily time frame.
--------->> Previous resistance is broken @360 strongly. If this acts as support buy ness is observed.
-------->> we have a demand zone @340-335 levels. where previously strong buy ness is observed.
--------->> if this zones acts as a support, a strong rise towards upside is possible.
If price breaks resistance @375 range we have next resistance placed @385,400 range possible.
if price comes back to this place we will go for buy @375,385,400 . Keep track this levels.

BPCL HEAD AND SHOULDER BPCL making a bullish pattern called head and shoulder and after its breakout we see targets of 60-70 points which is length of head targets are marked as fib levels for cautions
not only BPCL but across oil sector looking bullish for few weeks

BPCL : Can break box pattern? After down trend, BPCL is now in accumulation phase. Bulls are showing aggressiveness on chart. May be it revers again from here inside box.
but what if it breakout box pattern :). Can we see uptrend back ?
What's your view? My view, i will wait for Box pattern breakout before entering and keep eye on this stock. Best for Swing trading if you know price actions
Like, Share, Comment for regular updates.
Disclaimer
I am not sebi registered analyst
My studies are Educational purpose only
Please consult with your Financial advisor before trading or investing
I may be 100% wrong as its my personal trade.
First Learn and then remove "L"

BPCL view BPCL is currently in a perfect place. We can expect an ideal directional move from this point on either side.
Wait for his stock to confirm either side move with good volumes and follow-up candles.
Trade safe. Manage risk. Be profitable.
Please follow us for more simple trading analysis and setups. Also, let me know in the comment if you have any queries.
Disclaimer:- This is my view. Please analyze the charts yourself and then decide to take any trades.

BPCL1!28-11
Daily chart of BPCL1!
Candles have breached the resistance at 330 with strength (manual).
The strong bullish candle is attempting to breach resistance at 336.15 (200 EMA).
There is a bullish divergence as well.
I have gone long as I think that once the candles manage to break and sustain above 336.15, it may test 368.45 levels.

BPCL Upside IdeaI am expecting a reversal on NSE:BPCL . As per my analysis, best level to take entry is 310 (have to wait for levels to come).
My targets will be 318, 338 & 365.
Can exit if price trade below level of 295 (Stop Loss 295).
Note: This is my personal analysis, only for learning. Thanks.

Head & shoulder in BPCL. BPCL has formed a head and shoulder pattern on a daily time frame.
The stock had closed just near the neck line and if the level is crossed a nice target of 315 can be achieved in intraday trade.
The stock is trading below 20 and 200 DMA and on the hourly time frame, there is a bearish moving averages cross over.
Confirmation for the trade:-
1. Head & shoulder
2. Bearish cross over (hourly time frame)
3. Closed below 20 and 200 ema (daily time frame
Only enter the trade if a 60 minute candle closes below 320-320.5 price level.
Targets :- 315, 307
Stop loss :- 325
Wait for a clear enter in the trade and for a price action near the levels. A intraday and even a swing trade can be initiated in this stock.


BPCL - long viewThe stock has crested a good base at the level range of 330 levels.
As you can see the stock has taken support around this area and moved upwards.
It reached a high of 503 levels before crumbling to huge selling pressures.
The stock is trying to make its way back to the top.
I have presented my views on the chart with levels that can help you take your trades.
Thanks & Regards,
If you feel you can make use of my and put them to good use, request you to kindly revert with feedback/suggestion/improvement

BPCL Technical AnalysisBPCL Technically near to support price if not break out support reverse possible

BPCLGreat opportunity for "swing trade" in "BPCL" stock gives positive brakout after downtrend buy it after re-test at 400 our SL is 350 and TGT is 450,500.


Simple Trade Setup | BPCL | 17-08-2021NSE:BPCL
Observations:
1) On Daily Time frame it looks trading in the range 445-465.
2) On Daily Time frame it looks like it is forming tripple bottom or may form tripple top pattern.
3) On Daily Time Frame it took support from 21DMA and closed above 50DMA
Please refer Chart below: daily time frame.
4) On 1hour time frame stock closed in the critical zone which is acting as a resistance since long time.
Please refer chart below: 1 hour time frame.
--------------------------------------------------
Trade Setup for Date 17-08-2021:
1) Don't Jump in to trade at the beginning of the market. Let it get settle for 15-20min first and judge the price action.
2) Everything is mentioned on the chart. I hope it is easy to understand.
3) All the levels will work as support, resistance, entry and target w.r.t price action working near that level tomorrow.
Hope I made it easy to understand it.
Do comment your doubt or suggestion.

BPCLBpcl approaching towards the gap .
Buy opportunity can be seen at the levels marked .
For swing trade .
Opportunity yet to be formed .
Keep track of it

BPCL Looking good for upsideHello Traders,
BPCL currently trading nearly 52 weeks high.still it has potential to go up, so we are publishing our analysis on BPCL.Triangle pattern has formed on chart.Price Action in looking good for upside.We can see 570/625 in next 6-8 month.It is looking good for mid term swing position.
Strategy::
Buy range:480-500
If price correct add more @ 440-455
SL: 415
Target:540/575/625
Consult your financial advisor before taking any action.
Educational purpose only.

BPCL - Enter after the breakout Good for Positional Traders. Enter after the breakout or buy and hold.

BPCL INTRADAY FEB 25 2021 LONG FOR INTRADAYDear trader,
If u look at the chart of BPCL (analysis based intraday only) the HDFC support 1 at 439 and support 2 at 435 and resistance at 455.
Forming a triangle on weekly timeframe and its near the breakout level can give good move if breakout happens on good volume in coming days.
In Intraday most important thing is to enter and exit points.
Our signals are based on analytics, algorithms, mathematical derivatives.
Always be a responsible trader, kindly trade only when you have maximum opportunity in the market with minimum risk and with keynotes like data, analysis and proper strategies.
Kindly message us for strategies and analysis.

BPCL is looking very strongTriangle breakout
Harmonics in place
RSI gaining strength
Give that RSI level breakout and we are looking for 480 and 525 Sl is 395

BPCL | Who will cover the GAP?Important Levels can be observed from the chart.. following Elliot path 4 to 5.. then a mini correction.. one can expect to complete a W formation and then fly from break honoring the Elliot wave.

BPCL SWING TECHNICAL ANALYSISAs per the Technical Analysis Chart Pattern, BPCL SWING TRADING view.
The potential bullish trend with the upside of 368 as the first target from the breakout of 355. We can follow the strict Stop Loss of 344. It is only Buy Above the resistance of level of 355.
380 can be taken as a second target.
Traders, If you liked this idea, hit the like button and write in the comment section.
This is only for educational purposes.
