BRN Short Scalp LongBrainchip showing signs that id usually look for for entry/reversals.
Short term scalp idea here.
Sitting and testing r3h (Range 3 high)= the daily range before a 30% up move. This is a short term range of importance.
EMA's crossed on 15 chart (not shown), at important level, and a MSB (market structure break), Pos div on RSI.
Brainchip
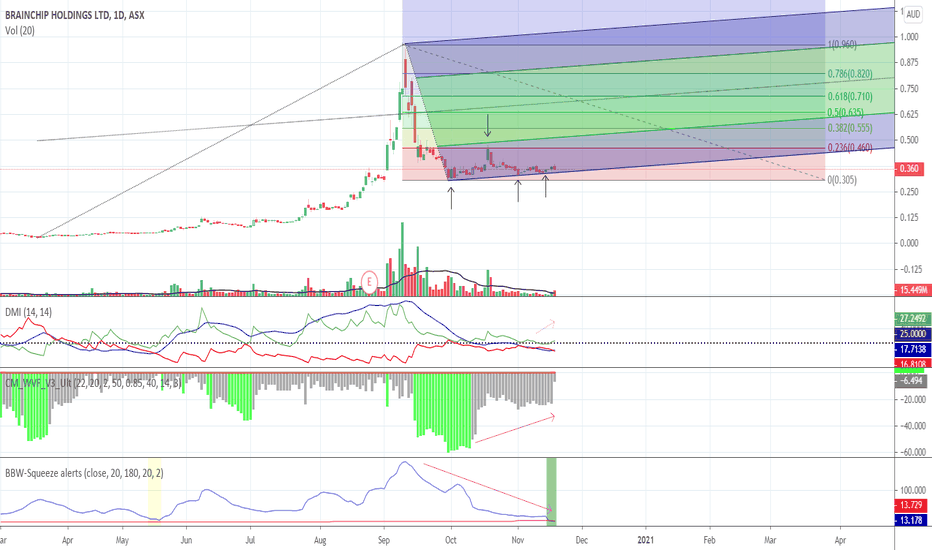
BRN consolidation over?Quick technical analysis of ASX:BRN following its rapid rise and subsequent consolidation over the past two months.
In summary:
Indicators are showing that support has been found at ~$0.31 and the .236 fib retracement level / -0.5 schiff resistance level has been tested.
As per BBW, volatility is decreasing which indicates that a breakout may be on the horizon. The BBW-squeeze also shows a potential alert for an entry point. This is supported by the Vix which hints that we have moved away from market bottoms.
Finally, DMI+ remains above ADX and has been toying with the 25 level. Movement above this level would further strengthen technical indicators for ASX:BRN .
The above indicate that BRN is in a favourable position for opting in. This would be further strengthened by positive news and / or increase in trading volume.
DYOR.
BrainChip Holdings (ASX:BRN) - What I see happening from hereLooking at the chart today from BrainChip ( ASX:BRN ) I can see they it has a couple of potential directions from here.
Over the last week or so, the stock has been retreating back from its highs of close to $1.00.
Overall though, I can see 2 possible scenarios.
Scenario A
Holding current levels (which look good considering the 61.8 fib line placement) here could see a price grab back up to above $0.50. Holding there would mean BrainChip is still maintaining an overall uptrend and also holding above the 50 fib line. Breaking through the next level of resistance at $0.64 is critical for recover efforts. A bullish scenario overall with some risk.
Scenario B
Failing to hold here would mean a fall back to previous support and older trend line around $0.34. A note here though that the old trend line has less touches, so holding it is yet to be determined. However, the fact that we have a trend line and a support line means we might see a bounce.
Options
If I was looking to gain entry, I can do so immediately, however I would be prepared for further volatility. A further fall back to $0.34 could mean a need to top up the position with more cash.
I can also choose to wait for one of the following scenarios:
- A clean break up and out of $0.64, signalling a much stronger bullish case.
- A break down and a hold at $0.34, signalling a position of relative safety to begin investment.
Risk Management
I can deploy risk management techniques including limiting the percentage exposure to this stock, applying a stop loss if it falls too far or reserving cash to purchase lower entries and reduce my average, should I want a long term position.
Hope this analysis helps!
Note - this is a record of my thoughts for personal use only. Nothing here should be taken as financial advice. Investors and traders should always do their own research before buying or selling assets.


