The BTC Gun Has Been Cocked And Is Ready To FireBTC has been coiling up over the last couple of weeks and is due for a major move. This next move will potentially signal the sound of next bull run or bring BTC back to the crypto abyss.
Looking at the chart, we can clearly see 3 major chart patterns. The first is the ascending triangle, in traditional markets this chart pattern is considered a continuation pattern; in this case very bearish. If the ascending triangle follows through then we can see BTC testing its "bottom" around $3300 and potentially go lower.
The second pattern that has formed is a rising wedge. In traditional markets this is considered to be a bearish pattern. If this is the case; we can potentially have a bearish breakout and follow through to retest our "bottom".
The last and arguably most important pattern that needs to be looked at is volume. Volume has been decreasing and is at similar levels that were seen before the drop down from $6000. Low volume tends to cause big moves. More concerning there is new data suggesting that unregulated exchanges are wash trading and faking their volume. If this is the case then it can be safe to say that the recent bullish momentum we have gotten is inorganic.
Considering all this overwhelming bearish data, It would not be a a surprise to see BTC retest its current "bottom" and crawl back to the crypto abyss.
However, If BTC has any true bullish momentum then we need to see it make a clear breakout out of the base of the ascending triangle and make it's first higher high.
Thanks for reading!
If You like this TA please hit the LIKE button!
Also, leave a comment with Your thoughts and feedback!
*This information is not trading advice and is to be used for educational purposes only!
Bravenewcoin

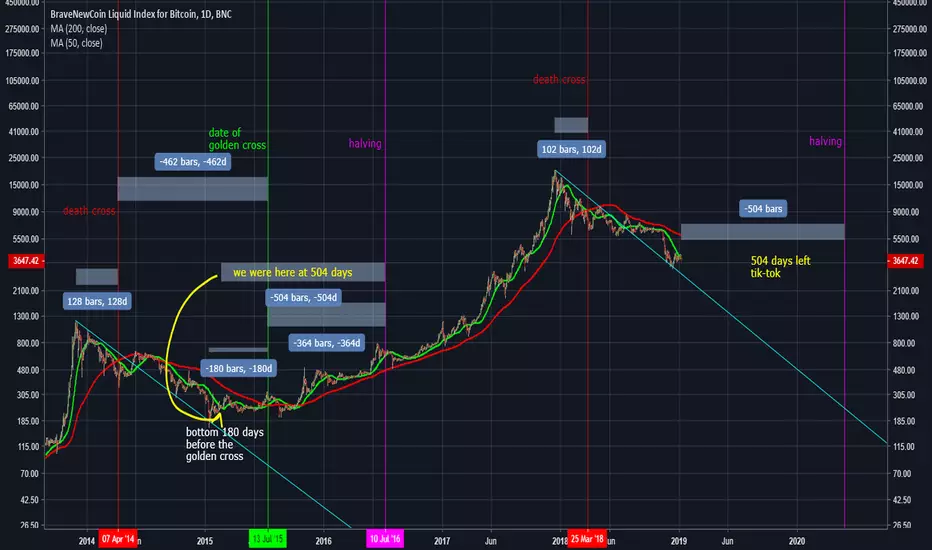
Weekly Rsi and the futurethese are just my thoughts , like you reading its a game BUT if your in bitcoin long term then use long term charts WEEKLY.
the bottoms not in, RSI weekly says we are over bought,
may is the expected halving btc so i think we can dip lower
even so im sticking to this
im jumping in soon, not yet
BTC bull will leave the shit behind, chose wise

no new break through BTC tried but failed to break through resistance, it needed to punch through like a rocket
whole crypto market cap hit 140B but is struggling to keep going.
signs are positive but the bear market is not over
volume needs more punch,
not sure its coing just yet

Bitcoin and the question we should be asking ourselvesThis is the standard BLX chart used to track the candle patterns of Bitcoin from its early stages.
The pattern is parabolic and that has been discussed more than enough here. What I want to emphasize most with this analysis is the support provided by the Green Zone.
As soon as the price enters this Zone, Bitcoin makes a bottom, never breaks it, consolidates on the long term and slowly rises as it prepares the next Bull Market.
What we should be asking ourselves is "How long will the price stay within this zone?". Because as soon as it breaks it upwards, the Bull Market starts in emphatic fashion.

Falling Wedge, where are we going.On the Monthly chart we are having resistance on the MA 5 at 4290 and EMA 30 at 4910 and we are having support with MA 200 at 3106. To confirm this falling wedge we would have to breakdown the 200 MA barrier which can be possible. Bottom of the wedge will be at 2324$ march 19th and 1725 May 19th. If we go under the 200 MA we will be there for a while, in this case EMA 100 might be our savior which is now around 1644$. The thing that is making me think we are going down now is MA 10 is about to cross down EMA 15 and EMA 21.


this is why JPMorgan thinks btc will reach 1260$could we be entering a step-based bear market for the next few months?


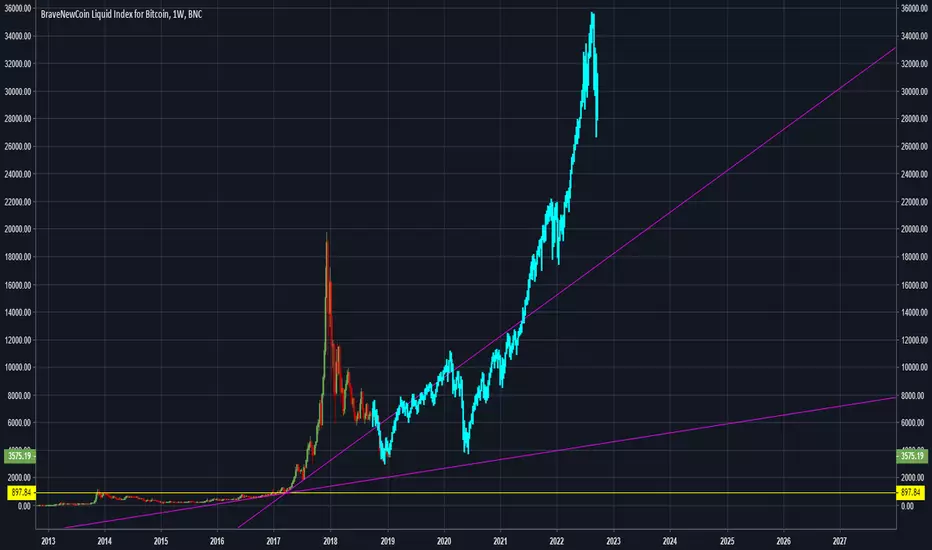


Is Bitcoin still parabolic? Projections to consider.With most bear cycle models showing that Bitcoin is approaching a bottom, it is useful to go back to its original growth pattern. The parabolic curve that has delivered High after High over this decade long time span.
Based on that parabolic pattern we have identified 4 possible growth scenarios leading to the next All Time High using duration and % increase parameters of each cycle.
Scenario (A): High around 53,300. Follows the 2012/2013 Bull Cycle.
This projection suggests that the candle sequence will follow 2012/2013 bullish pattern. High to High measurement 882 days. High estimated for May 2020.
Scenario (B): High around 58,700. Follows the 2015/2017 Bull Cycle.
This projection suggests that the candle sequence will follow 2015/2017 bullish pattern. High to High measurement 1492 days. High estimated for January 2022.
Scenario (C): High around 126,300.
This projection assumes that the High to High sequence increases by +20 bars from the previous one. The June 2011 - November 2013 High to High sequence is measured at 29 bars. The November 2013 - December 2017 is measured at 49 bars. If the next High to High sequence follows this +20 bar pattern then the measurement will be at 69 bars i.e. 2100 days. High estimated for September 2023.
Scenario (D): High around 158,000.
This projection assumes that the High to High sequence increases by +68.96% from the previous one. The June 2011 - November 2013 High to High sequence is measured at 29 bars. The November 2013 - December 2017 is measured at 49 bars, +68.96% of the 29 bars of the previous sequence. If the next High to High sequence follows this +68.96% pattern then the measurement will be at 82 bars i.e. 2496 days. High estimated for October 2024.
Based on a parameter similarity score, the Scenario that appears to be most probable is (B) as its High to High and Low to High measurements are identical to the cycle it immitates.
If you seek more insight on cycle comparisons and projections, see below how we have compared the current Bear Cycle to the 2014/2015 and 2011/2012.
** If you like our free content follow our profile (www.tradingview.com) to get more daily ideas. **
Comments and likes are greatly appreciated.

Bitcoin downtrend analysis Indicators:
Fibonacci retracement with extensions (downtrend 2013 - 2015)
Volume profile fixed range
Moving average 200 MA (red line) : a weekly candle never has had a close below the 200MA
Pattern:
Descending triangle 2018 (measure rule): TP $2950
The eyes represent the most relevant levels.


