Breadth Indicators

Release the Squeeze!ENPH is right on the edge of a squeeze release. I think if it can run up to 6.10-6.15, today, we'll see a release and a breakout

SPY Bullish tomorrow. McClellan momentum numbers need to burn off the Tension between the Advance Decline and Oscillator Velocity tomorrow to continue the bullish trend. Once that tension cools off then I'll be a buyer. -- BaconTrading

RKDA TTM Squeeze Setup Squeeze is currently on. Volatility bottomed out recently (see ADX) and is turning upward. RSX is trending upward, which tells us momentum is bullish and we'll want to go long. The Bollinger bands have started to expand but haven't eclipsed the keltner channel yet. The bullish tail on yesterday's candle and the close just below the upper Bollinger band provide some confirmation that RKDA is setup nicely for a TTM squeeze. I entered yesterday at 4.30 avg. Accumulate while the squeeze is still on or just after release and ride the trend on the upper BB until the momentum shifts. It should be an easy ride up to 5.50-5.75, which looks like the first level of sustained resistance.

CRMD Setup for TTM SqueezeVolatility bottomed out and is beginning to rise; sustained upward momentum; Bollinger Bands are beginning to expand and it appears squeeze should be released early next week.

TBIO Potential Breakout on TTM SqueezeThis looks like a promising setup. I haven't done any DD on the company's fundamentals, pipeline, etc., but just looking at the chart this seems poised for a squeeze release. Do you own DD and GLTA

JSE:J200 Number of Stocks in Top40 Above Moving AveragesI coded this indicator for the JSE. The indicator gives the percentage of stocks above its moving averages. We see that the JSE has less than 20% of the stocks above its 200 Day SMA and about 50% around its 50 Day SMA. If we look at previous analogs at the start of the trading range there was a declining trend in the 200 SMA but inclining trend in the 50 SMA which lead to some recovery. However, currently the 200 SMA is declining but the 50 SMA is not printing higher highs which seems to indicated continued weakness.

GE - MACD vs DPOHere DPO shows where money is made much more simply than MACD for General Electric.
Let's say not showing an entry point using DPO on 1 day chart.

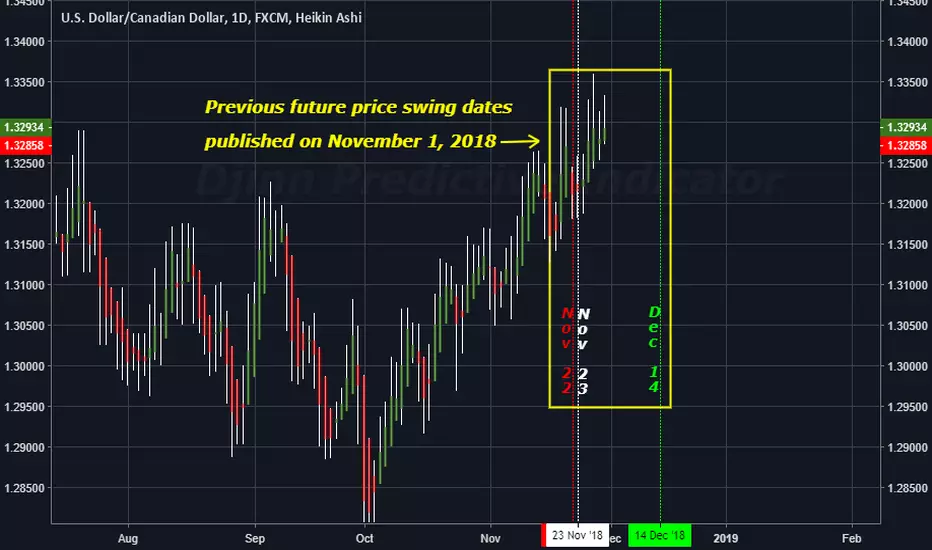
The FUTURE price swing dates for USDCADThese are the FUTURE dates for USDCAD with the highest probability for making a price
swing high or low. Apply your own indicator(s) to determine the price swing direction.
BTC/USD 1H/1D charts (11/26/2018)Good morning, traders. Welcome to the final week of November. Over the holiday weekend we saw Bitcoin find a low of $3474.73, which was around the equilibrium of the 1M zone, and bounce for almost $600 so far. That's about 17% with some possible higher highs lining up. I am looking for price to target the $4500 area, with some expected resistance around $4340 and a secondary target of the equilibrium of the grey box at $4800, if it can break the swing high of $4120. If price breaks the swing low at $3474.73, then it is much more likely to target $3000. The descending dashed red line is the most important local resistance that price needs to break in order to see price head higher.
The 1W saw RSI print a low of 31.45, just above oversold. Currently it is sitting at 30.7 and the 1W S1 pivot is noted at $3200. Yesterday's 1D candle, coinciding with the weekly close, started well but ended under selling pressure meaning rather than immediate upside bias, we should be expecting some sideways movement as buyers and sellers battle it out. This is exactly what has been happening since yesterday. It doesn't mean that price won't go up, only that it will take more effort from the buyers if it is going to do so.
The 1D shows price printing a channel within a possible a descending broadening wedge. The channel is about $1300 wide, so we should expect a target of $1300 above the point at which price exits the channel's resistance. Volume has tapered off on the drop suggesting that sellers are exhausted which is to be expected since 1D RSI has been oversold since November 14th. 1D OBV has continued to move higher, since its low on November 20th, as price has continued to drop. As always, smart money volume precedes price so the expectation is that we should see price reversing sooner rather than later.
Remember, you can always click on the "share" button in the lower right hand of the screen, under the chart, and then click on "Make it mine" from the popup menu in order to get a live version of the chart that you can explore on your own.

4G rolling into 5G - await some correctionSHEN Telecommunication stock that's central eastern region and doing phenomnenal on monthly chart and DPO confirms it. Hasn't corrected being oversold yet, but good 5G buy for mid-2019.
VZ
TMUS
S T

From A Tremor To An Earthquake? Who Woke The Bear.As the Federal Reserve continues to tighten monetary policy by hiking interest rates, we are seeing tremors in the stock market. Sometimes tremors are the prelude to a full earthquake, but often not. We are in our 11th year without an earthquake, but we sure have had a few tremors since then. July 2011, July 2015, January 2016, Feb 2018 and of course now October/November 2018. The wisest economists attribute it to the Federal Reserve and it's is hard to disagree. Our roundup of expert opinion on "Trumps stock market rally" revealed some interesting insights about the Federal Reserve rate hikes that are believed by economists to be scaring the markets.
I argue that our western economies have become Fed Rate Intolerant (FRI). Over the last 30 years, the peak at which rate hikes have triggered earthquakes has gone from 10% in 1988, to 6% in 2000, to 5% in 2007. By that rationale, rates hitting 3% now could cause the seismograph to wobble, and we are two-thirds of the way there already. I mean could you even imagine a base rate of 5% today. This would mean you would have to pay 7% interest on your house. It would translate into a real-estate and stock market catastrophe. The last 20 years have driven huge improvements in the quality of life of all of the free world, and improvements some dictatorships e.g. China, Jerome Powell, do you want to throw that away?

BTC/USD 15 min/4H charts (11/14/2018)Good morning, traders. Binance completed the update to its platform overnight and Bitcoin price continues to feel pressure. With CBOE expiry later today, traders must remain vigilant if they are interested in trading this area as we could likely see price pop up at/near that time. However, we may see more movement down toward $6100 first. Notably, 1D OBV has continued to rise as price has dropped since the October 11th Spring/TR low. Remember, price follows volume, so with OBV continuing to rise it should be expected that we will see price do so as well.
The 15 minute MACD is printing bullish divergence as I write this. RSI is dipping back into oversold as well. Price has now printed a likely descending channel from November 11th through today and price is bouncing off the bottom as it creates that bullish divergence. Traders should watch for a breach of the descending black dashed line and then the descending blue dotted line. Breaching those should have price targeting the top of the descending channel, and of course a breach and close above that should have price targeting the top of the black TR around $6450.
The 4H chart shows the potential for price to fall to around $6025/30 before heading up based on the largest width of the blue descending wedge. If so, then it would likely stretch RSI strongly into oversold on many TFs thereby resulting in a strong rebound. If the 4H candle at that time dips below the October 10th low and then closes above it, that will create an SFP (swing failure pattern) and we should expect price to rebound.
Ultimately, we are watching for price to push through the upper black horizontal line which denotes the top of the resistance area at the $6800 level thereby creating a show of strength (SOS). The expectation at that point would be retracement and consolidation around that upper black horizontal line (possibly printing a pennant) in the form of a "back up to the edge of the creek/last point of support" (BUEC/LPS) followed by another SOS above $7000. If that SOS-to-BUEC/LPS prints a pennant around $6800, then at this time we can expect a target of around $7600 when price breaks the pennant's resistance. This would complete the complex fulcrum and should signal the bull market is likely in effect. Remember, a breach of $8500 gives us the higher high that we've been waiting for and would likely be a strong buy signal to many traders sitting on the sidelines. After that, $10,000 becomes the next signal, and then of course the February high around $11,780.
Remember, you can always click on the "share" button in the lower right hand of the screen, under the chart, and then click on "Make it mine" from the popup menu in order to get a live version of the chart that you can explore on your own.

JSE:FSR First Rand New Re-accumulation RangeFSR has a similar structure to RMH (See link below). FSR has also found support at the previous accumulation range and the Yearly Pivot Point. With the Rand (ZAR) strengthening (See link below) this also provides support. The high volume after the breakout can be seen as a Buying Climax (BC). The bottom of the range provides support on higher demand volume. We have now tested it again and the OBV is indicating the upward pressure. Will be looking for a test of the top of the trading range.

BTCUSD 15 min/4H charts (10/31/2018)Good morning, traders. My Internet appears to be stable this morning so far (still waiting on the tech) so I will be attempting to live stream at 10 a.m. CST per my usual schedule. Price has continued to tighten the range it has been trading in for the past two days creating a symmetrical triangle. As these patterns have no bias, traders should be ready for a move up or down which is likely coming by this afternoon unless price just moves sideways out of the triangle and continues to range. Based on the size of the triangle, a move up should initially target the 15 minute R3 pivot around $6341-$6367 and put price back into the blue 4H TR. A move down should target the S3 pivot around $6194. The triangle structure, itself, is not ideal as price has spent most of its time in the middle of it rather than fully moving between the resistance and support. This is why I mentioned that price could just continue moving sideways out of it rather than exploding up or down. Overall, volume is muted but if we zoom in we can see that it has begun rising over the past 24 hours
The 15 minute OBV started rising a few hours ago and is working its way to the top of the descending channel it has been in since Monday morning. A breach to the upside would be bullish on this TF and may signal a larger move up on the larger TFs. MACD recently broke to the upside of its histogram's symmetrical triangle and RSI is bullish at 53.6. The 4H OBV is currently breaking bullishly out of its own descending wedge, MACD is about to cross bullishly over the signal line, and RSI is sitting just above oversold at 32.7 after having fallen into it. While there are never any guarantees in trading, these things together do appear to be signalling an impending move up. Howevever, this 4H candle has only just begun so there is a lot of opportunity for all these signals to revert to bearish. The 4H candle must close higher to set bullishness in motion for the near-term at least.
Overall, price remains within the larger two-month-old black TR between $6095 and $6587. Once price moves through the resistance or support of that TR, I will evaluate the movement to decide whether I will enter at that time. Until then, all this little movement is nothing more than noise with a risk that is far too great in exchange for any reward for me.
Remember, you can always click on the "share" button in the lower right hand of the screen, under the chart, and then click on "Make it mine" from the popup menu in order to get a live version of the chart that you can explore on your own.


Confirmed Strength Index - 2 Moving Averages (MACD)Results when I used 2 averaged lines to buy and sell at the crosspoints, little noisy atm, results are from 3 ETH, NO LEVERAGING! :D Still working on limiting noise, buy a VERY effective indicator nonetheless!

Bitcoin Projection, volume is flowing out. Bottom $5,800-$5,500Most likely will have a big come up to fake out bulls, true bottom is still yet to come. Partially because of main institutional investors still being hesitant to fully enter the game.
Lowest Bottom Possible: $5,250
High Before Bear Run : $6,350-6,400
Just my take :)

btc on balance volume divergence1 number obv divergence (negative) worked and we dropped. now 2 number obv divergence (positive) will work . and long coming

Will Bitcoin's pop lead to a continuation upward?Good morning, traders. It is Columbus Day in the U.S. which means professional traders are enjoying a 3-day weekend so volume is lighter across all financial markets. This includes the crypto market.
After another lackluster, sideways weekend, Bitcoin finally pushed up and through the resistance of the July triangle this morning. The question is, can price remain above the triangle now that it has done so? If so, then it would suggest that the TR (trading range) since October 3rd has been re-accumulation on the smaller TF (time frame) and this recent push up and out of it is an SOS (show of strength) off the LPS (last point of support). At this point, we would need to see a pennant/flag printing at the top of the TR where price is currently sitting. Failure to do so will suggest a likely drop below the bottom of the TR at $6510 and I will be looking for an initial bounce at $6450-$6466. Another leg up should find initial resistance at around $6740 which is the top of the next symmetrical triangle. Zooming out a bit to the 4H, we can see that price has continued printing a possible large ascending channel. I say "possible" because we have not seen four alternating touches of support and resistance to confirm that channel yet. However, as we can also see, the target based on the widest part of that triangle would be the top of the channel and that would give us our fourth touch which seems to suggest the likeliest price route. But until then, the ascending channel drawn as it is may or may not be true. RSI and MACD are bullish on most TFs and OBV continues to rise suggesting that smart money is still accumulating and, therefore, the price trend is legitimate. The daily pivot sits at $6700 which means a push up through the bottom of it, and subsequent close above, should indicate bullish momentum on that larger TF. The only real issue I have on all of this at the moment is that volume on the 1H is dropping even as price is making higher highs. We would need to see continued expansion of volume coinciding with the upward movement to alleviate this concern. That being said, the 4H TF volume on the current candle is closing in on the previous high candle's volume with another 2 hours remaining.
Although price has continued playing out as it has, there still remains the possibility of a TS (terminal shakeout). That means that we could see price drop suddenly, below the corrective June low, at any time and pop back up just as quickly. Traders choosing to enter a position in this area, whether long or short, are increasing their risk exponentially, and much more than that if they are trading on margin. The latter combined with a TS will likely result in traders on both sides of the shakeout being liquidated. Remember, hard, sudden moves in this market tend to see the exchange Websites inaccessible and TPs (take profits) and SLs (stop losses) not firing.

MTL/BTC About to blowMTL in an accumulation range with steadily rising OBV and increasing buy volume. Tight BBs show that its very likely to have an explosive movement upwards soon. Analysis can be seen on the chart

Bitcoin's triangles of demandGood morning, traders. Bitcoin spent the weekend moving sideways as suggested on Friday and we are nearing a likely large movement one way or the other. The question is, are you ready? Have you prepared for either move? Do you have a plan in place in case price moves against you? And what if it's a shakeout - strong move one way and then the other? These are the possible scenarios that you should be looking at right now. The reality is that two of these three scenarios are bullish - 1) a move up from here or 2) a shakeout (bear trap) that drops price, potentially below the June low, and then returns price to a higher level trapping shorts along the way. I'm not guaranteeing any move up, just reminding traders of the reality of this particular position that price is in at the moment since they have been caught up in the "price HAS to drop below $4800" mantra.
Other than the large triangle patterns that we have been talking about for months now, we can also see that price is printing an ascending triangle on the 1H that began around 9/28 with the upper resistance around $6660/$6670. We can also see bullish divergence on the 4H MACD histogram from 9/29 at 11 p.m. CST noted by having higher lows in the histogram but lower lows in price, as well as the same building on the 4H from 9/19 with resistance around $6800. A breach of the former should set a price target of $6870 and creates a breach of the latter which, then, puts it at $7515. This pulls price out of all the various larger TF triangles creating a target in the mid-$9000s and simultaneously confirming the possible complex fulcrum. A move above $8500, of course confirms a bull trend. CMF continues to rise on the higher TFs, nearing a bullish cross of 0 on the 3D. Of greatest interest this morning is the 15 minute candle at 6 a.m. CST. We can see a significant rise in volume but price moved less than $40 and closed just 4$ lower than it opened. This was the largest volume on this TF that we have seen since 9/5 at 7:15 p.m. CST and, with it being such a small TR, indicates demand. The 4H also has its own symmetrical triangle printing within the possible larger ascending triangle which gives us a target of $7000 if it breaks up and $6150/$6200 if it breaks down. The latter would have it testing the diagonal support that began at the 8/13 low. OBV has continued to rise on the 4H even as price has consolidated which suggests that we may see price moving higher. Taking a quick look at the 1D shows price pushing up against the horizontal red line near $6625. This red line is the equilibrium of the 11/6/2017 weekly candle and has provided resistance/support throughout this corrective cycle. A push through that should send price upward as the noted patterns suggest. 1D RSI is bullish at 50 and MACD is nearing a bullish cross over the zero line. OBV shows a steady rise since 8/14 as it nears that ascending support line. Traders can also find a $14 gap on the 1D between 5/10 and 5/11, as well as a $26 gap between 1/15 and 1/16. These are gaps that will most likely be filled at some point. There are no similar price gaps below the current level. Finally, price is sitting on the 4H pivot and just below the 1D pivot.
As a result of all of this, and the things we have been discussing for months now, I believe price bias remains bullish. This doesn't mean traders should just be throwing their money in long, however. They must still develop their trading plans, complete with confirmation levels and appropriate risk management. We never trade on opinions. Trading is borne of speculation, hence it is absolutely a game of risk management. If anyone tells you otherwise, run the other way.

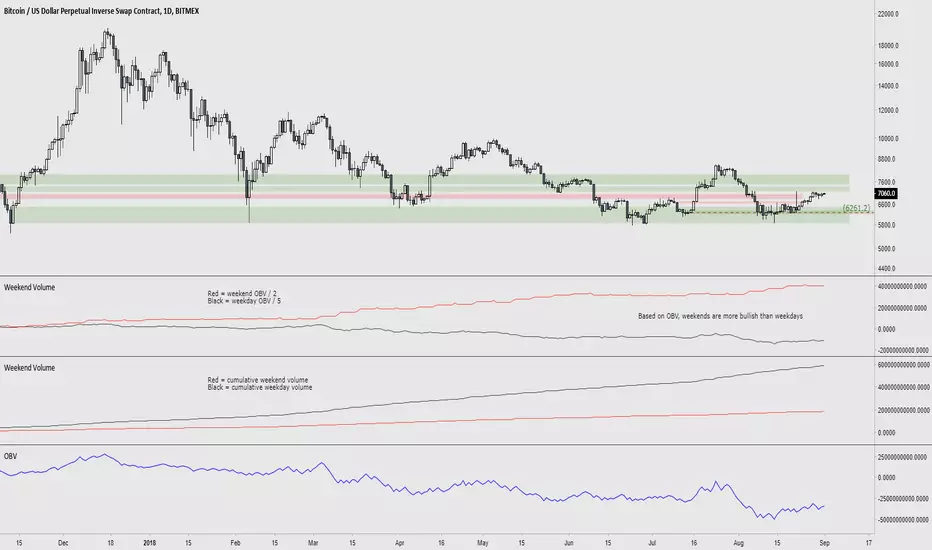
BitMEX Weekday/Weekend Separated OBVOverall, on average weekdays have more volume than weekends. However, weekends have a higher OBV value.