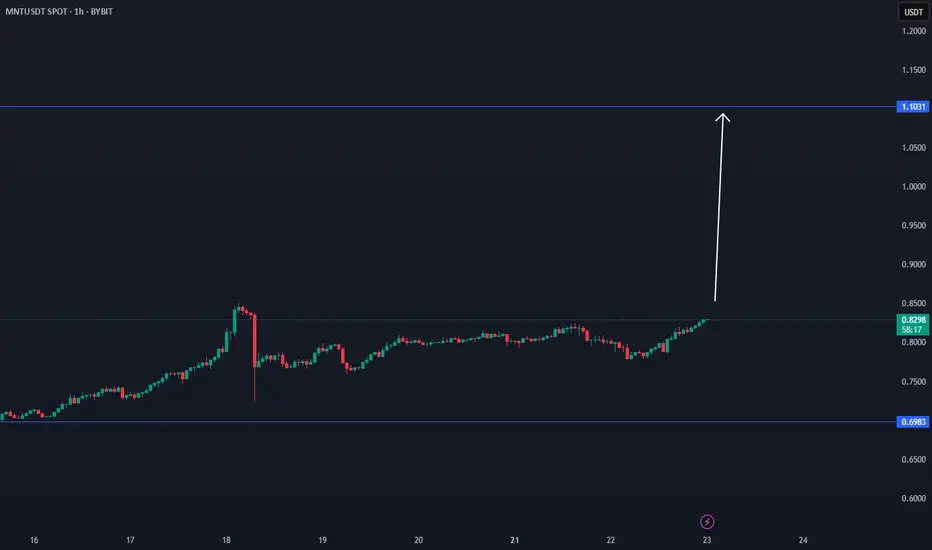
MNT TIME FRAME BREAKMNT has a good chance to break in the coming hours, depending last data.
$1.10 is an important target. 32% increase possibility.
Coin has acctive volume.
Break
DPRO falling wedge breakoutDPRO has broken out of a falling wedge on the weekly. Ticker will respond well to Trump's "Big Beautiful Bill" which includes over $30 billion for defense/military spending. The drone company is already making progress with US military projects and is setting up for a strong rally.

SUPER = BACK WITH SUPER EFFECT - MOON SHOTSuper can show in the coming time frames an interesting view.
When there is confirmations, will add below this update.

Looking to take profits on Microsoft that's severely overboughtThis summer most stocks will lose their momentum making it a great time to take profits. We got into NASDAQ:MSFT at an average of $$350-375, it's time to sell at least half to 75% of the stack then buy back around the 0.618 golden fibonacci at $400 after the gap is filled.

Time to take profits on Robinhood, it's extremely overboughtit's just about time for profit taking with summer here. Aiming for around $45-50 prior resistance turns to support, to buy back in at the 0.618 golden fib level as well.

Bitcoin MMC Analysis – Mirror Market Concepts in Action + Target📌 Overview:
In this idea, I’m using Mirror Market Concepts (MMC) to break down Bitcoin’s current price behavior. MMC is a powerful way to spot repetitive price patterns, psychological zones, and mirrored moves that help us predict where the market might go next.
Let’s break down what this chart is really telling us. 👇
🔁 1. Mirror Market Concept in Play
MMC is all about symmetry. Think of it like looking into a mirror—what price did on the left side, it might repeat (or mirror) on the right side.
Look at the two rounded zones (highlighted in light blue ellipses). Price dipped into the support zone, formed a rounded bottom, and then shot up. A similar pattern is forming again on the right-hand side. This mirroring behavior gives us a clue that price could follow the same path upward again.
📉 2. Trendline Resistance – A Key Level
The chart shows a clear descending trendline that has been respected multiple times. Every time price tries to break above this line, it gets rejected. This tells us that sellers are still in control at that level.
Until this trendline is broken cleanly, bullish momentum remains capped. However, multiple tests of the trendline also indicate it's getting weaker, so a breakout might be coming.
🟪 3. Support Zone – Buyer’s Stronghold
See the purple shaded area near $108,400? That’s the support zone. Price bounced off this area several times, showing that buyers are defending this level.
This zone is important because:
If it holds, we can expect another upward push.
If it breaks, price could drop to the next support level (not shown here, but could be around $107,000–$107,500 based on structure).
🎯 4. Previous Target Hit – New Target Identified
Using MMC, we previously predicted a move up to around $110,800, and that target has been successfully hit (labeled as "Previous Target" in the chart).
Now, a new target zone is forming around $109,600–$109,800, marked on the right side of the chart. If price breaks above the trendline and central zone, this is the next likely destination.
🔵 5. Central Ellipse Zone – Compression Area
The blue ellipse on the right side represents a central zone—an area of price compression and indecision. In MMC, this is where price builds up energy before a move. It acts like a spring: the longer price consolidates here, the bigger the breakout move will be.
Right now, BTC is compressing in this central zone. This is a critical moment. The breakout direction from here could decide the short-term trend.
📊 Trade Plan Ideas:
🔹 Bullish Scenario:
Wait for a clean breakout above the trendline and central zone.
Look for a retest of the breakout area (confirmation).
Target the $109,600–$109,800 zone.
🔹 Bearish Scenario:
If price fails to break the trendline and drops below the support zone at $108,400…
We could expect a deeper pullback toward $107,000–$107,500.
🔹 Key Levels:
Resistance: $109,200 (trendline area), $109,800 (target zone)
Support: $108,400 (zone), $107,500 (next major support if broken)
📘 Final Thoughts:
This chart is a perfect example of how MMC (Mirror Market Concepts) can give us a visual roadmap of what price might do next. It’s not about guessing—it’s about recognizing the psychological patterns that repeat over and over in the markets.
Right now, Bitcoin is sitting at a decision point:
Break above the trendline = possible bullish continuation
Break below support = likely bearish shift
Watch the central zone closely—because the next big move could start from right there. 🔍

JPYUSD | Head & Shoulders Breakdown Setup | Bearish move Build🔍 Technical Overview
A clear Head & Shoulders pattern has formed on the JPY/USD 8H chart — a well-known bearish reversal setup often signaling a shift from bullish momentum to bearish control. The pattern is confirmed with a left shoulder, higher head, and lower right shoulder, all aligned along a defined neckline acting as key horizontal support.
Currently, the price is retesting both the neckline and a descending trendline, which adds confluence to the bearish bias. If price fails to break back above this resistance zone, we can anticipate a further drop toward the projected target zone.
📌 Key Technical Levels
Head: ~0.007180
Neckline Support: ~0.006660
Retest Area (Confluence Zone): ~0.006940–0.006960
Bearish Target: ~0.006470 (measured from the head to the neckline and projected downward)
Trendline Resistance: Acting as dynamic resistance since the recent high
⚙️ Price Action Insights
Pattern Clarity: The structure of the H&S is clean and symmetrical — a classic sign of distribution and topping out after a bullish rally.
Retest in Play: Price is currently retesting the trendline resistance. Rejection from this area strengthens bearish continuation potential.
Momentum Shift: Bullish pressure is weakening. Lower highs on the right shoulder show buyer exhaustion.
🧠 Mindset & Strategy
This setup demonstrates how patience, pattern recognition, and confluence can align to offer a high-probability trading idea.
✅ Wait for Confirmation: A strong bearish candle off the retest zone or neckline breakdown gives a cleaner short entry.
✅ Risk Management First: Place stops just above the right shoulder or trendline (~0.007000 zone).
✅ Target Logically: The target is not random — it’s derived using the classic measured move technique, matching the head-to-neckline distance.
📋 Trade Idea (Not Financial Advice)
📍 Entry: On rejection at retest zone or confirmed neckline breakdown
🎯 Target: 0.006470
🛑 Stop Loss: Above 0.007000 (trendline/right shoulder area)
⚖️ Risk/Reward Ratio: Minimum 2:1 if entered post-retest confirmation
🧠 Trader’s Note (Minds Insight)
This is where discipline comes into play. Don’t chase the move. Let the pattern complete and confirm. Head and Shoulders formations are among the most reliable reversal patterns — but only after neckline breaks or strong rejections.
This setup teaches traders to trust the process, combine horizontal and diagonal resistance, and let the price action do the talking.

BTC/USD Bearish Setup – Trendline Retest Before the Fall?🔍 Technical Breakdown – BTC/USD 3H Timeframe
Bitcoin is displaying a textbook Double Top pattern formation on the 3-hour chart, signaling a potential bearish reversal after a strong bullish run. This classic pattern suggests buyer exhaustion and sets the stage for a downward move. Let's break down the analysis:
🧠 Pattern Insight: Double Top Reversal
A Double Top is one of the most reliable trend reversal patterns, especially when it forms after a sustained uptrend — just like we're seeing here.
Top 1 and Top 2 both formed inside a strong Resistance Zone between $106,500 and $107,000, showing repeated rejection from buyers to push price higher.
The formation of lower highs and long wicks near Top 2 further reinforce the weakening bullish momentum.
💥 Neckline Breakdown & Bearish Trigger
The Neckline, aligned with a horizontal Support Zone (~$103,300–$103,800), was decisively broken, confirming the pattern.
This breakdown acts as the trigger for bearish entries, and we are now in the "Retest Phase", where price often pulls back to the neckline or a nearby trendline before continuing lower.
📐 Trendline Confluence – Retest Opportunity
A short-term descending trendline drawn from Top 2 intersects near the neckline zone.
Price is now approaching this confluence area, offering a potential high-probability short entry if bearish price action confirms (e.g., a rejection candle like a bearish engulfing or pin bar).
🎯 Price Targets & Trade Setup
Parameter Value
📍 Entry On bearish confirmation near neckline/trendline retest (~$105,300)
❌ Stop Loss (SL) Above recent swing high / Top 2 (~$107,100)
🎯 Target ~$97,126 (based on measured move from top to neckline projection)
⚖️ Risk:Reward Approx. 1:3 or better (depending on entry timing)
Measured Target Calculation:
Height from neckline to peak (~$107,000 - $103,500 = $3,500)
Target = Neckline break - height = ~$103,500 - $3,500 = $97,000–$97,100
🔥 Market Context & Psychological Edge
This chart structure reflects a shift in market sentiment. What was once strong bullish momentum is now hesitating — with buyers failing to make higher highs and sellers stepping in aggressively. The double top is not just a pattern, it's a narrative of exhaustion and reversal.
“Let price confirm your bias. Don't just predict; react to structure and behavior.”
Being patient and letting the retest play out is crucial. Don’t rush in early — let the market give you a clean signal. This is where technical discipline pays off.
⚠️ Risk Management Notes
Crypto markets are highly volatile — avoid oversized positions.
A failed double top can lead to a bullish continuation, so SL discipline is key.
Wait for confirmation — candlestick patterns, momentum shifts, or bearish volume spikes can add confidence.
📌 Summary
✅ Pattern: Double Top
✅ Confirmation: Neckline Break
🔄 Current Phase: Retesting Neckline/Trendline
📉 Bias: Bearish
🎯 Target: ~$97,100
❗ SL: Above Top 2
💬 What do you think? Are we headed to GETTEX:97K or is this just a fakeout? Drop your thoughts below and don’t forget to like and follow for more trade setups!

USDCHF Analysis: Break & Retest or Mean Reversion?Hello traders!
USDCHF is offering two trading scenarios on the daily timeframe.
The first scenario suggests the pair may react bearishly from the resistance zone, setting up a break-and-retest opportunity that could drive price lower toward the 0.80001 area.
The second scenario anticipates a bounce toward the 0.89100 region, where a mean reversion setup may come into play (if sellers step in and price action confirms bearish intent near that resistance).
Discretionary Trading: Where Experience Becomes the Edge
Discretionary trading is all about making decisions based on what you see, what you feel, and what you've learned through experience. Unlike systematic strategies that rely on fixed rules or algorithms, discretionary traders use their judgment to read the market in real time. It's a skill that can't be rushed, because it's built on screen time, pattern recognition, and the ability to stay calm under pressure.
There's no shortcut here. You need to see enough market conditions, wins, and losses to build that intuition—the kind that tells you when to pull the trigger or sit on your hands. Charts might look the same, but context changes everything, and that's something only experience can teach you.
At the end of the day, discretionary trading is an art, refined over time, sharpened through mistakes, and driven by instinct. It's not for everyone, but for those who've put in the work, it can be a powerful way to trade.

Apollo Tubes, 1WChannel Pattern is Looking Very Good , Take little Time to Breakout from the Pattern
Enter only after the Breakout of Upper Trendline
Stop line Should be Minimal so your profit should be High , Follow 1:2 Risk, Reward minimal in Every Trade .
Follow For More Swing Ideas Like This

FluoroChem ,1WFirst Triangle Pattern is Breaked Out and Next Channel Pattern is Formed at Retest for Triangle Pattern .
Now Channel Pattern is Ready to breakout , SO look an Eye on it when Breaking
Only Enter after the breakout of upper Trendline of Channel Pattern .
Be Careful when entering at breakout
Follow for more Swing Trade Ideas Like This

CHF/USD – Double Bottom Reversal Setup - Trading SetupComprehensive Analysis of CHF/USD 4-Hour Chart
The CHF/USD 4-hour chart presents a technical trading setup based on a Double Bottom reversal pattern, combined with trendline support and key resistance levels. This pattern suggests a potential bullish breakout if key resistance is cleared. Below is a professional breakdown of the chart, covering the market structure, pattern formation, and a strategic trading setup.
1️⃣ Market Structure & Trend Analysis
The overall market structure suggests that CHF/USD has been in an uptrend, as indicated by the ascending trendline that has consistently provided support. The price has recently tested a key support zone twice, forming the Double Bottom pattern, which is known for signaling a trend reversal or continuation of an uptrend.
The dashed trendline connecting higher lows confirms the bullish momentum.
As long as the price stays above this trendline support, the bullish bias remains valid.
A break below the trendline would indicate a possible reversal or a deeper retracement.
The most critical observation here is that the price is respecting both the trendline and horizontal support zone, which increases the likelihood of a breakout in the upward direction.
2️⃣ Double Bottom Pattern Formation
The Double Bottom pattern is clearly formed at a strong demand zone, reinforcing the idea that buyers are stepping in to prevent further declines.
The first bottom was formed after a rejection from the 1.1250 - 1.1290 support zone.
The price then attempted to recover but faced resistance at 1.1350 - 1.1400, which now acts as the neckline of the pattern.
The second bottom was formed at approximately the same price level as the first, confirming the validity of the pattern.
A Double Bottom pattern is considered bullish, but confirmation is required through a breakout above the neckline resistance (1.1350 - 1.1400). If the price successfully breaks this level, it will indicate that buyers have regained control and the price is likely to move higher.
3️⃣ Key Support and Resistance Levels
In this setup, there are three crucial price zones: support, resistance, and the target area.
The support zone, located around 1.1250 - 1.1290, is where buyers stepped in to push the price higher. This level is crucial because it provided strong demand during the formation of the Double Bottom.
The resistance level at 1.1350 - 1.1400 serves as the neckline of the pattern. A breakout above this level would confirm the bullish trend continuation, while rejection could lead to another retest of support.
The target area is projected around 1.1500 - 1.1550, based on the measured move of the Double Bottom formation. This is the price level where traders may start taking profits if the bullish breakout occurs.
4️⃣ Trade Execution Plan
To take advantage of this potential setup, traders should focus on three key aspects: entry, stop-loss placement, and take-profit levels.
Entry Strategy
Aggressive traders can enter a long position above 1.1350, anticipating an immediate breakout.
Conservative traders may wait for a break and retest of the 1.1350 - 1.1400 zone, which would act as a confirmation for a sustained bullish move.
Stop-Loss Placement
A logical stop-loss should be set below 1.1138, which is beneath the Double Bottom formation and trendline support.
If the price drops below this level, it would invalidate the bullish setup and signal a potential trend reversal.
Profit Targets
The first target zone lies around 1.1450 - 1.1500, where traders may consider securing partial profits.
The extended target zone is 1.1550, which aligns with the expected measured move of the Double Bottom pattern.
5️⃣ Risk Management & Final Considerations
Since this setup is based on a strong trendline support and bullish pattern, risk management is essential to protect against fake breakouts or sudden trend reversals.
Traders should monitor price action near the 1.1350 - 1.1400 resistance zone. A strong bullish candle closing above this area increases the likelihood of a successful breakout.
If the price fails to break out and starts moving lower, it may indicate that sellers are still in control, which could lead to a deeper correction toward 1.1200 or lower.
6️⃣ Summary & TradingView Idea
This CHF/USD 4-hour chart presents a high-probability bullish setup based on a Double Bottom reversal at a strong support zone. The key confirmation level to watch is 1.1350 - 1.1400, which, if broken, will likely push the price toward 1.1500 - 1.1550.
Entry: Buy above 1.1350 or after a breakout retest.
Stop Loss: Below 1.1138 to avoid false breakouts.
Take Profit: First target at 1.1450 - 1.1500, extended target at 1.1550.
This setup provides a favorable risk-to-reward ratio, making it a strong potential trading opportunity. However, traders should always wait for confirmation signals before entering a position. 🚀

EURAUD - Areas of Interest!Hello TradingView Family / Fellow Traders. This is Richard, also known as theSignalyst.
📈EURAUD has been overall bullish, trading within the rising channel marked in green, however it is currently retesting the upper bound of the channel.
Moreover, the red zone is a strong resistance zone.
📉 Thus, the highlighted red circle is a strong area to look for sell setups as it is the intersection of the resistance and upper blue trendline acting as a non-horizontal resistance.
📈 Moreover, as it retests the lower bound of the channel and blue support, I will be looking for longs.
For now, we wait!⏱️
📚 Always follow your trading plan regarding entry, risk management, and trade management.
Good luck!
All Strategies Are Good; If Managed Properly!
~Rich
Disclosure: I am part of Trade Nation's Influencer program and receive a monthly fee for using their TradingView charts in my analysis.

DOTUSDTRange Breakout: The pair has been trading within a range, and the breakout from this range signals potential bullish momentum. A breakout indicates that the price is ready to move out of its consolidation phase, with buyers now in control.
Trendline Breakout: The price breaking above a key trendline further confirms a shift from a bearish or neutral market sentiment to a more bullish one. This is a strong signal that upward momentum is building.

GET READY FOR THE DIP BUYING TO + $0,14 AGI/USDT WITH GOLDEN ->Depending on our Study is this at this moment the best Dip buying for the recovery to up $0,14
Our focus target short term $0.1 which can be followed by a break of $0,14
BTC has seen a huge breakdown since the last trends.. Between 20:20 and 02:25, the time frame can be important for this coin to build a new cycle volume.
Let's watch the coming and see if this expected golden break will happen.

NASDAQ Future long: after resitance broken, new support formed Current Analysis: Nasdaq futures are currently facing a critical support at 22100
I see the chance of a Bullish rebound:
Support Strength: This support was a resistance in past weeks, then it was broken on Feb 14th and act as support in last 3 days.
Additionally, from Dec. 17th to February 12th, price formed a triangle that was broken up on Feb.13th.
Expected Movement: If the price successfully breaks above 22100, I expect it to rally towards the $22400 area.
Action Plan:
Entry Point: entered long with limit order at 22100
Target: Set a target in the $22425 (high of December 17th)
Stop Loss: Place a stop loss at 21937.75, below minimum of Feb.20th and with Risk/Reward Ratio of 2.

SWFTC/USDT BREAK POSSIBILITYSWFTC/USDT BREAK POSSIBILITY
It has a high chance of breaking in the coming time

HBAR - Riding The Beast!Hello TradingView Family / Fellow Traders. This is Richard, also known as theSignalyst.
📈After breaking above the $0.1 mark, HBAR surged by almost 400%.
Currently, HBAR is in a minor correction phase.
Moreover, the green zone is a strong demand.
🏹 Thus, the highlighted blue circle is a strong area to look for buy setups as it is the intersection of the demand zone and blue trendline acting as non-horizontal support.
📚 As per my trading style:
As #HBAR approaches the blue circle, I will be looking for bullish reversal setups (like a double bottom pattern, trendline break , and so on...)
📚 Always follow your trading plan regarding entry, risk management, and trade management.
Good luck!
All Strategies Are Good; If Managed Properly!
~Rich

BCHUSDT wait for close up a weekly resis according to chart , BCH is crossing weekly resistance but is not closed yet . we are waiting now .
by attention that there is no resistance levels after 477 in weekly , if bch close up to this level we except to experience higher prices like 600 or more .

BTC - Still Bullish...Hello TradingView Family / Fellow Traders. This is Richard, also known as theSignalyst.
📈 As per my last analysis, attached on the chart, BTC rejected the red structure and traded higher creating a new short-term structure marked in orange.
📈As long as the structure marked in orange holds, BTC will remain bullish, and a movement towards the upper bound of the blue channel and all-time high at $74,000 is expected.
📉 If the orange zone is broken to the downside, a bearish correction toward the $65,000 round number would be expected.
📚 Always follow your trading plan regarding entry, risk management, and trade management.
Good luck!
All Strategies Are Good; If Managed Properly!
~Rich

EURAUD - Already OverSold...Hello TradingView Family / Fellow Traders. This is Richard, also known as theSignalyst.
📈 EURAUD has been bearish trading within the falling channel in orange.
Currently, EURAUD is approaching the lower bound of the channel.
Moreover, the zone marked in blue is a strong demand.
🏹 Thus, the highlighted blue circle is a strong area to look for buy setups as it is the intersection of the demand zone and lower trendline acting as non-horizontal support.
📚 As per my trading style:
As #EURAUD approaches the blue circle, I will be looking for bullish reversal setups (like a double bottom pattern, trendline break , and so on...)
📚 Always follow your trading plan regarding entry, risk management, and trade management.
Good luck!
All Strategies Are Good; If Managed Properly!
~Rich

ETH - Retesting Support Again...Hello TradingView Family / Fellow Traders. This is Richard, also known as theSignalyst.
📈 ETH has been bearish as an over-extended correction phase, and currently approaching a massive support zone $2000 - $2,200.
The support is also intersecting with a long-term trendline.
Thus as long as the $2000 holds, we will be looking for long-term bullish setups.
📚 As per my trading style:
As #ETH approaches the support zone, I will be looking for bullish reversal setups (like a double bottom pattern, trendline break , and so on...)
📚 Always follow your trading plan regarding entry, risk management, and trade management.
Good luck!
All Strategies Are Good; If Managed Properly!
~Rich

GBPAUD - Now We Wait!Hello TradingView Family / Fellow Traders. This is Richard, also known as theSignalyst.
📈GBPAUD has been bearish trading within the falling channel.
Currently, GBPAUD is approaching the lower bound of the channel.
Moreover, the zone marked in green is a strong demand.
🏹 Thus, the highlighted blue circle is a strong area to look for buy setups as it is the intersection of the support zone and lower trendline acting as non-horizontal support.
📚 As per my trading style:
As #GBPAUD approaches the blue circle, I will be looking for bullish reversal setups (like a double bottom pattern, trendline break , and so on...)
📚 Always follow your trading plan regarding entry, risk management, and trade management.
Good luck!
All Strategies Are Good; If Managed Properly!
~Rich
