GBP/AUD - Potential Buy OpportunityGBP/AUD - 1 HR - Keep Trading simple. Identify trend, mark key structure levels. We're watching this pair heading into next week.
Break

NZD/USD - Textbook Break and Retest SetupsNZD/USD has been on a long term uptrend since March 2020. Zooming into the 4hr we can identify an ascending channel that has been respected for some time.
Here can see that key levels are being broken to the upside and price is coming back to retest the level as support. From these levels we can take out long positions as a break and retest setup.
It will be interesting to see whether price continues it's bullish move and break through the 0.73 whole level, already once respected.
Drop me a message if you'd like to ask any questions.

TF dependency...Australia reports employment data considerably better than economists forecast
R3 0.7931
R2 0.7855
R1 0.7811
PP 0.7735
S1 0.7690
S2 0.7614
S3 0.7570
ALMOST SELL


Will the channel bottom hold out?Nice and simple setup, but this means nothing until the channel bottom is taken out. Longterm my bias on this is still long, across the majority of EUR pairs. We are still long on EJ & this pair since May.
We could easily see another push to the channel top which would definitely give the targets a move with it. The targets are in no way concrete, especially if we do not see a break early this coming week.

EUR/USD SIGNAL (Short term sell)TOPDOWN ANALYSIS: Shows bullish trend being broken (with large 4H candle break below trendline)
ACTION PLAN: 1.) Wait for pullback/ retracement to 1.22467 price level
2.) Look for a wick rejection and an bearish engulfing = enter with a 1:3 Risk reward
MAGIC IF: 1.) If price pulls back above trendline and consolidates = wait for another bearish break and retest
1.2) If price pulls back above trendline and shows large bullish momentum candles (large body but small wick) wait for a break and retest above previous structure highs (then look to enter a buy)
2.) If price continues down without retesting = Don't enter (because of possible entry at exhaustion) but wait for at least four bearish trend confirmation LL, LH, LL, LH
Reasons/ Confluences:
.Price has not yet reached monthly High and has broken bullish trendline structure
.USD News event strengthening the dollar
.Large 4H candle close below trendline
TIPS:
.Enter a sell position with a sell stop
.Once price has moved to 1:1 risk reward, move stop-loss to break even and possible exit (if candles show exhaustion)
.Never enter a trade hastily (there will always be more opportunities)

USD/CAD Possible bullish momentum to Price 1.29830We could expect a pullback to 1.27830 Area Before a bullish continuation to at least 1.29830.

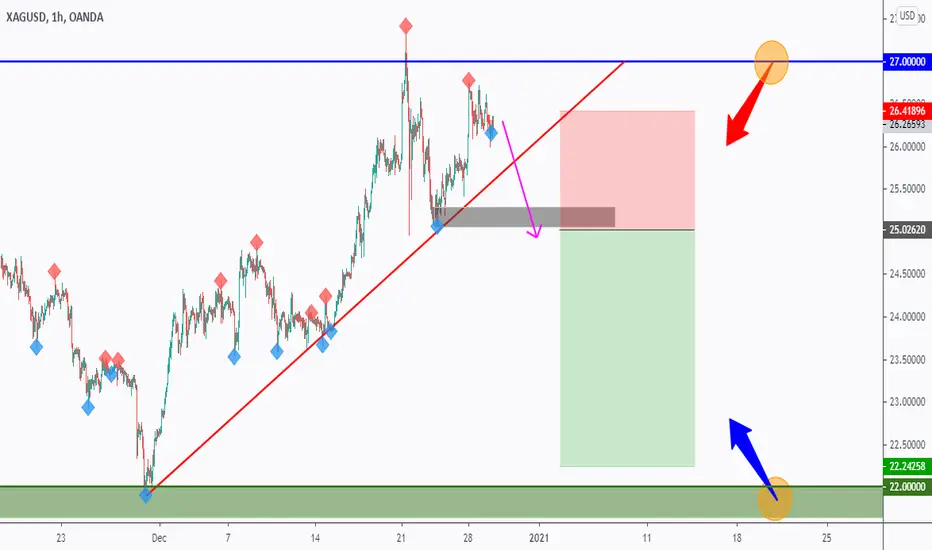
SILVER waiting for a trigger to sellHello everyone, if you like the idea, do not forget to support with a like and follow.
on DAILY: SILVER is sitting around strong resistance 27.00 in blue so we will be looking for sell setups on lower timeframes.
on H1: SILVER formed a valid trendline in red so now we are waiting for our trigger to confirm the bearish movement.
Trigger: Waiting for a momentum candle close below the gray area to sell.
and until the sell is activated, this one would be overall bullish and can still dive inside the blue zone.
As price approaches our lower green support, we will be looking for buy setups.
Good luck!
Break and rest There was a strong resistance area that was never tested , and we have a support trendline now we just waiting for the golden third touch.


Break and retest strategyClearly breaking rezistence structure for retesting and another LONG to weekly high

GBPNZD => Waiting For Our Trigger To Buy!Hello everyone, if you like the idea, do not forget to support with a like and follow.
on DAILY : GBPNZD is sitting around a strong support area in green so we will be looking for buy setups on lower timeframes.
on H4 : GBPNZD is formed an inverse head and shoulders pattern so we are waiting for a break above its neckline to buy.
Trigger: Waiting for a momentum candle close below the gray area/neckline to buy.
and until the buy is activated, this one would be overall bearish and can still test the lower green level before going up.
As price approaches our upper blue resistance, we will be looking for sell setups.
Good luck!


US30USD Day trade targets, anyone backtest this?Hopefully I didn't just spoil the fun of the market, but the market will retest a topping tail of a green bar, and bottoming tail of a red bar. If we do retest the Red bar we've broken the trend line and could potentially retest 26,000 in the coming months. If we retest 30k and break the 30300 all bets are off and we will see 40k by next November. hashtag inflation hashtag janet hashtag printing money like it's worthless

Rising Wedge Identified | GBPUSD SellOANDA:GBPUSD
Key Points:
1. 4h Rising Wedge Pattern.
2. Still need to break 50 EMA.
3. 1.34 Psychological resistance.
3. Rising Wedge support broken waiting for retest.
Setup Invalidation: If price returns to the middle of rectangle then the setup will be invalidated.
Entry Criteria: Wait for large bearish momentum candle on 1h or 15m and look for sell.
What do you think?

GJI really like GJ for the upcoming week
let me tell you its story ->
1.We had a massive bearish movement from 140.315
to 137-ish levels where price consildated a bit
then we had a bull run to around 139-ish
2.From there we started forming a downtrend market structure
3.We started to trend below the 200EMA
4.Waiting for a pullback then go to 137 lvl or even break it


Chf/jpy - Short Another set up was provided today. I took this trade on the retest of a 15m level after getting confirmation on the 1D, 4H and 1H.
Very simply, i waited for a key level to be broken on a clear trend and then went short once the retest of that key level started to show rejection.
If you can keep your strategy simple you can repeat it easily, and this is key to staying consistent.
My risk s 1% and i will be seeking 2x my risk, once the trade gets half way to my TP i will lock in stops at break even.
I hope this helps.

XAUUSD / Long / 1300 PipsHello TradingView, from following the price we're able to identify prices we can jump in and get out on.
Use the wicks and opens / closes of candles to pinpoint those moves in price. This will give you a very clear understanding.
We identified the strong prices.
We waited for it to break it.
We waited for it to test.
Then we entered.
A almost 0 drawdown position and a great target to pocket 0.70+% gain.
Make sure you're using your own risk and money management strategy properly.


GBP/NZD In a Free FallGBP/NZD just exited a wedge in which it has been for over a year. My guess would be that, especially with the volatility of the last week, GBP/NZD will continue falling the coming weeks.
Consider Support 1 and Support 2 as your profit targets, with Support 1 being the most conservative.

XAUUSD NEEDS TO RETEST BEFORE GOING HIGHERXAUUSD needs retest maybe to 1925 before going higher. I make my chart clean as possible so you guys can easily understand it.

Grab quick 80 PIPSBe careful, the market is still unstable. Use the lowest risk possible or don't trade at all.
Please hit Like & Follow to support more analysis. You can also comment to share your bias.
