GBP/AUD FALLING: DEATH CROSS + CHANNEL BREAKGBP/AUD convincingly broke through its channel, which held strong since early September. Accompanying this break-through, a bearish cross of the MA50 and MA200 (so called death cross) happened a few bars earlier.
Target 1 should be an area where you want to unload some of your positions, in case the price will rebound from the support line. Target 2 could be reached with enough volatility, but dont be sure of it.
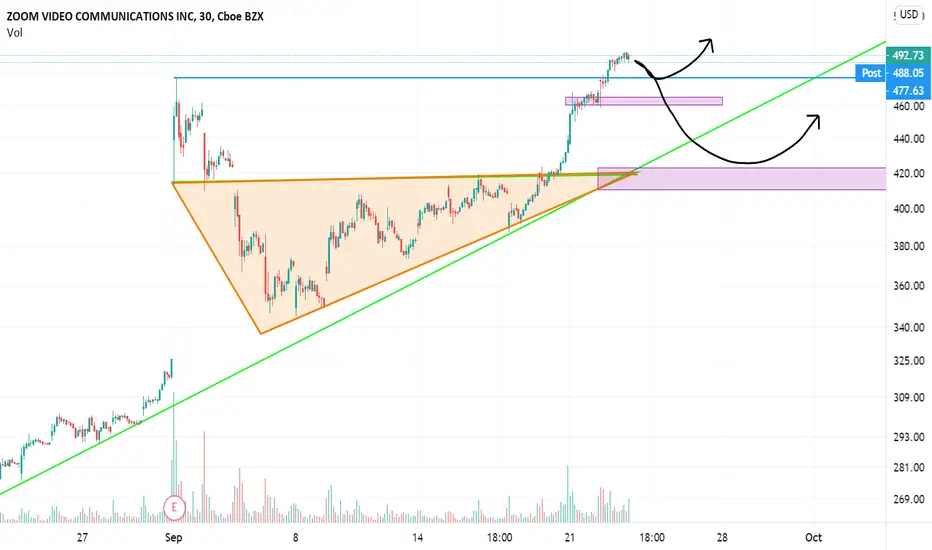
Break


Catch 70 PIPS with me on this Break and Retest Break and Retest
Please hit Like & Follow to support more analysis. You can also comment to share your bias.

Macro Bull Flag in BTC Just Broke Out Huge Risk/RewardRecently I have discovered that assets have not just been in a very bullish trend, but that they are showing signs of being within a specific bullish trend formation. Specifically, bull flags. I'm pretty astonished to have confirmed that this is the case by applying the characteristic ABCDE pattern they display.
The implication of this cannot be understated, especially as I am seeing bull flags on lower time frames forming continuation patterns and beginning to break out right now.
Bitcoin is, as I write, completing a break out. The rally has begun to take off, and will steam ahead towards the all time high.
Additionally, many are feeling a lot of FUD and pessimism about current market conditions, but according to my analysis here. The market should have completed it's final E move down and is ready for sustained upside from here on out until the breakout. I believe this breakout will happen in a little over a week.
Whenever breakouts happen from a completed pattern, that is ALWAYS the point of maximum price velocity in the market, whether a crash or a rally.
So the implication here is that, because the above pattern is an 8 month extremely bullish pattern, that has just completed, and we have signs of bullish continuation flags starting to breakout, as soon as these new bull uptrends reach and exceed the previous highs, there will be a massive unprecedented upside rally.
This is most likely to be a once in a lifetime scenario or even less common. The upward price momentum should be shocking and unfortunately cause disorientation and the urge to FOMO buy.
This is the first risk with this scenario
The second risk here is that the comedown from this excessively overbought condition will be as big in scope as the comeup. One thing to keep in mind here is some simple sayings, "Easy come, Easy go", "The faster it rises, the faster it falls" These are general truths that will bear out their time tested wisdom once again in this extreme and unsustainable new bull market we are entering.
Finally I want to touch on the grand opportunity that this presents to people who see the signs and are able to act in advance. THIS IS NOT A TIME FOR FOMO! If anything, reaching asset prices somewhere of an indicator level of $4,500 on the S&P500 and $27,000 to $50,000 in BTC are likely good places to consider asset liquidations. This is a way to take advantage of a temporary premium value in assets.
There will be a rally, a top, and a correction to this quick and easy money. My plan is to buy now, liquidate around indicator levels aforementioned, and rebuy at the following indicator levels that a bottom may be in at: $2,700 in S&P500 and $7,500 in BTC. These are previous support levels and are the likely places prices will stop in the coming correction.
Please remember that when you see shocking price movements in the markets in the coming weeks, the highs will be unsustainable, and will come down in short order. Please do not FOMO in and protect your family as well. The risk here is great, but there is also reward for smart money. I am choosing to go all in now. I'm mostly in LINK but also have some BTC and at times will use ETH. I have leverage available for these and will use it to maximize my ROI on the way up. On the other side I along with the smart money presumably will all be holding cash, metals, and other safe havens, or actively shorting the markets back to equilibrium median value. But the equilibrium will not occur before sending the markets to lows not seen since the March crash and February of 2019.
People who buy out of euphoria and hysteria will be hard pressed not to give in to panic selling when their inflated purchases lose more than 40% of their value after just a few short months. This will devastate small retail and retirement accounts who don't know any better.
The patterns I see and the momentum as well is unmistakable to me, if you read this please keep this in mind when you see surprising things happening in the financial news soon. And take appropriate precautions. Also, remember that if you are surprised, you're too late. There are financial professionals projecting $4,500 (30%) gains in the stocks by EOY and I predict $27,000-$50,000 in BTC value at the top, but the lows that I predict should come in at previous lows in the market at $2,700 S&P500 and $7,500 in bitcoin, not as bad as the March crash, but you can see how if you FOMO into this rally, you will rapidly lose all your value and more causing the urge for panic selling. This is a recipe for big losses to uninformed people.
And finally there is always some news to go with the charts, and in this case there will be a narrative as well. Believe me: THIS BULL RALLY AND CRASH ARE ALREADY IN THE CHARTS. I can see it very clearly, and my fractal analysis shows that the crash will be a necessary part of this, not optional.
So please be smart with your money.
I am writing this on October 27th, 2020
I am open to any communications about his, thanks
Intratekram - Ben Ghrist - ghristb@gmail.com

GBPCHF H1 - Long Trade SetupGBPCHF H1 - Lower timeframe analysis on GBPCHF, double bottom on support, key support zone as indicated with the white horizontal line, this is the start of the 2 stage reversal! Those that have got the advanced course, keep an eye on this! This would effectively act as the confirmation for this setup for intraday trading.

Eurusd , Long-term - Long Position - Strong Bullish Trendnow is very Important Time in the market . EurUsd Break the 10 years Bearish Trend , clearly and Powerful

Preliminary Squeeze On [USD/JPY] LongMy conclusion is as stated; however, new lows will be created before upside movement. Taking out all the late Sellers for the eventual rejection. In the coming weeks JPY is expected to lose some value to substitute USD Strength to test Dynamic Resistance.

BAT ready to break out of descending wedgeSelf explanatory. It's bouncing off the bottom with very good volume. Looks better than OMG, IMO. Target is around the red line to take some profits but letting the rest run due to bull market which should take legit tokens and coins up with ETH.

Buy APPL Dip? My Fellow Crypto Traders,
Appreciate you taking the time to view my analysis, in which I hope you may find it beneficial. Please be sure to “LIKE” if you indeed find my analysis useful and/or find my analysis intriguing.
Also, I’m new to charting game and the crypto/stock space. So, if you have any constructive criticism or tips, please share.
Cheers & Happy Trading!


EUR/CHF Breaks OutAs it is characteristic, The price has been in a huge trend for a long time, Now we have to see if the break out is real or fake. If it is a real break out we have to see a testing to the line after breaking out and we go for sell position.

XRP Buy a Break Setup!Ripple - Short Term - Expires at Monday
We look to Buy a break of 0.2602 (stop at 0.2488)
Short term MACD has turned positive.
The RSI is trending higher.
A break of yesterdays high would confirm bullish momentum.
Remains bullish while above last week’s low.
A break of 0.2600 is needed to confirm follow through bullish momentum.
Our profit targets will be 0.2922 and 0.3038
Resistance: 0.2600 / 0.2650 / 0.2800
Support: 0.2520 / 0.2440 / 0.2400
Signal Centre

Retest This pair is coming from a retest after break out. If the support turned resistance hold them. You can look to long it. What do you guys think 🤔

Buying position on OracleNow, Oracle has broken its highest price, the breakout seems a little low on momentum and speed, its possible that we witness a testing on the last price support and rise up, or it might be a fake breakout and we might see a testing on our triangle and then rise on price.
Did Silver just break a long term support line?Silver just pushed below a trend line that can be linked all the way back to the crash in March 2020 - if the price action comes back up to bounce off it a couple of times as resistance, look for Silver to fall to $23.50

Long on EU (Daily)Here I have a potential long for EU, depending on the closure of the daily candle. I would like to see movement to the upside and break through the structure of 1.18632 to reach the wick in the region of 1.19170. I would naturally expect price to retrace back to the structure and ideally use it as a support to then continue to the upside and reach the initial target of 1.20. I know this is a very ambitious trade but I still believe that the EURO is strong, and will overpower against the DOLLAR.
Obviously this is my own personal trade and I highly recommend that you carry out your own analysis before entering a trade.
We also have so high influence news from both Europe and USA, which will make the markets extremely volatile, so we will need to keep this in mind during the trade.
Use the correct risk management and happy trading.


USDCAD Potential Breakout -> Retest of DowntrendALONG WITH BREAKOUT OF DXY SLIGHT DOWNWARD CHANNEL. Chart speaks for itself: daily higher lows/highs rebounding from downtrend, price is in golden pocket of fibonacci retracements (daily). R/R currently 2.62 if TP is at -.618 Fib extension

Waiting for the Retest Broke trend line and support.
Waiting for confirmation of the retest of either the retest on the support level and or the trend line support level.
Also could be a fake out and go back up through the trend line to the top resistance level in green.
Patience.
I am pushing down trend but must wait

Bitcoin Buys Idea - Wait for entry (Weekly)(Patience) Break and retest on bitcoin for weekly wick fill.
TIP: It’s kind of an obvious setup so I think you’ll get that big wick (that BTC frequently does) to hit SL on people already in a buy position or a close below support to fake out people trying to sell, then a close back above the support for the move.
