USDCHF DAILYInteresting to see how this pair may play out, price looks to have made a potential "double top" to broken support now resistance. Will be watching price action this week.
Break

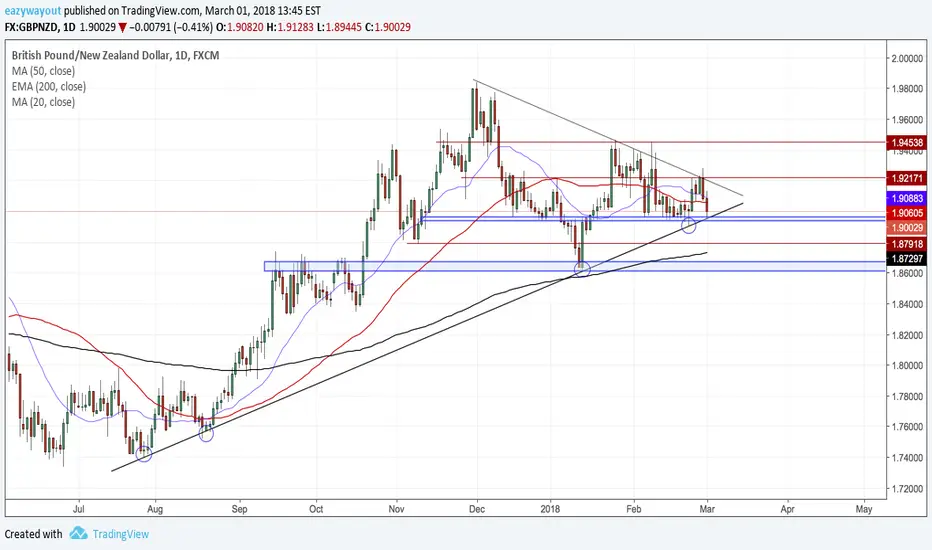
GBPNZD 4HAfter another rejection off of daily support, the range for price gets smaller & I will be watching for clues to where price will go next for this week.

CHFJPY 2HBreak of demand zone, now being rejected as a new supply zone, we should see a strong move to the downside this upcoming week..

DXY 4HPrice broke out of its descending trendline with a bullish engulfing candle after todays hawkish speech from Powell this morning. My bias is moving over to bulls on the double bottom after the double bottom off weekly support 88.60 which I had stated would be a potential reversal area a few weeks back. Price is now at a supply zone, where I suspect a potential pullback is now possible (higher low). Will be watching price action closely

NZDUSD 4HPrice made a strong impulsive bounce off daily support last night, now approaching an area of resistance where I will watch price for a rejection, or a break of price to the upside out of its counter trend line. Lets see what price action tells us !

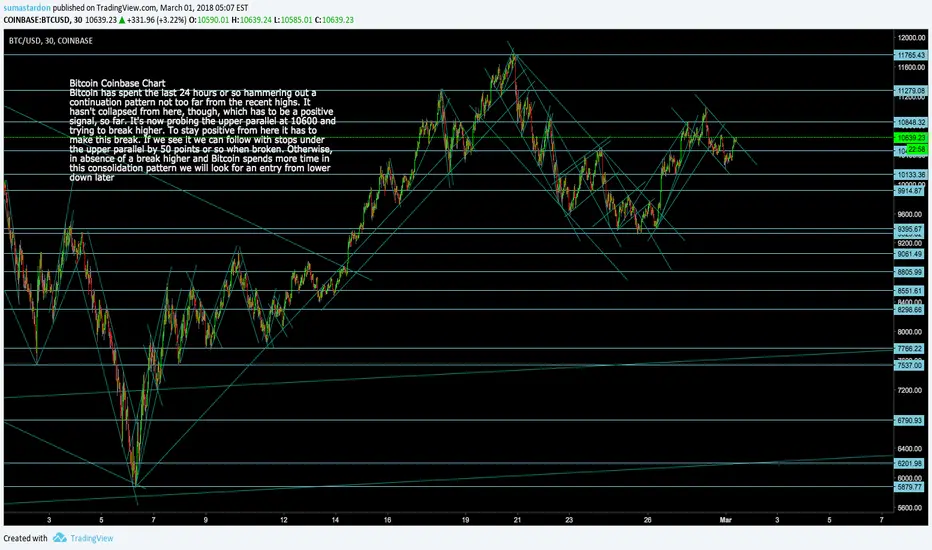
Bitcoin BTCUSD Still Positive When It Breaks above 10600Bitcoin Coinbase Chart Next Buy Point
Bitcoin has spent the last 24 hours or so hammering out a
continuation pattern not too far from the recent highs. It
hasn't collapsed from here, though, which has to be a positive
signal, so far. It's now probing the upper parallel at 10600 and
trying to break higher. To stay positive from here it has to
make this break. If we see it we can follow with stops under
the upper parallel by 50 points or so when broken. Otherwise,
in absence of a break higher and Bitcoin spends more time in
this consolidation pattern we will look for an entry from lower
down later
XAUUSD 2HInitial 4 hour uptrend line broken, & price came back to retest previous support now as new resistance. We should see some downside momentum pick up again potentially down to 1300 monthly support which price has not yet achieved.

EURUSD DAILYSimple trend analysis here, price broke the neckline to its double top off monthly resistance. Price may head down to the 1.20800 zone to retest a strong previous supply zone, where I will look for a rejection or break back below for a continue of a bearish trend.

EURUSD 4HPrice is in a range, now testing the demand zone 1.22200, where price could either break this zone & go towards 1.20800 or bounce back to the upside to make a daily triple top. New upside target on this pair could be potentially 1.26700

CHFJPY 4HPrice in a steady downtrend, making lower lows & lower highs. Price testing previous support now resistance, where I will watch for a reversal candlestick for entry down to support & potentially lower..

NZDCHF 4HWatch for a break of the demand zone price has been rejecting, & a break & retest of the counter uptrend line for a downtrend continuation down to its previous lows.

AUDNZD 4HPrice created a inverse Head on Shoulders pattern, recently breaking above the neckline & now price is retesting broken resistance as new support now. NZD press conference shortly will be watching price action...

ETCBTC Ethereum Classic Bitcoin Next Buy PointETCBTC Ethereum Classic Bitcoin
First important resistance lies at 3378-3385 - once it can clear
this range it should start to attract more buyers and begin to
fly higher still spiking into the 3530-3597 range - maybe not a
bad area to hang some limit orders

GBPJPY 4HPrice is a bit choppy right now after moving in a downtrend for the past few weeks, now I will be waiting for a breakout & price to pick a direction. Price could go back to the 151 area of down to 148 & lower potentially lets see how price moves this week

AUDNZD 4HPrice in a downtrend, now coming back again to reject off a 4 hour supply zone, & I will now watch for a reversal signal to enter short down to the previous lows & a new possible lower low..

EURGBP 4HPrice now retesting broken support, & broken trendline. Price came up for a lower high, now is it time for a new lower low?!

USDCAD 4HPrice broke though daily support with a bearish engulfing candle, & the previous candle before was a doji candle on the daily rejecting the 200 Ema. This is a big bearish reversal sign, so now I will be watching for a reversal candlestick to the broken pink zone retested as resistance, for potential entry! : )

USDJPY 4HDaily support broken, retested as new resistance & the downtrend continues.. Watching for a reversal candlestick pattern to 38.2 fibonacci resistance, for potential re entry first target is the previous low, & its possible price may make a new lower low this week

GBPCAD DAILYDouble top here to weekly resistance, also a potential shooting star rejection from this weekly candle closure to a strong zone.. Will be waiting for a break of support & the 4 hour uptrend line for shorts down to the initial daily uptrend line.

USDCHF 4HPrice under daily resistance, now I will be watching for a break of the counter uptrend line for potential entry.

AUDNZD 4HPrice broke its counter trendline with a bullish engulfing candle. Price now going towards a supply area, where I will be watching for a reversal candle to continue the downtrend, or a break above for a deeper retracement up to daily resistance (Purple zone). On the watchlist for the upcoming week!

GBPCAD 4HPrice broke daily resistance & validated as support, price should now make its way up towards 1.80000
