CADCHF Breakout + RetestCADCHF traded higher to break a reversal zone. On the 4H time frame we can see a bounce from the reversal zone which indicated a leg up extension. Expecting banks to buy some longs here at least to the previous highs.
Break

HowTo - Find REAL Pivot/Swing Highs & LowsWant to avoid unnecessary stops and find REAL market structure? Here's you can improve, hiding your stops, and identify a REAL turn in the current flow of price.
Questions?
Ask!
#learntoearn

WTI RETEST AGAIN 4H DESCENDING LINEWTI crude oil traded lower yesterday after hitting resistance at $108.73 on Monday, near the downside resistance line. Although the black liquid remains below that line, it is also trading above the key support territory of $93.00. Thus, the experts expect some short-term declines up until that zone, but for the outlook to become overly bearish, we believe a clear and decisive dip below $94.75 is needed.
On the upside, yesterday's price was retested and again confirmed the descending upper triangle line as a support. The traders would like to see a clear break above $108.65 before they start examining the bullish case. This could also confirm the break and may pave the way towards the $115.63 level or the high taken from March 08th at levels around $125.00.
Such a dip will confirm a forthcoming lower low on the daily chart and may see scope for declines towards the 88.65 or 86.45 zones. If neither obstacle can stop the bears, then we may see them pushing towards the low of January 24th, at 82.50.
Shifting attention to our short-term oscillators, we see that the RSI, already below 50, shows signs of turning south again. At the same time, the MACD, although slightly positive, lies below its trigger line and looks ready to fall below zero soon. Both indicators suggest that oil could start gaining downside speed again more quickly.
Risk Disclosure: Trading Foreign Exchange (Forex) and Contracts of Difference (CFDs) carry a high-risk level. By registering and signing up, any client affirms their understanding of their own personal accountability for all transactions performed within their account and recognizes the risks associated with trading on such markets and such sites. Furthermore, one understands that the company carries zero influence over transactions, needs, and trading signals. Therefore, it cannot be held liable nor guarantee any profits or losses.

GANDHITUBE : Trendline BreakoutGANDHITUBE : Beautiful Trendline Breakout + Retest Done
Stock ready to Fly
Good Swing trade possibilities

gold still in accumulation once price breaks i will have a better idea on what to expect for example if it breaks up im lookinf for sells if it breaks down im looking for buys plain and simple love my strategy

GMT UP Channel Pattern formationPossible formation of UP Channel Pattern.
If we break through channel line, then this idea will not be valid.
If we break upper line, we can get another pump, otherwise it can go down to previous support level.
-----------------------------------------------------------------------------------------------------------------
Please note that this is not a financial advice. Just my personal idea. Do your own research.

ETH ---> Break UpTrend ETH has broken its uptrend line and stabilized below it. Now we have to wait for its pullback to the broken trend line, if we see a suitable CANDEL Pattern, we will enter the selling position.

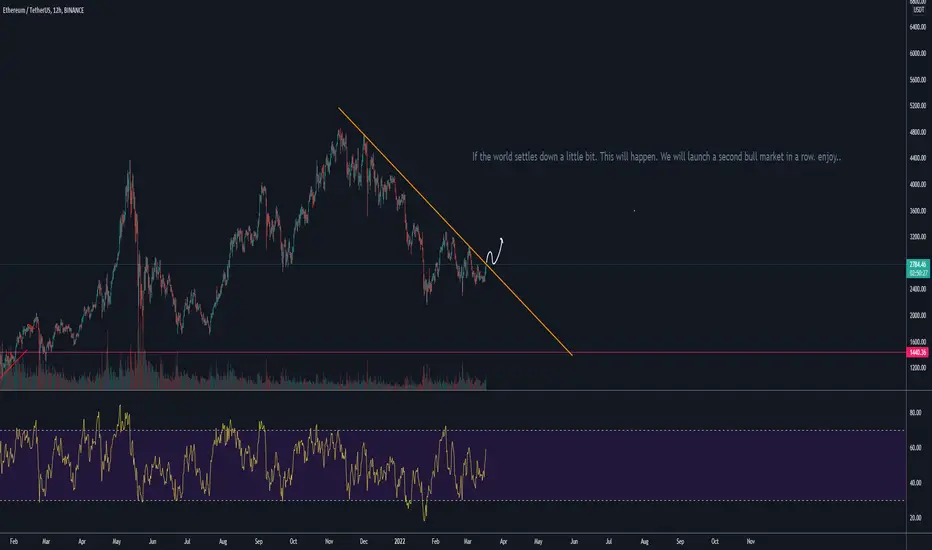
ETH waiting for a piece of good world news -> kickstart altsznMy thoughts are that we will break this down trend, with just one good piece of good world news.
ETH will gain a lot, alts will gain more. Bitcoin will be the boss: surviving wars and energy deficits.
not financial advice
TCOM following Bili trailing move by 9hrsTCOM will gap up tomorrow and follow bili into the same move.
Trailing this move by 9hrs
it popped 10 dollars today i think TCOM will do the same.
by iCantw84it
03.16.22

GBPAUD Buy setupPrice currently downtrend but right now it the weekly trend line and make higher high and high low. WAIT FOR BREAK & Retest and Buy GL!!!

EURUSD - Video Top-Down AnalysisHello TradingView Family / Fellow Traders. This is Richard, as known as theSignalyst.
Here is a detailed update top-down analysis for EURUSD.
Which scenario do you think is more likely to happen? and Why?
Always follow your trading plan regarding entry, risk management, and trade management.
Good Luck!
All Strategies Are Good; If Managed Properly!
~Rich

BTC H1BTC now drop below support in triangle on 1 hour chart. Always plan your entries based on BTC movement in order to maximize profits. US session opening in 1 hour, so eye on DOW and others for if we see bounce then will reflect in BTC. According to my chart yesterday $42.8k - $43k is real possibility and good entry zone for if DOW recovers.

pivotal pointup or down make your bets im hoping up the two yellow lines are target we either go up to red or down to white line

Shiba Bullish Rise (Daytrading)A bullish rise for Shiba from A to E. Drop off shortly after E to around 18 - 18.5
Time (1pm uk time to 7/11pm)
Slight drops between A B C D E but a steady incline for Shiba which could see it break pass the 19 mark.
What's your thoughts ?

gbpjpy simetrical triangle gbpjpy is moving quite well, I expect that there will be a break downtrendline and confirm the symmetrical triangle pattern and continue the rise in gbpjy
you can see the supply and demand area for yourself, happy trading

CADJPY BUYCADJPY form a double bottom, wait for break and retest and BUY!!
This is a personal idea, sharing for fun!

🌳very important terminologies in Trading🌳Hello every one
🟡(1) Price action
The Movement of an asset or Security's price over Time , Plotted on The chart
🟡(2) All-Time High (ATH)
The Highest asset has Ever been in Price
🟢(3) Support
a Point in the market where the Price is less likely to drop below due to previous demand or price action
🟡(3) Resistance
a Point in the market where the Price is less likely to break above due to previous demand or price action
🔵(4) Trend line
a line indicating the General Price Direction of a chart
🟡(5) break out
when the Price of the asset break through a pre-determined Trendline
⚪(6) Formation
when a Financial Chart moves in such a way as to create a Recognizable pattern.patterns to signal trading opportunities either to enter or exit positions.
🟢(7) pump or bullish
The price of an asset is going up
🟡(7) Dump or bearish
The price of an asset is going Down
🔵(8) Long Position
a Regular Buy in The Market. a Trade that is Predicting the asset will go up in value
🟡(8) short Position
The opposite of a long Position. Entering a Trade position betting the asset to go down in value.

ADA - My Trading Plan in 2 mins!Hello everyone, if you like the idea, do not forget to support with a like and follow.
Here is the top-down analysis for ADA, feel free to request any pair/instrument or ask any questions in the comment section below.
Best of luck!

Bitcoin testing supports and looking for a new bottomAs bitcoin has broken through support at 37,000, it is now exploring aggressively the support line at 36,500 respectively 36,000.
If support breaks at 36,000, the next support line which Bitcoin can be exploring will be at 35,500
35,500 is also the ultimate support after which an approximate closer bottom can perhaps be seeing at approximately 33,000
Traders should be mindful of both short and long trades. The current Bitcoin trading area is no man's land.

SOLUSD • 30m • FTX • AnalysisWe are forming an important pattern for Solana! This pattern can be seen in the 1-hour chart but to see it clearer and cleaner I show it in the 30-minute chart. This pattern is very clear and the breaking of this could mean a lot for the price. It's something we have to pay attention!

AUDUSD SHORTshort AUDUSD. rising wedge breakout and retest. looks like nice short entry. take your trade with proper MM.

Moving to 29K fragile support levelI'm afraid we are now moving in a real downtrend.
If Bitcoin moves below 27500 USD, we will really have a very bad situation. If it holds around 29000, there will be no disruption
in its move to above 68K +. so if it rebounds at 29000 USD, we can have hope for a 87000 USD resistance target.
But it's too uncertain for now.
Let's hope the 29K support level will not be as fragile as it seem right now.
The bitcoin winter's is here now. it's not about snow, nor cold. But a bloody crypto massacre for many
Don't take my words for granted, do your own analysis to confirm, and trade at your own risks.

