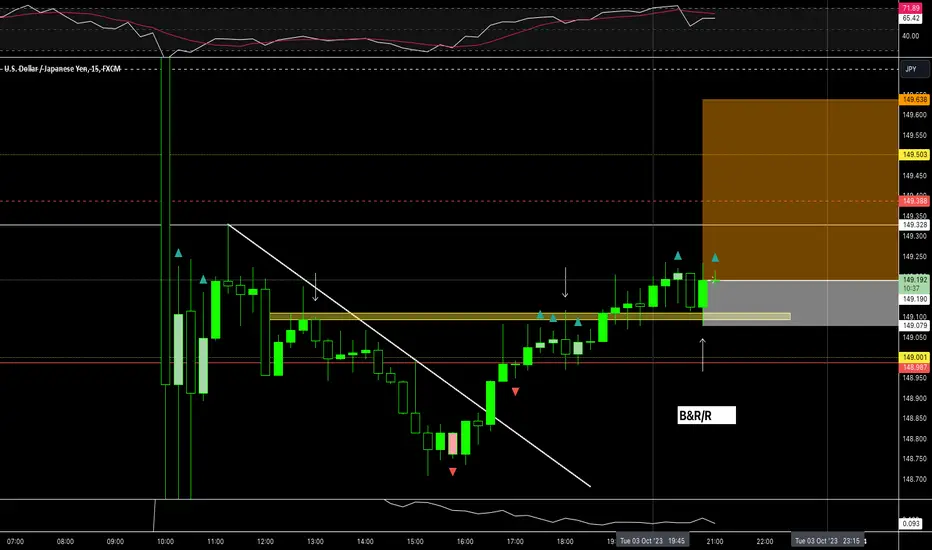
USDJPY BUYFX:USDJPY
Overall structure on USDJPY is bullish on the Weekly, Daily and 4H. Waiting for a break above 149.845 Daily resistance, then a retest to go bullish o USDJPY.
Breakandretest

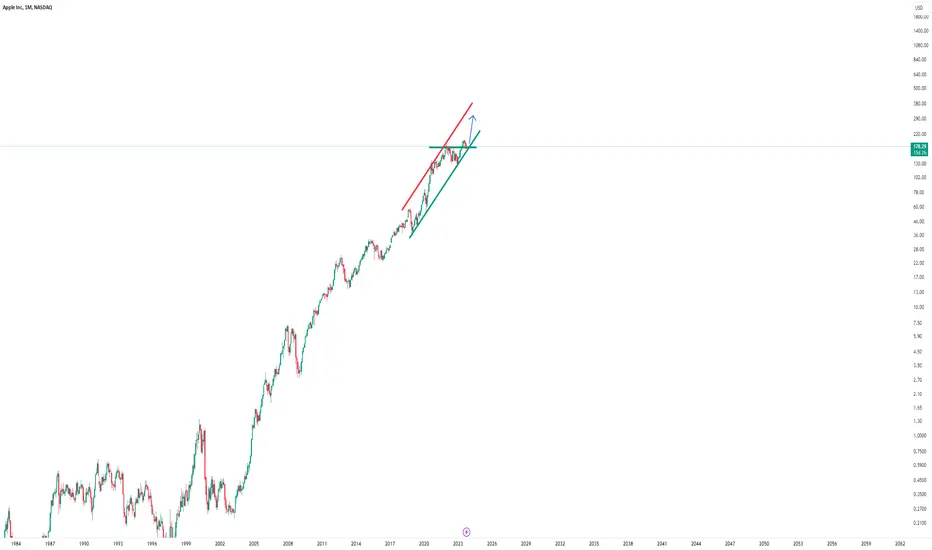
The historic +40% pattern on AppleHello Traders and Investors,
My name is Philip and I am a German swing-trader with over 4 years of trading experience.
I only trade the higher timeframes, preferably the monthly chart, because this allows me to capitalize on the major market swings.
I view trading as a long term game over the next 20 years which will help me to build massive wealth - it is not a get rich quick scheme.
-------------------------------------------------------------------
Today I want to share with you my outlook on Apple:
Apple is in a massive uptrend and if you look at Apple's chart over the past 20 years, there is no doubt that this was a crazy chart history. We also always had breaks and retests of the previous highs which were followed by crazy pumps and I do expect the same thing to happen again.
-------------------------------------------------------------------
Most of the people always follow the quick money. But the quick money is never the big money.
They think that making 5% a month consistently is reasonable, which is one of the reasons why so many traders fail.
The only think which you can control is your risk, everything else is unknown.
Keep your long term vision!
GU: “Break & Retest” Setup on “Momentum” Set Stop Entry (33/100)System has identified a “B&R” playbook setup and a potential “momentum” shift sell stop entry during the third hour of the LONDON 12-Candle Window.
RISK: 1R
TARGET: 4R
***DISCLAIMER***
This is a new system based strategy being live tested for the purpose of gathering data. The system generates between 3-6 signals per session upon detecting a qualifying setup and entry signal. Currently being tested only in LONDON and only using all GBP pairs. The win rate and expectancy are unknown. Please do not take these trades.

GBPNZD: “Break & Retest” Setup on “IBM” Buy Stop Entry (33/100)System has identified a “B&R” setup and a sell stop on the break of the inside bar for an entry executed during the second hour of the LONDON 12-Candle Window.
RISK: 1R
TARGET: 4R
***DISCLAIMER***
This is a new system based strategy being live tested for the purpose of gathering data. The system generates between 3-6 signals per session upon detecting a qualifying setup and entry signal. Currently being tested only in LONDON and only using all GBP pairs. The win rate and expectancy are unknown. Please do not take these trades.

GA: “Break & Retest” Setup on “Momentum” Buy Stop Entry (32/100)System has identified a “B&R” playbook setup and a potential “momentum” shift buy stop entry during the first hour of the LONDON 12-Candle Window.
RISK: 1R
TARGET: 2R
***DISCLAIMER***
This is a new system based strategy being live tested for the purpose of gathering data. The system generates between 3-6 signals per session upon detecting a qualifying setup and entry signal. Currently being tested only in LONDON and only using GBP pairs. The win rate and expectancy are unknown. Please do not take these trades.

XAGUSD LONG - POTENTIAL REVERSAL?Waiting for a retest of 22.490 to long XAGUSD back to 4H swing high at 23.716
If you agree drop a like and if you have any questions leave a comment :)

GBPUSD SELLFX:GBPUSD
Simple break and retest, waiting for a pullback to the 1.21779 4H resistance area to go short on GBPUSD

GBPJPY SELLFX:GBPJPY
Price on GBPJPY broke below the Daily support area simultaneously breaking the short term bullish structure on the 4H timeframe. This week I will be looking to go short on GBPJPY. A retest to 182.275 Daily resistance and/or a break and retest below 181.186 Daily support/resistance is were I will be looking to go short on GBPJPY.

Amazon (AMZN) -> Growing With E-CommerceMy name is Philip, I am a German swing-trader with 4+ years of trading experience and I only trade stocks , crypto , options and indices 🖥️
I only focus on the higher timeframes because this allows me to massively capitalize on the major market swings and cycles without getting caught up in the short term noise.
This is how you build real long term wealth!
In today's anaylsis I want to take a look at the bigger picture on Amazon.
Looking back at January of 2023 you can see that Amazon stock perfectly retested and already rejected the support trendline of the rising channel and also a previous resistance level.
With Amazon currently retesting resistance at the $141 level, I do expect a minor rejection but then I would love to see a break and retest and another push higher to retest the channel top.
- - - - - - - - - - - - - - - - - - - -
I know that this is a quite simple trading approach but over the past 4 years I've realized that simplicity and consistency are much more important than any trading strategy.
Keep the long term vision🫡

UJ: “Break & Retest” Setup on “Momentum” Entry (23/100)System has identified a “B&R” playbook setup and a “momentum” shift market entry during the second hour of the ASIA 12-Candle Window.
RISK: 1R
TARGET: 4R
***DISCLAIMER***
This is a new system based strategy being live tested for the purpose of gathering data. The system generates between 3-6 signals per session upon detecting a qualifying setup and entry signal. Currently being tested only in ASIA and only using USD/JPY pair. The win rate and expectancy are unknown. Please do not take these trades.

UJ: “Break & Retest” Setup on “Momentum” Entry (18/100)System has identified a “B&R” playbook setup and a potential “momentum” shift market entry during the first hour of the ASIA 12-Candle Window.
RISK: 1R
TARGET: 2R
***DISCLAIMER***
This is a new system based strategy being live tested for the purpose of gathering data. The system generates between 3-6 signals per session upon detecting a qualifying setup and entry signal. Currently being tested only in ASIA and only using USD/JPY pair. The win rate and expectancy are unknown. Please do not take these trades.

Dollar Index -> Plain And SimpleMy name is Philip, I am a German swing-trader with 4+ years of trading experience and I only focus on price action and market structure 🖥️
I am trading the higher timeframes because this allows me to massively capitalize on the major market swings and cycles without getting caught up in the short term noise.
This is how you build real long term wealth!
In today's anaylsis I want to take a look at the bigger picture on the Dollar Index.
Over the past couple of years, the Dollar Index has been trading in a quite solid rising channel and jusr recently perfectly retested and already started to reject the psychological $102 level. I do expect more continuation towards the upside to retest the upper resistance trendline.
- - - - - - - - - - - - - - - - - - - -
When the market moves where, and how, and if - these are all unknown.
The only thing which you can control is your risk.
- Philip Basic Trading -
Keep the long term vision🫡

Apple -> Break And RetestMy name is Philip, I am a German swing-trader with 4+ years of trading experience and I only focus on price action and market structure 🖥️
I am trading the higher timeframes because this allows me to massively capitalize on the major market swings and cycles without getting caught up in the short term noise.
This is how you build real long term wealth!
In today's anaylsis I want to take a look at the bigger picture on Apple.
Looking at Apple stock you can see that Apple just perfectly broke above the previous all time high which was at the $175 level and is now retesting this previous structure so I simply do expect another push higher from here and the creation of a new all time high soon.
- - - - - - - - - - - - - - - - - - - -
I know that this is a quite simple trading approach but over the past 4 years I've realized that simplicity and consistency are much more important than any trading strategy.
Keep the long term vision🫡

EURCAD break and retestclassic trading 101 break and retest on this pair, A sell confirmation is all is needed

UJ: “Break & Retest” Setup on “Momentum” Entry (12/100)System has identified a “B&R” playbook setup and a “rejection” market entry during the second hour of the ASIA 12-Candle Window.
RISK: 1R
TARGET: 4R
***DISCLAIMER***
This is a new system based strategy being live tested for the purpose of gathering data. The system generates between 3-6 signals per session upon detecting a qualifying setup and entry signal. Currently being tested only in ASIA and only using USD/JPY pair. The win rate and expectancy are unknown. Please do not take these trades.
GBPJPY SELLFX:GBPJPY
A break below Daily and Weekly support on an overall bearish structure. Waiting for a retest to the Daily and/or Weekly resistance to continue bearish move on GBPJPY

GBPUSD SELLFX:GBPUSD
Price on GBPUSD has broken below 1.21356 Daily support, currently waiting for a pullback to the 1.21356 Daily Resistance to continue seling GBPUSD

EURUSD SellFX:EURUSD
Break below support on Eurusd, currently waiting on a retest to continue selling

GBPJPY SELLFX:GBPJPY
Price on GBPJPY is consistently rejecting at Daily resistance. The Daily, 4H, and 1H time frames are bearish, hence we will have a sell bias on GBPJPY.

LVMH (MC) -> Buy The Stock Right Herey name is Philip, I am a German swing-trader with 4+ years of trading experience and I only trade stocks , crypto , options and indices 🖥️
I only focus on the higher timeframes because this allows me to massively capitaliz e on the major market swings and cycles without getting caught up in the short term noise.
This is how you build real long term wealth!
In today's anaylsis I want to take a look at the bigger picture on LVMH.
For the past 7 years LVMH stock has been trading in a decent rising channel and just recently retested and rejected the upper resistance trendline at the psychological 900€ level.
Also considering that this is a simple break and retest of the previous all time high from January I am just waiting for bullish confirmation before I think that another push higher will occur.
- - - - - - - - - - - - - - - - - - - -
I know that this is a quite simple trading approach but over the past 4 years I've realized that simplicity and consistency are much more important than any trading strategy.
Keep the long term vision🫡

EURAUDEA also gave us a nice break of structure. Looking for another bearish wave opportunity on this pull back/retest!


USDJPY ShortFX:USDJPY
A break above 147.788 Daily resistance followed by a retest on what is now Daily support means we should continue looking for buys on USDJPY. I am anticipating a continuation to the upside on USDJPY this coming week
