EURNZD: Bullish Confluence Aligns for Buy Setups at Key ArraysGreetings Traders,
In today’s analysis of EURNZD, we identify that the current institutional order flow is bullish. With this bias in mind, we aim to capitalize on high-probability buying opportunities from key points of interest aligned with institutional behavior.
Higher Timeframe Context:
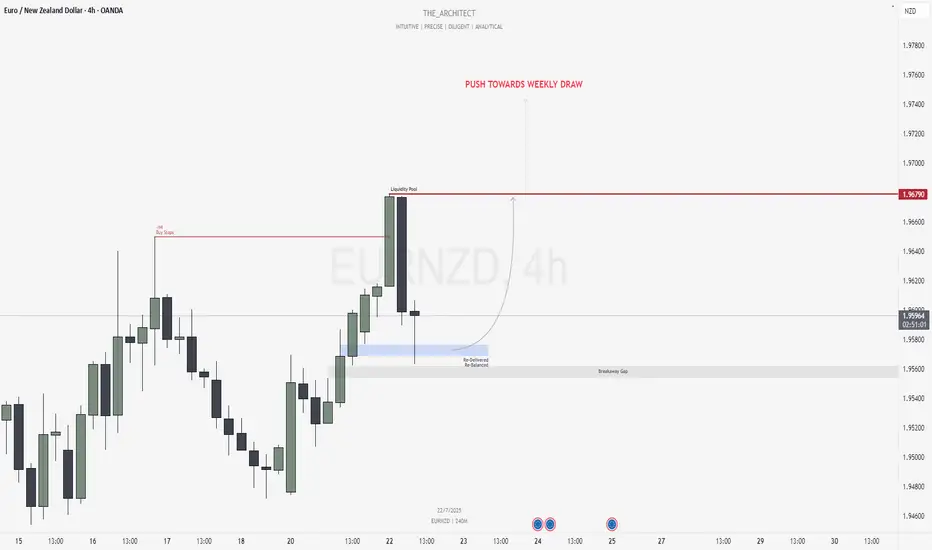
The weekly timeframe is showing a clear bullish narrative. This bullish order flow is confirmed by the H4 timeframe, which is also delivering higher highs and higher lows—providing confluence between both the macro and intermediate timeframes. This alignment increases our confidence in seeking long setups.
Key Observations on H4:
Buy-Side Liquidity Sweep: Price recently took out H4 buy stops, which triggered a retracement into internal range price action.
Re-Delivered Re-Balanced Zone (RDRB): Price has now pulled back into a re-delivered, re-balanced array—a significant institutional level that typically offers low-risk buy setups. Given the nature of this zone, we do not anticipate a deeper pullback into the fair value gap (FVG), thereby treating it as a potential breakaway gap.
Draw on Liquidity: The next probable target is the external liquidity pool resting in premium prices. The market appears poised to gravitate towards that area.
Trading Plan:
Entry Strategy: Monitor the lower timeframes for bullish confirmations within the RDRB array.
Targets: The primary target is the engineered liquidity pool in premium prices.
For a detailed analysis, please watch this weeks Forex Outlook:https://www.tradingview.com/chart/EURNZD/BZC9xW1L-July-21-Forex-Outlook-Don-t-Miss-These-High-Reward-Setups/
Remain patient, trust the structure, and execute with precision as the bullish narrative unfolds.
Kind Regards,
The Architect 🏛️📈
Breakaway
Correction: Counter Trend Break Away Pattern on 6-26This is a correction video representing the Counter-Trend mode of today's BreakAway pattern.
I created the first video thinking this was a Trending pattern.
Counter-trend patterns tend to reflect a reversal of price direction related to the last 3~5 days price trend.
In this video, I go over how I view Counter-Trend patterns vs. Trend/Carryover patterns.
Look for initial weakness in price followed by what I believe will be a strong rally phase this afternoon.
Here we go...

SPY Fibonacci Price Theory And BreakOut BarsThis instructional video teaches you the basics of Fibonacci Price Theory in conjunction with Breakout Bars and how price is the ultimate indicator.
Throughout this video, I try to provide instruction on key elements related to the Fibonacci Price Theory (Unique & Standout Highs/Lows). Additionally, I've also included Breakout Bars and Fibonacci Price Retracement concepts.
What I really hope you learn from this video is to see price as the true ultimate indicator for your trading decisions. Using technical analysis techniques is fine, but use price as the key element when trying to confirm or reject your trading ideas.
I hope this helps you understand that price, action, and reaction through trends, peaks, and troughs are the most important components of the chart. Everything else is peripheral.

CEINSYSTECH GAP Importance CEINSYSTECH Above image is showing the importance of break away cap gap the consolidation watch almost 2445 days and the structure got 305 to earlier closing 275
if we look the previous consolidation consolidation gives a sense regarding triangle compression that is a technical chart pattern
technical analysis after giving a gap stock has given a good chance of rally why we are discussing this because of educational purpose

Sustainability Stocks: ESAB ExampleNYSE:ESAB has been around for many years although it only went public on the NYSE as a Swedish-American company in 2022.
ESAB Corporation is focusing on sustainability and connected fabrication technology, which is an area headed for more growth.
The stock is 90% held by institutions. ALL of the giant Buy-Side and ETF developers are near the top of the Institutional holdings list.
The stock as been trending upward since its IPO bottom completion, which completed very quickly at $50. The company's revenues have been steady. Earnings have been up and down quarter over quarter. The recent gap up is a breakaway gap, which seldom fill.

📊#BTC BREAKAWAY PATTERN appears, is a reversal imminent?💥🧠By observing the chart, I discovered one of my favorite PA models, and the RSI trading system also gave a long signal. And the wedge support line is strong enough, and I still firmly believe that liquidity is needed as fuel before falling.
HOLD👀

📊ETH BREAKAWAY PATTERN appears, is a reversal imminent?💥✔️Such a PA model also appeared in ETH, and the RSI trading system also gave a long signal at the same time.
SL can be placed in 1622.
If you don’t know this model, I will make a tutorial and publish it later.
💕Follow me to learn more trading tips💯

UPWK - emerging from base (buy the dips)UPWK has been forming a base with neckline around 14.50 -15.35. Upon earnings announcement yesterday, it gapped up decisively on huge volume, rising a crazy 44%, and closing right at neckline.
What is clear is that it could be near the end of its base building and could begin to start trending up in the coming weeks.
The entry is tricky now due to its oversized move in a single day, hence I would prefer to see some pullback from here to look for opportunity to enter at the dips (fib-retracement level, candlestick reversal setups etc)
A more conservative approach is long only when it has cleared the neckline above 15.35. It may sound counter-intuitive to buy at hgher prices but in actual the odds of a sustainable trend is also increased when the stock is able to clear a significant resistence (namely, the neckline).
Disclaimer: Just my 2 cents and not a trade advice. Kindly do your own due diligence and trade according to your own risk tolerance and don't forget that money management is (probably the most) important! Take care and Good Luck!

RRGB - Great price action so far (buy the next dip)RRGB has the hallmarks of a stock that could potentially be a great winner. It broke out of it's base formation on 1st March on earnings beat with a strong breakaway gap (Breakaway gaps signify the beginning of a new trend and does not get filled in the near term).
It then proceeded higher over the next few days before pulling back to the breakup level @ 10.60 on 14 Mar, and then bounced right off again from there. This classic "break up and retest" establishes the neckline as the new "resistence turned support".
If one had been watching this stock, going long shortly after this "retest" would have been ideal.
However, since it is likely the trend is still in early stage, any near term dip (eg to fib retracement levels of 38-50%, or formation of bull pennant or flag etc) would still be a good opportunity to long. Let's see if the opportunity presents soon.
Disclaimer: Just my 2 cents and not a trade advice. Kindly do your own due diligence and trade according to your own risk tolerance and don't forget that money management is important! Take care and Good Luck!

Types of Gaps !!!👨🏫Hello👨🏻🏫, dear traders from all over the world🗺️.
I'm Pejman🙋🏻♂️ & welcome🌸 to one more educational adventure🧭 in Tradingview, but we will not be traders💹 today; We want to look at our charts like a hunter🏹.
We look for every clue🐾 we see so that we can hunt suitable positions💱 like valuable creatures💰 and transfer them to the cages as our accounts💳 or wallets💸.
Although I'm not too fond🙍🏻♂️ of hunting, either legally or illegally.
But I know that hunting good positions in the forests🏞️🌳 of Tradingview is not prohibited😉❗.
So let's get acquainted with these clues🔎 as soon as possible because the price is skittish🙈, and we don't want to waste the hunting time⏳✅.
I said that in Technical Analysis , we look for ways to trade by using the price information, which is recorded on the charts📈. (such as the prey's tracks🔎🐾)
Today I want to introduce one of these clues so that you can become a professional position hunter🏹 by identifying the clues👀;
But don't forget that you should practice🙌🏻, be careful⚠️, and watch your positions👀, so you don't miss them or rush 🏎️💨to the wrong❌ position🙂.
Today's clue is the GAPS . First, let's see what the GAP is🤔.
The gap is nothing. I mean, it is something that is nothing😶🙄.
It is incredibly paradoxical💥! I'm kidding😉, but the space between candles🕯️ or bars is called a GAP.
A gap is created when we see👀 a price gap between two candles🕯️ or bars when the trading volume is high⏫ or low⏬. This difference or space between two candles is called a gap🤏🏻.
It is said that gaps are more valuable✅ in higher time frames among the traders, so much coin, much care👀.
Gaps, or as the Japanese🎌 term "windows," are significant for hunting🏹 positions, so as hunter traders, we should learn these gaps well👌🏻.
The reason🧐 for creating gaps can be factors such as important positive🆒 or negative🙈 news or an increase🔺 or decrease🔻 in supply and demand.
It is interesting to know that gaps are primarily seen in Forex , Stocks , and Commodities (especially when markets close and open).
The space👌🏻 between the candles means that the price has jumped like a rabbit🐰 from one number to the upper☝🏻 different number.
Or, like a monkey🐒, it moved from one number to a lower👇🏻 number.
I tried to make it funny😊 and straightforward👌🏻, but these gaps that move up or down have different types, like the year's seasons🌈☁️.
We have 4️⃣ seasons in a year and also 4️⃣ types of gaps in the charts.
According to personal taste😊, I relate the gaps to the year's seasons and, simultaneously, do not forget the case of hunting positions🏹💰.
So fasten your seat belts💺 because we want to travel in time🧳⏳ to all the year's seasons with this post🚩 and learn about the different price gaps, which are one of our clues🐾 to trap positions🪤.
Let's start with the autumn🍂 season because we are still in it and can understand it better😌.
---------------------------------------------------------------------------------------------------------------------------------------------------------------------------------------------------------------
The name of this type of Exhaustion 🥱 gap.
They are seen at the end🔚 of a process, which means that the process may change🔄 at any moment.
Just like the autumn🍁 season, it may rain☔ anytime after seeing the clouds🌥️.
Another feature of this gap is the increase🆙 in trading volume, so by paying attention👀 to these points and practicing by reviewing the charts📈, you can easily recognize🔎 this gap.
---------------------------------------------------------------------------------------------------------------------------------------------------------------------------------------------------------------
The next💁🏻♂️ gap is the Breakaway 🏃🏻♂️ gap.
The breakaway gap is associated with an increase⤴️ in trading volume.
This gap occurs when a critical range is broken🤞🏻, representing a strong💪🏻 start🏁 trend or a sign of trend change.
Like the blooming🏵️ of some trees🌳 in winter☃️ or the sprouting🌱 of plants from under the snow❄️.
Also, This gap is created when the price starts moving from a limited area, like support or resistance ( I'm going to talk about them in the future😉. )
I have to say that the breakaway gap plays a critical👌🏻 role in some of the classic reversal patterns, such as the Head and Shoulders Pattern , Double Top/Bottom Patterns , etc.
When The breakaway gap is combined with Classic Reversal Patterns, the breakaway gap adds to these patterns' validity✅.
If you want to get acquainted with the most important Classic Reversal Patterns of Technical Analysis , I suggest you read the following post👇.
---------------------------------------------------------------------------------------------------------------------------------------------------------------------------------------------------------------
Now it's time for spring🌸🍀, and I'm going to introduce a gap like spring.
Spring season is a sign✌🏻 of the continuation of life💐, and this gap in technical analysis shows the continuation of a trend📈.
The Continuation gap is also known as a Runaway 🏃🏻♂️ gap, occurring in the middle of a downward↙️ or upward↗️ trend.
This type of gap creates a kind of confidence for traders to enter.
It doesn't occur when the price fluctuates or corrects in a limited area but occurs during a rapid increase or decrease.
So, as a result ☑️, if this gap occurs in an upward trend🔺, it indicates the continuation of the upward movement.
And when it is created in a downward trend🔻, it indicates the entry of more sellers and further price decline.
---------------------------------------------------------------------------------------------------------------------------------------------------------------------------------------------------------------
Now we have reached✌🏻 the last gap🥰.
This gap is Common , but I should introduce it as the summer☀️ season.
These gaps are very common, And considering the time frame it has, it is expected to fill quickly, which is also called "closing the gap."
The filling or closing of the gap means that the price returns🔁 to the same area where the gap was created, like a criminal returning to the crime scene😄.
This can be true✅ for gaps as well.
Time flies in summer🏝️, and Common and Exhaustion 🥱gaps fill as soon as a blink👁️.
You may have heard👂🏻 that gaps are always filled, but this is not permanent🙅🏻♂️ and only a strong possibility🤏🏻.
For example, Continuation 🏃🏻♂️ & Breakaway gaps usually take a long time⌛ to fill.
But what if the gap doesn't close🤷🏻♂️?
Go to any currency pair and examine👀 the recorded data🗄️; You will find that many gaps take a year or more to close.
It is interesting😃 to know that the Japanese🎌 have another interpretation of the price gap.
They use gaps as continuation and reversal trading patterns (as I said, I'll explain them in future posts🔜😉).
It is interesting to know that the combination of gaps can create the Island reversal pattern.
The Island pattern consists of two gaps ; One up⬆️ and one down⬇️.
We will definitely✅ learn more about these patterns in the following posts🔜, but today we are only focusing on the gaps🧐.
---------------------------------------------------------------------------------------------------------------------------------------------------------------------------------------------------------------
Another thing I want to add➕ is about the Heikin-Ashi charts💹 that we learned about in the previous post🔙.
Gaps are filtered❌ in Heikin-Ashi charts.
As I said, in this chart, the average is displayed between two✌🏻 consecutive candles; even candlestick patterns are filtered❌.
So, the type of chart is also essential👌🏻 for finding gaps.
Well, I gave you the basic tips to identify these gaps🤏🏻, and now you can carefully look👀 for them in your charts💹.
Practice this information for a bit, as I will be back soon🔜 with an educational post👨🏻🏫 on how to trade💰 with these gaps.
If you have any questions❓, you can ask me💬.
We will get acquainted with new clues🔎 in new posts, so until that day, take care of your knowledge📊 and increase it every day📈, because according to Kofi Anan:
Knowledge is power💪🏻, and information is liberating. Education📚 is the beginning of progress in every society🏙️, in every family👨👩👧👧.
I hope you become stronger🙌🏻 daily by using your knowledge, and I will also increase your progress by teaching you the introduction.
I wish🙌🏻 you happiness, health😍, and success😎.

W - strong price actionW had begun to form a saucer base pattern since Sep2022 (4 months basing), eventually cumulating to a break above it's neckline last Friday ( 20 Jan23) on very large volume. The following Monday on 23 Jan23, W announced it will cut 10% of its workforce and the market reacted by gapping the stock straight above it's 200 day moving average on yet another high volume day.
Since then it had pulled back a little, forming a potential bullish flag. Will the recent gap close soon? not necessarily, if it is a breakaway gap (which usually signify the start of a new trend). Can only wait and see.
Meanwhile, it is worth a shot to go long as long as it starts to break above the bull flag, with initial stop loss placed just slightly below the start of the gap @ 46.70. Trail stop up once the trade goes our way.
Disclaimer: Just my 2 cents and not a trade advice. Kindly do your own due diligence and trade according to your own risk tolerance and don't forget that money management is important! Take care and Good Luck!

Entry Points in NFLX Ahead of EarningsPlatforms ahead of earnings is an important pattern to watch for. Platform-building markets develop on the dominance of institutional investors buying quietly with controlled orders via the Dark Pools.
NFLX has a classic "quiet accumulation" pattern, also known as a Dark Pool buy zone. These platforms provide strong support for the bottom formation, especially since this was a breakaway gap.

NET - Breakaway Gap (huge volume!)NET gap out of a right angle triangle with extremely huge volume. This is likely to be a "breakaway gap" which usually occurs at the beginning of a trend and the odds of this gap closing in the near future is slim.
There is a near term possible resistance coming up (filling of a prior gap) at around 77-78. Any dips going forward should be opportunity to long as there is room on the upside.
Disclaimer: Just my 2 cents and not a trade advice. Kindly do your own due diligence and trade according to your own risk tolerance and don't forget that money management is important! Take care and Good Luck!

F - Breakaway Gap (Time to hop on?)F's downtrend started to flatten out from mid June (trading between 10:65 - 12.45), eventually breaking above the "neckline" @ 12.45 on 19 July. It retested this neckline a week later and held, giving conviction that this previous "resistence" is now a new "support".
Today it gapped up on strong volume as earnings had surprised to the upside. It is likely that some people had been betting on a good set of results since recently. The uptrend is likely firmer now.
Nibbling @ current price and looking to add if there is any dip over the next few days. However, the gap @ 13.20 might not fill anytime soon (breakaway gaps usually signify the start of a new trend and do not get filled in the near term).
Disclaimer: Just my 2 cents and not a trade advice. Kindly do your own due diligence and trade according to your own risk tolerance and don't forget that money management is important! Take care and Good Luck!

SPX: Did our BREAKOUT! What's next?Hello traders and investors! Let’s see how the SPX is doing today!
First, it broke our key point at 3,810 by doing a gap, making this a Breakaway Gap, a bullish continuation pattern. Now we are just doing what the index was supposed to, and it almost filled the gap at 3,900 today.
In addition, you may say that the SPX broke the neckline of an Inverted Head and Shoulder chart pattern as well. Either way, the bull trend was confirmed in the daily chart once again, and any pullback to the 21 ema or around the 3,800 would be just a pullback. As long as we stay above these support levels, or don’t do any clear bearish structure, the trend will remain bullish for now.
However, there’s one problem with all of this.
In the daily chart, the index is still bearish. We are doing lower highs/lows and it is under the 21 ema, which might work as a resistance for us. It is hard to tell how the SPX will react now that we finally hit the ema, but the key points mentioned in the 1h chart are still valid.
If we lose our support levels again, probably the index will do a top sign in the D chart, and it’ll resume the bear trend, as usual. So far, we don’t see any clear bullish structure on the daily chart.
The situation is quite complex, but if we keep our eyes on the key points, we’ll be fine. I’ll keep you guys updated every day, so remember to follow me to keep in touch.
Have a good weekend!

FB - could the low be in?FB hit a low of 169.589 on 27 Apr on high volume and then gapped up strongly the next day on even higher volume (due to positive earnings). There is a chance that it could have capitulated after having dropped about 56% from it's peak in Sept 2021.
It could stall around near term resistence (239 to 248) on the way up and I will not be too surprised if it starts to range. As long as it does not reverse back below the low of the gap candle (192.90), then the worst could be over. However, under the current market conditions, I will not expect it will be able to recover anywhere near it's all time high anytime soon.
Disclaimer: Just my 2 cents and not a trade advice. Kindly do your own due diligence and trade according to your own risk tolerance and don't forget that money management is important! Cheers.

LULU - expecting more upside in medium termLULU was forming an inverted Head & Shoulders (a potential sign of trend reversal), which eventually broke up strongly upon Earnings Release.
I would classify the gap that accompanied this breakup as a "breakaway" gap (gap that occurs at the beginning of a trend change, usually signifying the new trend has some room to move).
However it soon hit into a "horizontal support that now turned resistance" around 390 and has since been correcting from there. As I believe the uptrend as room (considering the breakaway gap), the recent pullback is likely a bull flag. I would long the breakup of this bull flag @ 369.5 with initial stop just below 358.
Scale out 1/3 position near 390 and hold the rest to see if it would break out of this resistence eventually.
Disclaimer: TA is about improving our odds of a successful trade (not a guarantee). This is just my own analysis and opinion for discussion and is NOT a trade advice. Please your own due diligence and trade according to your own risk tolerance and don't forget that money management is important! Cheers.

STAA - Likely bottomed outA downtrend that had reverted to forming a base in the past 2.5 months with "neckline" at 85.50 +/-.
There was a strong gap of abt 10% on 28 March on huge volume which hit right into the horizontal resistence around 85.50 and experiencing some pullback since.
As this is likely a "breakaway gap" (a strong gap that occurs at the begining of a trend reversal), the odds are in favour of a trend continuation in the direction of this gap. (ie up).
One could attempt to go Long at the break of the small pennant that has formed (around 82), however with near term resistence nearby at 85.50, it could be agonising days ahead while it attempts to break above this "neckline". Hence an alternative more "conservative" approach is to wait for the stock to have a close (preferably not too far) above the neckline before staking (ie wait for confirmation of "strength").
Either type of entries has it's merits (and risks). Hence appropriate stop loss (ie money management) is necessary to cut our losses should trade not work out.
Disclaimer: TA is about improving our odds of a successful trade (not a guarantee). This is just my own analysis and opinion for discussion and is NOT a trade advice. Please your own due diligence and trade according to your own risk tolerance and don't forget that money management is important! Cheers.

RBLX - Great Price Action with Breakaway GapRBLX was meandering sideways for 5 months before it staged a strong Gap to "all-time high", breaking previous high water mark @ 105. It then dipped briefly for the next 2 days, retacing 50% of its strong move up (AB).
The gap was partially filled before it quickly staged a strong rebound last Friday.
This chart has the hall marks of the start of bigger trend:
1. Strong breakaway gap out of a consolidation period and into All-time-high
2. Great volume since the breakup
It is likely that the near support is now at ~100, though conservative traders would put the initial stop loss just below it's recent pivot low @ 93.
Trail profits up for a bigger move or consider to scale out partially along the 1.618 and 2.00 fib extensions of CD swing up (~ @125 and 138 respectively) to protect profits.
Let's see if this trade works out!
Disclaimer: TA is about improving our odds of a successful trade (not a guarantee). This is just my own analysis and opinion for discussion and is not a trade advice. Kindly do your own due diligence and trade

PH had a strong earnings gap up!* Great earnings
* Very strong up trend
* High relative strength in the Industrial sector
* Broke out of a ~7 month consolidation period with very high volume (162.6% above average)
Note:
With very high volume on earnings, this very well may be a break away gap and may continue going higher from here.
Trade Idea:
* You can enter now and ride higher.
* Or you can look for buying opportunities near the $321.65 area
* A daily close below $321.65 would expose $311.70 as the next key support which should hold firmly.

QS LongDowntrend Wedge Breakout
Breakaway Gap
Gap above SMA50
WR buy signal
OBV>OBV34
Entry 24
Stop 20
Target 40
Risk management is much more important than a good entry point.
The max Risk of each plan should be less than 1% of an account.
I am not a PRO trader. I trade option to test my trading plan with small cost.
I created some tradingview scripts to improve my trading entries:
OBV and OBV SMA comparison;
Williams %R two lines;

Happy Days are Here Again!Irrational Exuberance! Bad news is good, good news is gooder!
The gaps tell all. Measured move from the runaway gap ought to end up around 388 +/- 2 pips.
There must be and certainly will be a pullback from a last exhaustion gap, may gap up sometime 1-3 Nov.
Fed minutes on 3 Nov may be catalyst for pullback. Likely pivots shown, 1/3 speedline most likely, given extreme fearless bullishness.
Can bull anywhere anytime from pullback to any of the levels shown. Not even attempting to guess where this might occur, get ready!
Final ATH TBD, might come in Dec for Santa Rally IMO. Would be a 5th of V EW, a monster. The subsequent break in 2022 will be spectacular...
Not advice, just A TOOLUSE TUTORIAL... REMEMBER THE TREND IS UR FRIEND TILL THE END AT THE BEND! GLTA!!

PLTR: A very Technical Bullish Thesis.Hello traders and investors! Let’s see how PLTR is doing today! This is an analysis, but we’ll have a lot of educational content as well, because PLTR has many patterns to talk about.
First, in the 1h chart, it seems we’ll reverse the short-term bear trend, as PLTR is doing a new high today, above the $ 21.70. This breaks the status quo , and it is something we haven't seen since the beginning of this bear trend, which started when PLTR triggered the Head and Shoulders chart pattern this month. This might be the start of something new.
If it reverses, we might use the Breakaway Gaps to guide us next. Remember: Gaps work as magnets. They are breakaway gaps because they are losing their support levels (purple lines). Keep in mind that we have 4 types of gaps: Breakaway, runaway, common and exhaustion.
There’s the idea of a Rounded Bottom pattern, as evidenced by the red line, and I find this pattern particularly hard to trade. It seems we can never tell if it is a true Round Bottom or not until we are already close to the target, which is the $ 23.39 , in this case.
It is not perfect, but it has a Piercing Line pattern in the daily chart, as evidenced by the yellow square. A Piercing Line occurs when the price opens in a gap, below the previous day’s low, closes near its high, and covers at least halfway of the previous bearish candlestick’s body.
What’s more, this pattern appeared just above the 61.8% Fibonacci’s Retracement.
All of this creates an interesting and technical bullish thesis for PLTR for the next few days.
What makes the situation more risky: The low volume in the daily chart, and the lack of bullish structure in the 1h chart (higher highs/lows). This makes me wonder if it’s too soon for PLTR, but the Risk/Reward ratio is good at this level. Either way, always use a good risk-management that suits your needs.
Remember to follow me to keep in touch with my daily updates, and support this idea if you liked it!
Thank you very much!
