EURUSD Breakdown Bearish Trend Continues or Demand Zone Reversal🔍 Chart Breakdown: EUR/USD (30-min TF)
Trend Overview:
Previous Trend: Bullish channel structure (highlighted in blue).
Current Momentum: Strong bearish breakdown following a clear range phase.
The chart shifted from consolidation → breakdown → aggressive bearish continuation.
🧱 Key Technical Highlights:
1. Bearish Breakout:
Price broke below the ascending trendline and exited the ranging box, confirming a bearish shift.
Multiple Breakdown Retests (highlighted with red arrows) confirming structure failures and validating resistance zones.
2. Range Zone (Distribution Phase):
Price moved sideways within the green rectangle (“RANGE”), indicating accumulation/distribution before the selloff.
The breakdown from this range confirmed bearish momentum.
3. Demand Zone Test (Now in Play):
Price is approaching/hovering around a demand zone (green box) marked as a critical support.
Buyers may react here, offering two key scenarios:
Bounce back to retest resistance around 1.1600 (highlighted).
Breakdown below demand, leading to further decline toward next major support zones (1.15354 and 1.15040).
4. Price Reaction Zones:
🔴 Resistance zones are clearly marked where breakdown retests occurred.
🟢 Demand zone with bounce-or-break logic provides directional bias.
🧭 Potential Scenarios (Marked on Chart):
✅ Bullish Case:
If demand zone holds, expect:
A corrective rally toward 1.1600–1.1620.
Watch for rejection signals here (could be ideal for re-entering shorts).
❌ Bearish Case:
If breakdown below green demand zone occurs, targets:
1.1535 (local structure support)
1.1504 (next confluence level; possible long-term bounce area)
📈 Indicators:
Ichimoku Cloud: Price is well below the cloud, confirming bearish control.
Structure: Lower highs & lower lows = confirmed bearish trend.
Breakdown

EURUSD LONG AND EDUCATIONAL BREAKDOWN ECB INTRESTRATE RELEASE The European Central Bank is expected to hold key rates for the first time in over a year on Thursday.
The Eurozone inflation rate has hit the ECB’s 2% target as the US-EU trade deal uncertainty lingers.
The EUR/USD pair could experience intense volatility following the ECB policy announcements.
The European Central Bank (ECB) is on track to leave its key interest rates unchanged after its July policy meeting, after having reduced rates at each of its last seven meetings. The decision will be announced on Thursday at 12:15 GMT.
The interest rate decision will be followed by ECB President Christine Lagarde’s press conference at 12:45 GMT.

RCI, Bear Flag On The Daily As Well As The 4hr Analyzing both the daily and 4-hour charts reveals a very prominent bear flag, which has formed following a steep decline. This pattern is often indicative of further downward movement, and it's hard to ignore the implications.
Word on the street is that they're currently in dire straits. Since the Shaw acquisition, they've hemorrhaged 11 billion in valuation. The situation is exacerbated by declining revenues and missed growth targets. In short, it's not looking promising.
If the trend continues downward, we might see the price testing the $19 USD mark sooner rather than later.
For those who are currently long on this or have any vested interest, it might be prudent to reconsider your position and cut your losses before it's too late.

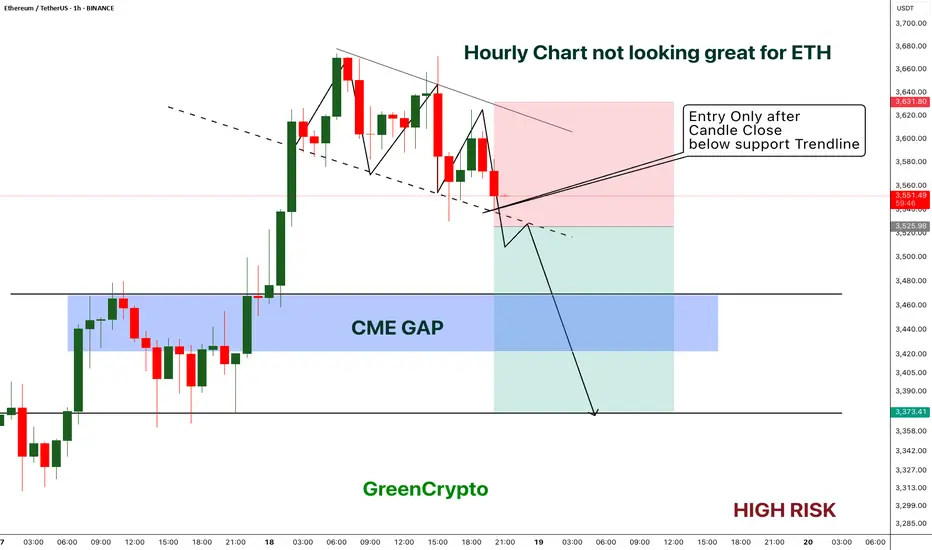
ETH - Short Trade with HIGH RISK- ETH got reject from resistance multiple times on 1H timeframe and now the price is playing near the support.
- I'm expecting overall market to cooldown this weekend, this could push the ETH to break the support
- ETH has CME gap around 3422 - 3467 range, im expecting this CME gap to be filled soon.
Entry Price: Below 3525
Stop Loss: 3631
TP1: 3471.15
TP2: 3381.76
Move SL to breakeven on TP1 hit.
Don't forget to keep stoploss.
Cheers
GreenCrypto
BTC Massive SetupConsolidation for months between 91k and 106k
- Classic Wyckoff setup as an accumulation/distribution
- Price targets of: 121.878 (122k is the popular target) to the upside with 75,827 on the down
- Saylor today put out news to be raising another $2 billion to buy BTC. Either he is going to be able to hold the floor or get washed out
- Trade can be taken with confirmation of breakout on either side pretty easily as momentum will be so strong that being on the wrong side will most likely be an immediate stop out

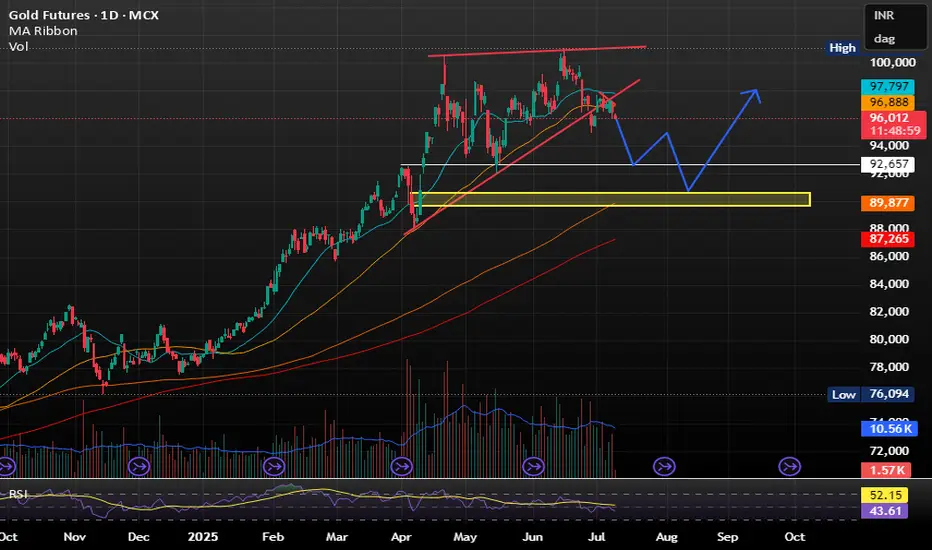
GOLD IS MELTING LIKE A ICEGOLD IS MELTING LIKE A ICE -
Trading below 20SMA and 50SMA making it less attractive at current price level.
ALSO RELATIVE STRENGH IS WEAKNING .
As per my view Sell on rise will be profitable for short term .
DOWNSIDE TARGET SHOULD BE WITHIN 92000 TO 90000 .
XLM ,1DAs BTC is Falling And BTC is given Breakout of Pattern in 4Hr , then Remaining coins will also fall drastically .
in 1D pattern of XLMUSDT , it is Breaking Down as BTC is also given Break Down of Pattern
Follow for More Ideas like This

Link, 1DAs BTC is Falling And BTC is given Breakout of Pattern in 4Hr , then Remaining coins will also fall drastically .
in 1D pattern of ADA USDT , it is Breaking Down as BTC is also given Break Down of Pattern
Follow for More Ideas like This

BTC , 4hr , BearishBTC is Forming a Pattern and it is at the top of the Another Pattern and It is facing rejection 3 Times from Above and now it is forming another pattern inside and Ready for Break Down of the Pattern , if it breaks the Pattern Down then it will be bearish almost 90% it will move to down side , if it has not given Breakdown and moving inside the small pattern then wait patiently and observe carefully .
Then it may also give Breakout for up side .
Follow Risk Management Properly
Follow for More Swing Ideas Like this .

Daily Outlook | XAUUSD June 30, 2025Hey traders,
Fresh week, clean structure. Let’s lock in the key levels and let price do the talking.
🌐 Macro Context
It’s a heavy week for USD – all major data drops before Friday:
Tuesday: ISM Manufacturing + Powell speaks
Wednesday: ADP Employment
Thursday: NFP, Unemployment Rate, ISM Services
Friday: US holiday – markets closed
📌 This means liquidity will build into Thursday, then fade. Expect gold to stay range-bound early in the week, unless momentum shifts hard today. Volatility should peak around NFP.
🧭 Daily Structure & Bias
Gold opened weak under 3287, still below 21EMA and 50EMA. The structure shows lower highs, bearish control, and no signs of strength reclaiming ground. RSI is at 42 — momentum down, but not oversold yet. Unless price breaks back above 3340, sellers stay in control.
✅ D1 Bias: Bearish while under 3340
📌 Key D1 Zones to Watch
🔺 D1 Breaker Block – 3340–3355
Former support, now clean resistance. Includes 50EMA and last failed closes. If price rejects again here, bearish continuation likely. A daily close above 3355 flips short bias.
🔺 D1 Supply + FVG – 3385–3405
Unmitigated imbalance from early June. If price pushes through 3355, this is the next upside magnet. Good spot for first reaction.
⚖️ D1 Decision Zone – 3287–3265
Current price zone. Multiple past reactions. A daily close below 3265 confirms breakdown. Holding above = more choppy range.
🟢 D1 Reaction Shelf – 3210–3180
Minor support zone from April candle bodies. Can slow price, but not strong enough for reversal on its own.
🟢 D1 Demand Block – 3155–3120
First major HTF demand. Includes 200EMA, strong structure, and previous breakout base. If price sells into it fast, watch for rejection — but only with confirmation.
🟢 D1 Macro Demand – 3090–3055
Final line of macro defense. Clean imbalance + demand from February. Valid only if sentiment breaks post-NFP.
✅ Final Summary
• Below 3265 = structure breaks → opens 3180
• 3155–3120 = real support zone
• Below 3120 = macro shift risk
• Reclaiming 3340 = short bias invalid
• Break above 3385 = continuation possible
📌 Today is all about the close. No confirmation = no trade. Thursday is the real trigger — be positioned, not exposed.
—
📣 If this gave you clarity and structure, drop a 🔥, share your bias, and follow GoldFxMinds for sniper plans with zero fluff — only clean, confirmed price action.

Bitcoin Dominance Update – Key Levels in Play!Hey Traders!
If you’re finding value in this analysis, smash that 👍 and hit Follow for high-accuracy trade setups that actually deliver!
BTC Dominance is testing a major resistance zone after a sustained rally from late 2024. The structure is showing signs of exhaustion near the 64-65% zone.
🔶 Pattern: Rising wedge breakdown
🔶 Current Action: Retesting broken support zone as resistance
🔶 Key Resistance: 64.5% - 65%
🔶 Rejection zone: Strong supply sitting overhead
Why this matters for Altcoins:
A rejection from this zone could open the door for capital rotation into altcoins.
BTC dominance stalling = potential for ETH, SOL, and midcaps to gain momentum.
If dominance goes down, it may keep altcoin rallies capped for now.
Monitor closely — dominance breakdowns often align with altseason rotations.
💡 Stay patient, stay prepared.

#BTC/USDT: Head & Shoulders Breakdown – $95K Incoming?Hey Traders!
If you’re finding value in this analysis, smash that 👍 and hit Follow for high-accuracy trade setups that actually deliver!
Bitcoin just broke below the neckline of a clear Head & Shoulders pattern on the 4H timeframe — a classic bearish signal.
As long as price stays below the neckline and fails to reclaim the $106.5K zone, we could be heading for a deeper correction toward the $95K–$98K support range.
Key Levels:
Breakdown Zone: ~$103.9K
Downside Target: $95K–$98K
Invalidation: Reclaim above $106.5K
Market is showing consistent weakness — small bounces are quickly sold off.
Let the pattern play out and manage your risk accordingly.
What do you think — short-term dip or deeper breakdown loading?

Breakdown Alert: Crypto Market Cap Tests Major Demand ZoneThe total crypto market cap is testing a key support zone around $3.23T. This area has acted as a demand zone in the past, and now price is hovering right above it.
The current structure suggests a possible breakdown–retest–continuation setup. If price retests this zone from below and fails to reclaim it, further downside toward $3.0T could be likely.
This idea is based on price action and structure only — no indicators used.
❗ This is a personal analysis for educational purposes only. Not financial advice.
Feel free to share your thoughts or technical perspective in the comments

"SOL Market Cap Breakdown Setup| Bearish Retest Targeting 83.3B"SOL Market Cap is showing signs of a potential breakdown after a series of lower highs and a bearish retest of previous support. Price is currently retesting the breakdown level. If confirmed, the next support zone is near 83.3B.
This is a technical analysis-based observation, not financial advice. Always manage risk and confirm with your own strategy before making any decisions.

DOGE|Bearish Triangle Formation On30-Min Chart-Breakdown Ahead?📉 DOGE Bearish Triangle Breakdown | 30-Min Chart
This chart highlights a classic *bearish triangle formation* in DOGE's market cap on the 30-minute timeframe. The pattern shows a series of lower highs with horizontal support around the 32.45B zone.
🔍 Key Observations:
- Pattern: Bearish Triangle
- Resistance: ~34.7B
- Support Zone: ~32.45B
- Target Zone (Post-Breakdown): ~31.3B
A breakdown below the support level could signal further downside movement. However, confirmation is key — traders should watch for volume and candle close below support.
🕒 Timeframe: 30-Minute Chart
📆 Analysis Date: May 29, 2025
---
⚠ *Disclaimer:*
This analysis is shared purely for *educational purposes* and does not constitute financial advice. Please do your own research and risk management before making any trading decisions.

EURGBP - NEW BREAKDOWNHello Traders !
The EURGBP reached the resistance level (0.87176 - 0.87660) and failed to break it !
The price broke the support level (0.84736 - 0.84322).
So, I expect a bearish move📉
______________
TARGET: 0.83450🎯

BTC DOMINANCE AT CRUCIAL LEVEL! When Alt season? 🚀 Hey Traders! 👋
If you’re finding value in this analysis, smash that 👍 and hit Follow for high-accuracy trade setups that actually deliver! 💹🔥
Bitcoin dominance is once again hovering around the key resistance zone (~64%) that previously triggered a sharp rejection and boosted altcoins. 🚨
🟢 What we're watching:
Dominance bounced back after a breakdown from the rising wedge 📉
It's now retesting the breakdown zone (red resistance)
A rejection here = Altcoin Rally 🎯
A clean breakout above = Altcoins stay weak ⚠️
⏳ We’re at a decision point. Altcoin bulls are watching this zone very closely.
🧠 Our take:
Until BTC.D rejects from this level, don’t expect a full-blown Altseason. A strong red candle from here could open the floodgates for mid and low caps to run wild again. 🚀
📌 Stay patient, stay positioned. The move will be big—just a matter of “when.”

USDCAD - NEW BREAKDOWN !Hello Traders !
After a huge bearish move, The USDCAD price broke the support level (1.37506 - 1.37814).
This key level becomes new resistance!
So, I expect a new bearish move📉
_______________
TARGET: 1.36480🎯

GBPJPY - Important BreakdownHello Traders !
The GBPJPY failed to create a new higher high.
The price broke the support line!
So, I expect a bearish move📉
________________
TARGET: 190.680🎯

NATGAS - NEW BREAKDOWN !Hello Traders !
The Naturalgas price failed to create a new higher high!
The higher low is broken (change of character).
So, I expect a bearish move📉
_____________
TARGET: 3.0950🎯

CHFJPY - BEARISH MOVEHello Traders !
On Tuesday 13 May, The CHFJPY reached a strong resistance level (176.482 - 176.010).
The price broke the higher low (change of character).
So, I expect a bearish move📉
________________
TARGET: 173.280🎯

CADJPY - Bearish Rising WedgeHello Traders !
The CADJPY price formed a rising wedge pattern.
The price broke the support line.
So, I expect a bearish move📉
_______________
TARGET: 103.655🎯

GOLD - Bearish Double TOPHello Traders !
The GOLD failed to create a new higher high !
The price formed a double top pattern.
Currently, The neckline is broken !
So, I expect a bearish move📉
________________
TARGET: 3022🎯
