QNT is breaking down!?After trading in range for 10 days Quant is trying to break the support of the structure at $93.
First important support to watch for longs (if holds) is around $68.
In case Bitcoin crashes to $17k or even lower, QNT is likely to break $50 again.
To enter in a long-term bull market QNT needs a clean break above $150.
Breakdown

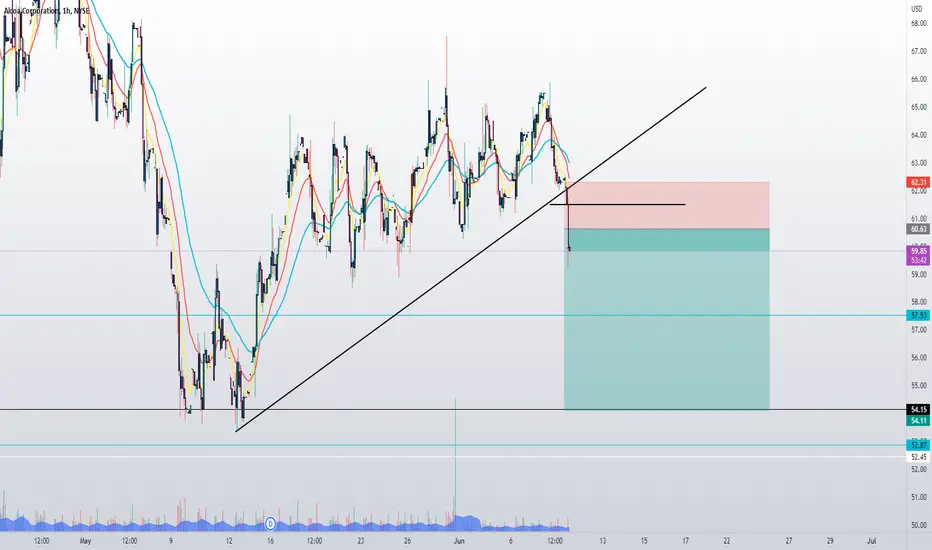
A BUNCH OF CANDLES...this setup low key looks like a chaos but i just thought it to be kinda cool, so im posting it here just for the record. apple's doing all sorts really. oh and also i think the price will go down eventually next week cause of the bearish candle and the resistance.
Happy Trading !!!

USDCAD | New perspectiveThe USDCAD appears to be aiming for a bullish moment in the new week after identifying multiple rejections of the 1.28500 area by the buyers. However, we cannot ignore the possibility of a bearish momentum drive after witnessing the breakdown of the bullish trendline identified in the daily timeframe.
Risk Disclaimer:
Margin trading in the foreign exchange market (including commodity trading, CFDs, stocks etc.) has a high risk and is not suitable for all investors. The content of this speculation (including all data) is organized and published by me for the sole purpose of education and assistance in making independent investment decisions. All information herein is for your reference only and I take no responsibility.
You are hereby advised to carefully consider your investment experience, financial situation, investment objective, risk tolerance level, and consult your independent financial adviser as to the suitability of your situation prior to making any investment.
I do not guarantee its accuracy and is not liable for any loss or damage which may result directly or indirectly from such content or the receipt of any instruction or notification therewith.
Past performance is not necessarily indicative of future results.

USDJPY | Perspective for the new weekDespite its continued rampage in the currency markets, reaching quarter-century highs against the Yen, I am of the opinion that we might be witnessing a temporary retracement in the coming week in anticipation of a trend continuation in the nearest future. This video explains how I intend to take advantage of this opportunity.
Risk Disclaimer:
Margin trading in the foreign exchange market (including commodity trading, CFDs, stocks etc.) has a high risk and is not suitable for all investors. The content of this speculation (including all data) is organized and published by me for the sole purpose of education and assistance in making independent investment decisions. All information herein is for your reference only and I take no responsibility.
You are hereby advised to carefully consider your investment experience, financial situation, investment objective, risk tolerance level, and consult your independent financial adviser as to the suitability of your situation prior to making any investment.
I do not guarantee its accuracy and is not liable for any loss or damage which may result directly or indirectly from such content or the receipt of any instruction or notification therewith.
Past performance is not necessarily indicative of future results.

GBPNZD | Perspective for the new weekPrice action has been caught within a supply and demand sandwich in the last 3 months to confirm the indecision that has gripped the market after a bearish prior leading price action. Could we be expecting a bearish momentum this week? In this video, I explained how we could take advantage of a bearish momentum if we finally witness a breakdown of the bullish trendline identified in the daily time frame.
Risk Disclaimer:
Margin trading in the foreign exchange market (including commodity trading, CFDs, stocks etc.) has a high risk and is not suitable for all investors. The content of this speculation (including all data) is organized and published by me for the sole purpose of education and assistance in making independent investment decisions. All information herein is for your reference only and I take no responsibility.
You are hereby advised to carefully consider your investment experience, financial situation, investment objective, risk tolerance level, and consult your independent financial adviser as to the suitability of your situation prior to making any investment.
I do not guarantee its accuracy and is not liable for any loss or damage which may result directly or indirectly from such content or the receipt of any instruction or notification therewith.
Past performance is not necessarily indicative of future results.

SEE THIS BEFORE TAKING ANY LONG POSITION! ALTPERP UPDATE!!Hello everyone, if you like the idea, do not forget to support with a like and follow.
Welcome to this ALTPERP update.
Here is the 3hr chart of Altperp. Altperp is a index which we can use while we trade in futures Altcoins.
As you see in the chart, Altperp is retesting the symmetrical triangle after the breakdown. After this successfully retest we can expect a drop in this index so we can see drop in Altcoins too.
So imo it's a bit risky to taking a long position here.
Invalidation level:- If it break above the triangle then this chart become invalidated.
If you like this idea then do support it with like and follow.
Also, share your views in the comment section.
Thank You!

GBPUSD | New perspectiveIn this video, I have explained my plans of taking advantage of a potential bearish momentum.
Risk Disclaimer:
Margin trading in the foreign exchange market (including commodity trading, CFDs, stocks etc.) has a high risk and is not suitable for all investors. The content of this speculation (including all data) is organized and published by me for the sole purpose of education and assistance in making independent investment decisions. All information herein is for your reference only and I take no responsibility.
You are hereby advised to carefully consider your investment experience, financial situation, investment objective, risk tolerance level, and consult your independent financial adviser as to the suitability of your situation prior to making any investment.
I do not guarantee its accuracy and is not liable for any loss or damage which may result directly or indirectly from such content or the receipt of any instruction or notification therewith.
Past performance is not necessarily indicative of future results.

BTC: Daily outlook of the 20k-22k range consolidationPrice has been rejected from the 22500 resistance.
To be fair, this is the most significant resistance we have on the chart right now considering that it is both a daily resistance and the 200W MA which has been acting as support in the past and should now act as resistance.
The way I see it there are two basic scenarios here:
A) Bullish Scenario:
The price manages to consolidate between 20500-22500 while printing higher lows.
This would appear as a mirrored triangle on the charts and it basically means seller exhaustion.
Those formations are usually bullish, thus, once we break 22500 we should see a significant move to the upside.
In every breakout to the upside the first important resistance is usually the most significant, therefore, if 22500 break I think we should be looking for a mean reversion rally to the 28k-32k cluster. Don't fade it too early.
B) Bearish Scenario
Should the price loses 20500 on a daily level (print at least 2 days below 20k) I would expect to see a short consolidation (desperate attempts to reclaim 20k level) followed by a breakdown.
In that case any retest of 20k level is a potential sell or opportunity to close any underwater longs that you may have.
In that case I don't necessarily think we will go very low. Not that we couldn't but in my opinion there's gonna be interest around the 15.8k - 16.6k area. Maybe even a bounce from previous lows (17.6). So, don't leverage your shorts.
If this helped you in any way please give it a like. ty!

Dont think there is enough demand to push out of this downtrendLooks like this 8 day uptrend is about to deteriorate depending on what #BTC does

#BTC: CONSOLIDATION GOING ON! EXPECTING A UPWARD RALLY SOON!!Hello everyone, if you like the idea, do not forget to support with a like and follow.
Welcome to this BTC update.
BITCOIN strong consolidation going on at $20k level, this can't go on forever, triangle primed to break to upside or downside. But RSI is printing bullish divergence though.
BTC going above $21,800 makes a higher high, and going below $18,800 makes a lower low, and the next move likely sets the direction forward.
If you like this idea then do support it with like and follow.
Also, share your views in the comment section.
Thank You!

USDT DOMINANCE READY TO FALL! BULLISH FOR BTC AND ALTS!!Hello everyone, if you like the idea, do not forget to support with a like and follow.
Welcome to this USDT Dominance update.
USDT Dominance is looking in favor of BTC now. Currently, it is breaking down from the triangle pattern in 4hr time frame and now retesting the triangle. After this successful retest, we can expect a good drop-in USDT Dominance. As you know USDT Dominance is inversely proportional to the BTC, so we might see a good rally in BTC and Alts in the month of July.
If this pattern plays out successfully then we see $26k-$28k for BTC on board in the month of July.
Invalidation Level:- If USDT Dominnac breaks above the triangle (8.0 level) then this bearish pattern will be invalidated and we might see a new low in BTC.
What do you think about this?
Do you think that we might see a bullish rally in July month or do you think that we see a new low this month?
Share your views in the comment section.
If you like this idea then do support it with like and follow.
Thank You!

Volume Profile and why you need it.Volume profile is an underused and quintessential part of trading, it tells you build up of orders, it tells you fair price, and it tells you where the majority of the liquidity is.
You can see in this chart, I have taken it apart piece by piece to show you the basic mechanics and why price moves the way it does, now be honest, how many of you rushed into selling GU last minute because the price was collapsing? Well the funny thing is despite not being alone in doing so in the retail trading world, big banks and instituitions were already two steps ahead as expected, check the Volume profile, notice how it declined on a massively falling currency, what this is telling you is that the amount of exchanges is very low, as the shorters pushed price down they began to close positions, also what would have happened is the amount of retail money and money that isnt associated to high end firms would have started to see negative positions so what do they do? they have to close these sells with buys! so not only are the big banks taking profit, they are also using you as rocket fuel! as the masses of small money becomes negative/trapped/stoplosses, price reacts in an equal and opposite reaction, price rallies. So where is price heading too? it is heading back to an area where it can happily trade, and this is shown by larger bars on the VP, price wants to be happy, to be happy it needs to transact alot! So two takeaways... One, dont rush into falling or rising currencies! as they are heading into areas of low volume and will use mean reversion to run you over... Two, Utilise the fact price has low VP build up to your advantage! use price action and catch moves like that GU rally back to an area of more transactions! and a final little trick, use the VP to tell you if your orderblock is real or a figment of your imagination! feel free to drop some questions below, I may have to make more posts on VP for it to make sense. Maybe I will also make some posts on examples of trading using it, and what to do and not to do. Thinking about it, there is more posts to do, I need to show how to trade mean reversion and 'mountain to mountain' tactics. Hope you find this post interesting, as I take a journey of taking back the layers of many traditional strategies, indicators and the deeper world of maths, I am doing this to try help new traders actually get somewhere! So please give me a like and a follow, I want to expand my reach here on tradingview :) All the best ZenFlo.

BTC: THIS SUDDEN PUMP IS JUST A RETEST! STILL BEARISH!!Hello everyone, if you like the idea, do not forget to support with a like and follow.
Welcome to this quick BTC update.
BTC took a sudden pump after hitting $18.5k level and it reached to almost $21k level. But this sudden pump of BTC is does not looks good at all.
As you see in the chart, This is just a retest after breaking down from the symmetrical triangle and looks like it is ready to fall again. According to the pattern target is $16k
Invalidation level:- If BTC breaks above the upper trendline of the triangle which is at around $21,300 then this chart becomes invalidated.
What do you think about this?
Do you think it will pump again or do you also think that we see a dump from here.
Let me know your views in the comment section.
If you like this idea then do support it with like and follow.
Thank You!

BTC: BREAKS DOWN! EXPECTING A MOVE TO THE DOWNSIDE!!Hello everyone, if you like the idea, do not forget to support with a like and follow.
Welcome to this quick BTC update.
BTC is not looking good here. Tried many times but not able to break the $22k resistance level. Now it's breaks down from the symmetrical triangle pattern in 2hr time frame. I'm expecting a 10-15% move to the downside.
Resistance:- $22k
Supports:- $19.8k/$18k
If you like this idea then do support it with like and follow.
Also, share your views in the comment section.
Thank You!

Is Bitcoin creating a Bearish Pennant?Hello traders of tradingview! I would like to thank each and everyone of you for supporting my last chart i posted.
Please if you haven't yet already go check that chart out i have it linked at the bottom it is titled Psychology of a
market cycle. Please also make sure to LIKE and FOLLOW for more VALUABLE content!
What i expect is a slow gradual decline in Bitcoin's price ultimately finding support around $19,500 where
i would expect Bitcoin to bounce from that level back up to recent local high around $21,800's. I would be looking
to short $21,800 back down to about $20,000. At that point Bitcoin will have started to form a visible bearish pennant . I would
expect yet again another retest of trendline resistance at or around $21,000 creating a defined bearish pennant .
How to short the breakdown? 2 different ways i would short this trade setup.
1. For the best risk to reward ratio you could enter a short position at the top of the trendline resistance when Bitcoin is nearing
the apex of the bearish pennant . Place a stoploss at or around $22,000 using low conservative leverage and patiently wait for
the breakdown.
2. The other way to short this is by shorting the breakdown. Which means you would wait till Bitcoin approaches its trendline support
on its 4th test of trendline support it will likely breakdown as long as the apex of the bearish pennant is no more than a few days away.
Enter your short using low leverage and place stoploss above trendline resistance.
BEARISH PENNANTS
Bearish Pennants are simply the opposite of the Bullish Pennant . Bearish Pennants are continuation patterns that occur in strong downtrends. They always start with a flagpole – a steep drop in price, followed by a pause in the downward movement. This pause forms a triangular shape, known as the Pennant . There is then a breakout, and the downward movement continues. Traders look to enter short trades on a break below the pennant .
KNOWING THE DIFFERENCE BETWEEN PENNANT PATTERNS AND TRIANGLE PATTERNS
Pennant patterns are very similar to triangle patterns, but there are some important differences between a crypto Pennant and a crypto triangle that should be acknowledged in order to trade either pattern successfully.
These are the key differences to note:
A Pennant pattern has to be preceded by a strong up or down move that resembles a flagpole. If there isn’t a flagpole, then it's a triangle and not a Pennant .
A Pennant tends to form a shallow retracement (typically less than 38% of the flagpole). A deep retracement is indicative of a triangle rather than a Pennant .
A Pennant is characterized by the continuation of the upward or downward trend.
A Pennant is a short-term pattern that is usually completed within one to three weeks. A triangle pattern usually takes much longer to form.

Band ready to hit 1$ soonAs you can see BAND just printed a bearish flag in a 4h time frame chart.
Taking in to account the current market situation i think that we can expect a retest of the lower trend line of the flag.
That is too a retest of the 55 4h exponential moving average and the retest of a strong broken support.
I will open a short position at 1.428$ with stop loss at 1.56$ and targets 1.01$, 0.76$ and 0.57$.
I will be glad to see what do you think in the comments and if you agree with me don't forget to give me a like, it helps a lot.

BNB is flirting with Hades!It broke $212 crucial support. Next short-term stop is at $140, but is a weak one.
Unfortunately, the next strong support is way way down to $45.

ETH: NOT LOOKING GOOD IN LTF! READY FOR A NEW LOW!!Hello everyone, if you like the idea, do not forget to support with a like and follow.
Welcome to this ETH update.
ETH is not looking good here in 1hr time frame. It is forming a symmetrical triangle-like pattern. ETH was rejected multiple times from the resistance line and now breaks the support line as well.
I'm expecting a 15-20% drop from here in ETH price. As you know when ETH drops many altcoins will also follow. So stay cautious and trade carefully.
If you like this idea then do support it with like and follow.
Also, share your views in the comment section.
Thank You!

ITC interesting chart patternAll details are given on chart. If you like the analyses please do share it with your friends, like and follow me for more such interesting breakout charts.
Disc - Am not a SEBI registered. Please do your own analyses before taking position. This post is only for educational purposes and not a trading recommendation.


GBPAUD | New perspective The identification of a strong bearish impulse leg on the 4H time frame which was followed by a retracement into the 61.8/78.6% appears to be a clue into the strength of the sellers at this juncture in the market.
Risk Disclaimer:
Margin trading in the foreign exchange market (including commodity trading, CFDs, stocks etc.) has a high risk and is not suitable for all investors. The content of this speculation (including all data) is organized and published by me for the sole purpose of education and assistance in making independent investment decisions. All information herein is for your reference only and I take no responsibility.
You are hereby advised to carefully consider your investment experience, financial situation, investment objective, risk tolerance level, and consult your independent financial adviser as to the suitability of your situation prior to making any investment.
I do not guarantee its accuracy and is not liable for any loss or damage which may result directly or indirectly from such content or the receipt of any instruction or notification therewith.
Past performance is not necessarily indicative of future results.

Bitcoin to 16k this week!In this video i am explaining where i think we are going to go from here and also i'm looking at the 4 hourly, daily, weekly and monthly chart, as well i am looking at inflation rate chart and DXY.
This is my second video and i hope you'll like it. Also i'm sorry for my speaking mistakes, I'm trying to improve my english.
And also i forgot to mention that i am still in my short position from the top of the range at 32400k.
What do you think about my second video and analysis ?
Feel free to leave a comment.
If you like my ideas please follow me and like because you can always find something interesting on my profile, i am new to Treadingview but i have 6 years expirience in trading.
DON'T SELL YOUR CRYPTO
BTC TO THE MOON!!!
