Short 💥 Bearish Wedge, Bearish PennantOur AI expects further dump on BTC.
The price broke down from a Bearish Wedge.
A pennant here means Bearish continuation.
Breakdown

Bearish Wedge 🔻 Target Price: $45k, Leverage: x2.5Bearish Wedge 🔻 Target Price: $45k, Leverage: x2.5
Who are we?
We're a small group of Artificial Intelligence (AI) researchers primarily from Russia.
We developed an AI ("OXY AI bot") for detecting technical analysis patterns on multi-timeframe charts.
Our bot recognized a bearish wedge on this chart.
- So, we opened a short position until $45k (lev.: x2.5).
(Please note that I share it in the UTC time-zone.)


BTC RISING WEDGE 4H - Short setupBtc-Usdt in a bearish rising wedge
Short on breakdown confirmation
No financial advice
Targets on arrows

GOLD - Severe Technical Damages on Daily ChartAfter touching 1680 in Asia morning session, gold has had rebounced to 1750. This 1750-1760 area used to be support, now turnes resistance which proves to be a pivot area. A breakdown under 2018-2019 uptrend line is in progress.
The daily chart shows severe technical damages with combination of death cross, trendline breakdown, and negative MACD.
Unless gold is able to recover above this pivot area or the uptrend line, gold might again head to 1660-1680 support area.

💙 Proof: How I earned +788% within 6 hours 💙 Proof: How I earned +788% within 6 hours
BTC/USD market (+100% success rate, +340% profit):
- Short :boom: Bearish Wedge:
- Long :green_circle: Bullish Wedge:
- Short/Long :black_large_square: Combined Wedge:
- Short (HFT) :boom: Bearish Flag:
- Long :green_circle: Bullish Wedge:
ETH/USD market (+100% success rate, +448% profit):
- Short :boom: Bearish Wedge:
- Short :boom: Bearish Flag:
That's yesterday, and now, we can see a bearish pennant on the 4-hour chart.
We bet on short once again.

Short (HFT) 💥 Bearish FlagShort (HFT) 💥 Bearish Flag
It's a High-Frequency Trading (HFT) idea, which means a short-term view (15-minute).
For our medium-term idea, see: "Short 🩸 Blood Bat Drinks Bull Blood".
KEY POINTS:
- There's a Bearish Flag pattern (red trendlines) on the chart
- The upper trendline of the "channel" blocks upside movement
- The Bulls are under pressure to keep up with the channel, or breakdown (dump) comes
We short.

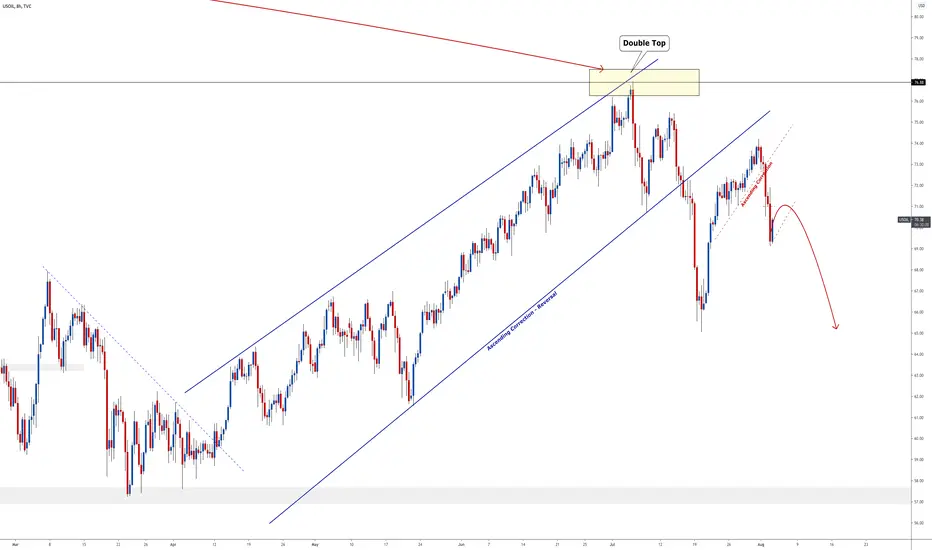
OIL - UPDATEThe last time we analysed oil, we were in the bigger ascending correction and we were close to breaking down. We broke down and then created another smaller ascending correction which also broke.
Will continue to look for corrections on a smaller timeframe and keep selling Oil back to $65 atleast.
Goodluck and trade safe!
Bitcoin breakdown from rising channelHard to tell what might happen here. We have broken below the rising channel and have retested it as a resistance implying further downward movement. However, we are currently right on a fib retracement level which could provide support.

GBPUSD | Perspective for the new week | Follow-up detailsWe are yet to take a position since price action negates the Bearish expectation projected in my last publication on this pair (see link below for reference purposes) as price broke out of the Bearish trendline to find a new high. The current structure appears to have clues that support selling opportunities as the price is at a zone that has accumulated bearish momentum in the past (since February 2021). The appearance of a technical reversal pattern within a major Supplication area ($1.39500/1.40110) that has had a resistance memory since May 2016 (see weekly chart) calls my attention to Bearish tendencies at this juncture in the market.
Despite slumping earlier this week after Fed Chair Jerome Powell said rate increases were "a ways away" and the job market still had "some ground to cover", the bullish momentum garnered on Friday by the USD could be a platform for better days as anticipation of a positive consensus ahead US Nonfarm payrolls release is in the air!
Tendency: Downtrend (Bearish)
Structure: Breakdown | Supply & Demand | Reversal pattern (Double Top) | Trendline
Observation: i. The Greenback resumed recovery with a strong reversal set-up that began on the 21st of July 2021 from the $1.36000 area (see weekly chart).
ii. The line drawn under pivot lows in the last 8 trading days reveals the prevailing direction of participants in the market as price continued to find higher highs.
iii. Double Top: The appearance of an extremely bearish technical reversal pattern within a major Supplication area ($1.39500/1.40110 - see daily chart below) as the price appears to have tested a peak two consecutive times ($1.39830) was later followed by a significant Breakdown of Neckline ($1.39400) on Friday.
iv. I hereby suspect that the early hours/days of the new week might see a price climb to reject neckline to incite a risk of further decline for the Pound in the coming week(s).
v. In this regard, I have identified a niche to go short around $1.39400/1.3900 as a breakdown of Trendline and Key level $1.39850 remains an area to affirm the bearish bias on this pair.
vi. $1.39830 Level - (the peak that formed the Double Top) has a level of significance in my bearish expectations as this level is seen to have a memory of Bearish momentum that garnered over 200pips move in recent times (24th June 2021).
vii. It is worthy to emphasise that the bearish perspective on this speculation could be a correction of the Bullish run that began on the 21st of July 2021 as participants who took advantage of the run take "quick profits" in anticipation of a rally continuation.
viii. This been said, it is appropriate that we put into consideration the possibility of a rally continuation if the price remains above the identified Neckline @ $1.39400... Trade consciously!😊
Trading plan: SELL confirmation with a minimum potential profit of 150 pips.
Risk/Reward : 1:6
Potential Duration: 3 to 7days
NB: This speculation might be considered to make individual decisions on the lower timeframe.
Watch this space for updates as price action is been monitored.
Risk Disclaimer:
Margin trading in the foreign exchange market (including commodity trading, CFDs, stocks etc.) has a high risk and is not suitable for all investors. The content of this speculation (including all data) is organized and published by me for the sole purpose of education and assistance in making independent investment decisions. All information herein is for your reference only and I take no responsibility.
You are hereby advised to carefully consider your investment experience, financial situation, investment objective, risk tolerance level, and consult your independent financial adviser as to the suitability of your situation prior to making any investment.
I do not guarantee its accuracy and is not liable for any loss or damage which may result directly or indirectly from such content or the receipt of any instruction or notification therewith.
Past performance is not necessarily indicative of future results.

FCPO - October 2021 - Mapping - 28/07/2021Breakout (Buy), Fail To Breakout (Sell), Break-in (Sell), Fail To Break-in (Buy). TP at the nearest lines.
Valid on the said date. Enjoy and feel it. Hopefully, it's useful. This is for study and educational purposes only.

GBPUSD | Perspective for the new week | Follow-up detailsWith over 300pips in our kitty as predicted in my last publication (see link below for reference purposes); the Price is back at around $1.38ish - a level I advised that we add sell position ( see previous publication). The successful Breakdown of Key levels on the 18th of July 2021 emphasizes a risk of further decline in price for the Pound in the coming week(s).
After almost a week of selling frenzy, the Pound experienced a phase of recovery during last week trading session to test $1.37800 with a Double Top structure appearing right at our Key level hereby supporting my Bearish expectation on this pair.
Tendency: Downtrend (Bearish)
Structure: Breakdown | Supply & Demand | Trendline | Reversal pattern (Double Top)
Observation: i. $1.37550 (Demand zone) which held price "supported" for 15 days was finally broken to the downside on the 18th of July 2021 to impress the dominance of sellers in the market.
ii. The Breakdown followed by a complete retest of this Key level will strengthen my bias for a sell in the coming week.
iii. Double Top: The appearance of an extremely bearish technical reversal pattern at the Key level after the price reached a peak two consecutive times ($1.37800 & $1.37750 respectively)points at risk of further decline as a breakdown of Neckline @ $1.373000 confirms completion of a reversal set-up.
iv. It is worthy to note that the Double Top structure shares a confluence with a 61.8% retracement of AB leg and Bearish Trendline with a high probability of transitioning into a Harmonic (AB = CD) pattern with parameters explained below;
a. Impulse A-to-B is expected to be in harmony with the potential C-to-D leg.
b. The B- to-C leg is currently at 61.8% Fibonacci retracement (with a possibility of retracing into 78.6%) of the A-to-B leg.
c. The C-to-D leg is expected to fall within 127.2 - 1.414% Fib. ext . of the A-to-B move @ $1.34800 area.
v. Below $1.37550 remains our yardstick to sell the GBP in the coming week(s).
vi. Breakout/Retest of $1.37300 and $1.36900 shall be our two opportunities to add to the existing position... Trade consciously!😊
Trading plan: SELL confirmation with a minimum potential profit of 200 pips.
Risk/Reward : 1:6
Potential Duration: 3 to 7 days
NB: This speculation might be considered to make individual decisions on the lower timeframe.
Watch this space for updates as price action is been monitored.
Risk Disclaimer:
Margin trading in the foreign exchange market (including commodity trading, CFDs, stocks etc.) has a high risk and is not suitable for all investors. The content of this speculation (including all data) is organized and published by me for the sole purpose of education and assistance in making independent investment decisions. All information herein is for your reference only and I take no responsibility.
You are hereby advised to carefully consider your investment experience, financial situation, investment objective, risk tolerance level, and consult your independent financial adviser as to the suitability of your situation prior to making any investment.
I do not guarantee its accuracy and is not liable for any loss or damage which may result directly or indirectly from such content or the receipt of any instruction or notification therewith.
Past performance is not necessarily indicative of future results.

BTC breakdown from descending triangle 1d time framewe are at the very moment falling out of this descending triangle we have been forming on the daily timeframe using the top of the descending channel as the upper resistance. hold on tight ladies and gentlemen this could get smugly real fast. ill post a zoomed out picture so you can see the significance of the white and yellow macro trend lines ive drawn. godspeed everyone HODL AND SHORT

BITCOIN - It's No Surprise Man!!!!Hello everyone, rouzwelt here
Well finally bitcoin broke down the 30k level, I have been pretty vocal about it in my last several posts, explaining the reasons why a drop is extremely probable due to lack of demand and interest in crypto market as a whole, you can clearly see the massive hype around crypto has vanished and the weather is pretty cold right now. As I have been saying in my last post, I was expecting bitcoin to initiate its drop around the crossing point of the downward channel, blue trend line and red trend line (red circle in the chart), and that's exactly where that happened. I was talking about possibility for a reversal and what are the obstacles for bulls to overcome if we want to see one, but they failed at the first one and I said if they fail at any of those obstacles we will see a dump, just take a look at my previous post (screenshot below - click it to go to the original post) and judge yourself the accuracy and validity, I hope you find it valuable.
Right now price has broke-down from the downward purple channel and is now inside the yellow downward channel, sitting on the lower side, so it might initiate a move to the upper side (as demonstrated in the chart by arrows), or if bulls don't show any presence then it might fall below the channel and dumps even more.
I also have been talking about the critical level of around 29 - 30k for bitcoin to break below in my past articles, if it wants to see lower 20's, and as you can see in the screenshot of that post below (click to go to the original post), price has managed to hold on to it at current moment, but the problem is that we don't see any meaningful reaction from bulls, we don't see enough demand and buyers willing to step in at this area like the few times before. Previously whenever price reached this area it bounced quickly with significant demand and volume but right now its cold man. I should say that the trading volume is low and sellers are not doing much either, but their not much efforts have been enough to bring the price to this level, and that's not a good news at all, cause if they have managed to bring the price here with not much efforts, how far can they dump the price if they put more efforts? So right now it doesn't look any good for bulls and I want to be honest, I find it hard to find any bullish signal from the chart in TA perspective, but whenever I see one I'll be more than happy to share it with you guys.
I'd like to point something else here as well, and it's the break-down of macro rising channel in weekly timeframe of log chart (screenshot below). I've been talking about this possible break-down in my post several weeks ago, and now the break-down is confirmed, so lower prices for coming months should not be any surprise to anyone, but that might be good news as well, because that might be the time for bigger players like institutions to come in as many of them have been waiting I believe, because they mostly look at weekly and monthly charts and plan their moves on macro scale and you can't possibly expect them to be he buyer at tops. It also is a good news for those who are here long term and actually believe in blockchain and crypto as they can buy them cheaper.
It's worth mentioning that the fundamentals around bitcoin and sound alts have never been stronger than now, we are hearing great news and that can be an indication that the current bear market would not last very long like 2018 bear market, but that teaches me personally a great lesson and it's that fundamentals don't have to impact prices immediately, they are the main driving factor for rising prices in long-term of course, but the road is not a straight one, that's where TA comes in play, when it's cold it's cold, you can't warm up an entire market by several 4H candles, TA gives you the navigation tool so when the warmth slowly builds up and when it gets hot again, you would be the one enjoying the most.
My short position is still open at 32850 with SL at entry, shoutout to those who took that trade with me, I hope you're enjoying that, and I have a plan to increase its size if bitcoin manages to break the 29 -30k down. I'll be posting about that when I see a clear entry point.
In the end I'd like to ask you all to take a look at my previous posts and judge their qualities yourself, and if you find them and this post valuable enough then consider supporting me by hitting like and comment if you have any opinion about them, I'd appreciate that a lot.

IF we Break with VOLUME Then we will go downBTC has been sideway for very long time
This May Release the pressure if it breaks down with volume
Best Short term Target Buying Zone 23-25k
Good Luck Trading GUys!!

Descending triangle breakout planBased on the amount of times support has been confirmed at the $31,000 level and the number of lower highs along a trendline I believe that a descending triangle pattern is in play. This is supported by the previous formation of a pennant which has lasted longer than four weeks at which point it is more likely to be a triangle. Initially, I thought that we were in a symmetrical triangle but the upper diagonal trendline is too obvious to ignore. As such, I've updated my plan to reflect this new information.
Not financial advice. I'm a beginner and I'm using tradingview as a platform to journal my study of technical analysis on BTC. Feedback welcome.

BITCOIN - A Dangerous WeekendHello everyone, rouzwelt here
I've been talking about the probability of bitcoin dumping in my last few posts, I have pointed the reasons behind my opinion and as you can see in the screenshot below of my last post on bitcoin hourly timeframe, price has dumped quite accurately compared to my projection, so this post is a follow-up on that post.
Right now price is sitting on the lower side of the purple downward channel, it started its move from upper side of the channel to the lower side with 3 touches on the red down-trend line which makes that trend line valid. So as we are heading into the weekend we can expect higher volatility due to lower liquidity in the market, and that can be the catalyst for a possible break-down as price is reaching the crossing point of the lower side of the purple channel, main blue down-trend line and red short down-trend line which makes this point a critical one in TA terms as probably many traders are closely monitoring the price action near it. I believe that a break-down is more probable at this moment when I look at the current technical and fundamental data. But don't get me wrong, price is at support zone of 30 - 32k and it's a strong psychological one, so a bounce can happen. But the issue is that bulls are not doing much, in fact if you look at previous times when price reached this support zone, it bounced quickly and sharply, but right now so far bull couldn't repeat that, and that brings the question that are the bulls' efforts still enough to hold the support or not?
Well if that is not easy for bulls, then they should wait and see how much more difficult their job will be if they manage to bring us back to 35K and above. They have a lot work ahead of them compared to bears, so if we want to see higher levels again, bulls must do a hell of a job. So all that said makes me give the odds to bears at this moment and as a trader I should leave my emotions behind the door, it doesn't matter how much I enjoy higher prices, my job is to take advantage of any opportunity the chart presents me, down or up.
My short position is still open at 32850 and I have moved my SL to entry and took 30% profit at 31200, so I'll be in profit on this trade no matter what else happens. If you liked my analysis then please consider supporting me by hitting like and comment if you have any opinion about it, I'd appreciate it a lot, and as always have fun and trade safe.

BITCOIN - Don't Get Out of Touch With RealityHello everyone, rouzwelt here
Just take a look at the screenshot of Bitcoin daily chart below, almost 17X in a year. What does it tell you? Have you ever asked the question that why it should have risen this much? What's the reason behind it? Has it added additional 17X worth of value in 1 year? What fundamentals have actually changed during this time to cause such an uprise?
Well let me say that many people confuse Bitcoin with Blockchain (crypto tokens with blockchain technology), the point is that the real value, the real driver is not Bitcoin itself (tokens) but actually it is the Blockchain technology, that's where all the things are happening, that's where all the innovation are happening, tokens are just tokens, they don't add value by themselves, so in order for tokens' prices to rise higher you always need another person to pay a higher price than the last person, but there are not infinite amount of buyers of course and as price keeps rising higher their population decreases and also more possible buyers come short of the required capital to be able to buy at those prices. When the last guys buying at the top realize that price is not going to go higher for a certain period in time they start to sell and this initiates a chain reaction. Well in crypto there are a lot of HODLers who play a big roll in crypto massive pumps, but you need to pay attention that as the prices keep rising there will be less new HODLers, because it will be more difficult as they need to put away more of their total capital for lesser possible gains. All these things makes it harder to see higher prices in short period of time. And as you know Blockchain is still very young, we have not yet figured out how we will be using it in real world, the first impression was to replace it with fiat money, but that's not the case anymore, at least with Bitcoin, and about the ability to be store of value, well you can't expect a young asset like crypto to be able to deliver on that until it passes some real world test which happens over time, definitely more than a decade. So the whole speculation about the real world use of Blockchain is still not clear. We might be using it for a whole different purpose in 2050.
You can see in the screenshot that since the breakout of 2018 ATH, we only managed to see a increase in volume at 20 to 30K uprise, and we just saw decrease in volume to new ATH, that shows that the price was actually driven mostly by retails, and retails have limited amount of power, but after price reached almost 65K, you can see huge volume and supply entering market. that is where whales came to play, swallowing every little man on their way, and I don't think they're done yet. Believing that price can't fall lower from here is just a fantasy, as I don't believe the current price is anywhere near being balanced from mining and leverage perspective, but I don't want to dive deep on those issues here. (you can read my previous posts if you're interested in my take on those issues here: ) Another thing to mention is the zero to negative premium on futures market compared to spot market, which is an indication of lack of real interest from traders and speculators. When there is bull market there is always positive premium.
Anyway that was for a general look at the market, but now let's take a look at 1H chart (main chart). I've been talking about my possible short trade setup idea in my last posts which was about a possible entry after the breakdown of the yellow uprising channel and the blue down trend line. I've been pointing the lack of demand and volume at these short impulses up, and with time passing I was getting more confident that price will soon break the channel. Well it has happened now and I've opened my short position at 32850 (you can find my trade setup idea here where I talk about it in detail: ). You can clearly see the volume increasing as soon as the channel broke, again that's a sign of more supply entering. I should say that I hate to sound bearish, I hate the bear market, it's more difficult to trade but you always need to be balanced, and you need to know about bear markets so you can position yourself to be able to enjoy the next bullish market. So right now I believe that there is a good chance to break the 30k support level this time, because price was getting weaker every time it bounced from there, as it couldn't even reach to its last printed high. I believe that interests in current price levels have been decreasing slowly since we entered this 30/40k range, and as long as that is the case then testing lower levels to find more interests again is a great possibility. So be prepared and use the best tool you have to deal with it, which is risk and money management.
If you enjoyed reading this post then consider supporting me by hitting like and please write a comment if you have any opinion about it, and as always have fun and trade safe.

BITCOIN - It's Going As ExpectedHello everyone, rouzwelt here
Well as you can clearly see in the chart, price is now reached to the lower side of the uprising yellow channel and is about to break below it, if you have been following me lately, you know that I've been talking about a potential test of the crossing point of the blue down-trend line and lower side of the uprising yellow channel in my post on June 30 (Link: ), this way it would be testing these 2 potential dynamic supports at the same time. But it's worth mentioning that we still have not fully broken below it, I believe we still need more confirmations before entering a short trade, and 2 good enough confirmations for us would be candle body close below those 2 lines in 4H or daily timeframe and also a new lower low below the last swing low (red dotted line). In that case I'll be entering on my short trade which I've been talking about lately.
Below is a screenshot of my very last post, in which I was talking about my short trade setup idea at the break out of the yellow channel, and I've been projecting the probable price actions and right now as you can see it is playing out with good accuracy as I've been expecting. I also mentioned the lack of volume and demand at rallies up which is a crucial necessity of a sustainable uprise. But what we actually are seeing at this moment in the main chart is increase in volume at the current rally down, which is an indication of more supply coming in on these levels.
So with all those said above, I'll be waiting for those confirmations I mentioned before entering my short trade, as I said earlier we still have not fully invalidated the yellow channel, so we need to wait a few more hours before jumping in on a trade, because before seeing any of those confirmations, price can still get back inside the yellow channel and continue its move up, so we don't want to enter on any trade blindly.
I'd like to remind you to please check my last 2 posts on Bitcoin, because you can find the details of my short trade setup idea (entry point, SL, TP and ...) in full if you'd like to enter on this trade along with me, as they are important considerations before entering any trade. I'll be updating this post whenever I open my position. And please If you find this post useful then support me by hitting like, share and comment below if have any opinion about it, I'd appreciate it a lot.
And as always have fun and trade safe.

Bitcoin - Symmetrical Triangle & RSI Descending ChannelBitcoin is nearing a breakout from a symmetrical triangle:
-The descending trend line started around the initial liquidation around the 19th of May, at around 41,000 USD
-The ascending trend line started around some large buy-side volume when prices dipped to as low as around 29,000 USD
The RSI descending channel is nearing it's top trend line where it historically rejects.
What does this mean?
In theory, the symmetrical triangle should take us to 41,000 USD or 29,000 USD following the breakout/breakdown.
Considering the RSI trend and oversold & fearful conditions of the market, I am Bullish.

Bitcoins Break Down From Rising wedgeBitcoins movement has been all over the place the last couple of days. The manipulation is clear. Pumping all night, consolidating throughout the day, and pumping all night again. No volume to really solidify the movement upwards.
This has led to the breakdown of the Rising Wedge pattern but since then it has now broken back into it. Here we are in the middle of the night with no volume and it's pumping back into a Bearish pattern. Also coming off of a H&S, yet another Bearish pattern.
BTC is fighting a longer-term trend. It has now been 80+ days since BTC has made a new high; It has never in the history of Bitcoin corrected for this long in a Bull Run and made new all-time highs in the same year.
Bitcoins Dominance has taken a huge hit since June 27th and has yet to find ground. It is plummeting right now as I type this, while BTC is pumping. It could potentially keep falling for another 7 days or so and even then what is it that we should expect? JPMorgan estimates Bear Market is in control until it breaks above 50.
More Alt Coins being created every week/month than you can count. Everyone who came in from the outside this year for Cryptocurrencies is still waiting for this moon shot. Influencers pushing pumps and dumping every chance they get. Crypto trading has become a trend. Greed Greed Greed. The strongest factor in corrections. Until the greedy are liquidated, BTC can't truly rise again. The question is... Who is more greedy? The Bulls or the Bears?
Listen, no one should ever say something can't happen and there will always be a first for everything, but at the end of the day, you just have to look at what is in front of you. The odds behind making history after 12 years are significant and I question anyone who is confident or excited to put their money in that battle at the moment.
~Good probability we see 28k by July 13th.
~A strong break above 37k invalidates this analysis.

fake out into break downAfter a weekend of what looks like market malipulation (mostly around the 4am mark), short term trends look bullish. Next week however we'll be entering the 6th week at these 31-35k levels and a brief look over the mountain that was May, shows probable levels we saw back in Dec 2020 (around 26k'ish). EMA's and trend lines to break first before comfirmation.

BITCOIN - Time To Make A DecisionHello everyone, rouzwelt here
This is an update on Bitcoin in hourly timeframe, I want to say that since 2 days ago nothing has changed much, we are still seeing not enough power and demand from buyers, as the price is slowly moving below the main blue down-trend line towards the lower side of channel. We don't see definitive push from either buyers or sellers at this point, but that is going to change soon I believe.
As you can see in the screenshot below of my last post about BTC, price has been moving like my possible price action projection with good accuracy, and now it's the time to make a decision, either up or down. You can see in the chart that it's pointing towards uprise right now, but I don't see that to be sustainable as I don't see enough volume and demand at these current levels, so even if we see a break up, I believe it would fail maintaining that uprise. Let me say it this way, If we had demand at these levels we would have been going up far sooner than now, and I don't think anything has actually changed during these 2 -3 weeks in terms of supply and demand. I'm willing to change my mind on that only in the case that we start to see more demand volume coming in at break up and rallies up.
So let me say that buyers have a lot of works to do if they want to see higher prices in near future, and many other potential buyers are just waiting for a better opportunity, as they probably think that the possible risks for going long at these levels are far greater than the potential rewards and that is one of main reasons behind that we don't see them jumping in at rallies up.
So my personal plan right now is to see wether we see a break up the blue trend line or we break down the yellow rising channel, I'll be looking for short setups at break down of the yellow channel, but for potential break up, I personally rather wait for more confirmations and volume to open any long positions at this stage in time, as my 2 last scalping long position both closed at break even, I was cautious enough so I didn't lose any at going long but that's not the case for many in these levels, so I suggest that if you are looking for long positions, have a tight stop-loss in place.
That's all for now, trade safe and have fun.
