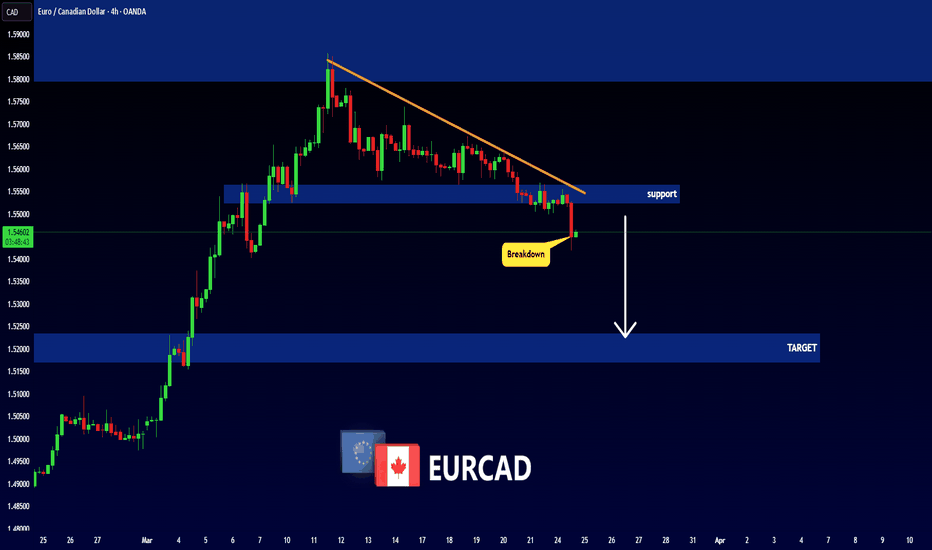
Breakdown
GBP/USD Breakdown – Bearish Momentum Ahead?This 4-hour chart of GBP/USD shows a clear bearish setup:
🔹 Rising Wedge Breakdown – The pair has broken below a rising wedge pattern, signaling potential downside pressure.
🔹 Support and Resistance Levels –
Resistance at 1.29206 - 1.30275
Support at 1.28000 - 1.28437
Strong support at 1.27539
🔹 Sell Confirmation – A sell signal is indicated, suggesting further downside movement towards the target zone.
📉 Trading Plan:
✅ Possible short entries below the 1.28956 level.
✅ Target price: 1.27539
✅ Stop-loss above 1.29206 for risk management.
⚠️ Risk Note: Always manage risk properly and watch for any trend reversals before entering trades.
What are your thoughts? Are you bearish or bullish on GBP/USD? 🤔💬
#ARCUSDT is showing signs of reversal📉 Short BYBIT:ARCUSDT.P from $0.06780
🛡 Stop loss $0.07117
🕒 1H Timeframe
⚡️ Overview:
➡️ The main POC (Point of Control) is at 0.05873, indicating the area with the highest trading volume.
➡️ The 0.07117 level acts as strong resistance where the price previously reversed.
➡️ The chart shows a potential topping structure followed by a decline.
➡️ Volume concentration between $0.065 and $0.06210 suggests key zones for potential profit-taking.
🎯 TP Targets:
💎 TP 1: $0.06510
💎 TP 2: $0.06210
💎 TP 3: $0.06050
📢 Watch the key levels and enter after confirmation!
📢 The price has already started to move down — downside momentum remains strong.
📢 The TP levels are near a previous consolidation zone, allowing quick target execution.
BYBIT:ARCUSDT.P is showing signs of reversal — considering shorts with clear downside targets!
EURUSD - 2 ScenariosHello Traders !
On Tuesday 11 March, Th EURUSD reached the resistance level (1.09374 - 1.09058).
So, We have 2 Scenarios:
BULLISH SCENARIO:
If the market breaks above the resistance level and closes above that,
We will see a bullish move📈
TARGET: 1.11580🎯
BEARISH SCENARIO:
If the price breaks and closes below the neckline,
We will see a huge bearish move📉
TARGET: 1.06350🎯
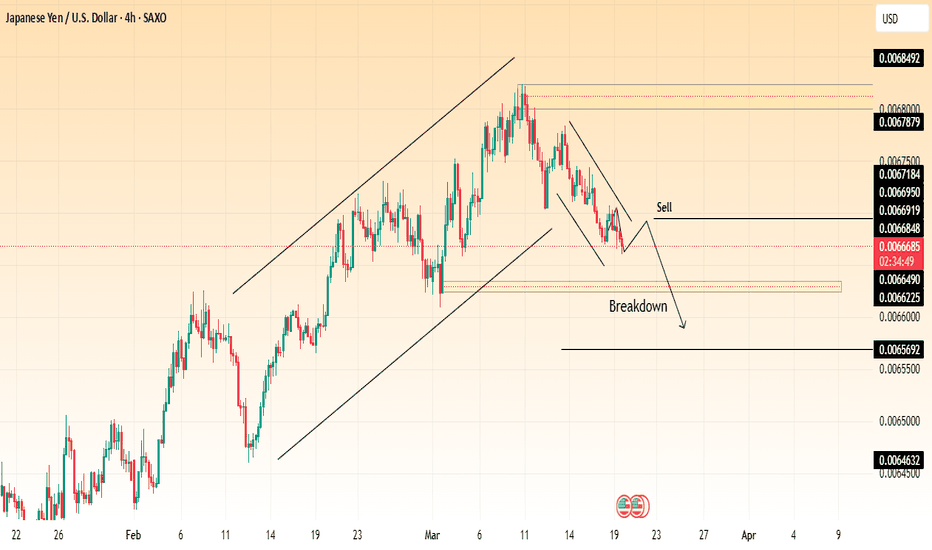
USD/JPY - Breakdown Confirmation & Potential DeclineUSD/JPY - Breakdown Confirmation & Potential Decline
Chart Overview:
The USD/JPY price action has broken down from a previously established ascending channel.
A lower high formation suggests weakening bullish momentum, indicating a potential continuation of the downtrend.
The key support zones are marked below, with the price likely to move towards these levels if bearish momentum persists.
Technical Analysis:
Breakdown Zone: The price has breached the lower trendline of the ascending channel, confirming a bearish breakdown.
Resistance Levels: The price faces resistance around 0.0067786 - 0.0068488.
Support Targets: Possible downside targets at 0.0066848, 0.0066012, and 0.0065720.
Bearish Confirmation: A retest of the breakdown level followed by rejection strengthens the bearish outlook.
Trade Consideration:
Bearish Bias: A short position could be considered if the price fails to reclaim the broken trendline.
Stop Loss: Above the breakdown zone to avoid potential fakeouts.
Target Levels: Lower support zones for potential take-profit areas.
Conclusion:
The breakdown from the rising channel suggests a shift in market sentiment, with a bearish move likely. Traders should monitor price action for further confirmations.
USD/JPY Bearish Continuation📉 Trend Analysis:
The chart shows a breakdown from an ascending channel, indicating a potential bearish reversal after an extended uptrend.
Price has formed a descending channel, reinforcing the short-term bearish structure.
🔍 Key Levels:
Sell Zone: Around 0.0066848 - 0.0066919, acting as resistance.
First Target: Around 0.006490, a strong support area.
Second Target: Around 0.0065692, marking a deeper level of bearish continuation.
Final Target: Around 0.0064632, a critical demand zone.
📌 Trade Plan:
Look for sell entries on a possible pullback to the resistance zone.
Confirmation through rejection candles or continuation patterns could strengthen the bearish case.
⚠ Risk Management:
Stop loss above the previous resistance around 0.0067184.
Take profits gradually at key support zones.
CRUDE is looking weak. Price connection is expected#CRUDE #Analysis
Description
---------------------------------------------------------------
+ Crude has formed a nice descending triangle pattern and price has broken down the support line which formed over the years.
+ A clear breakdown from this support would push down the prices further.
+ Next target is 50-40$ range.
---------------------------------------------------------------
Enhance, Trade, Grow
---------------------------------------------------------------
Feel free to share your thoughts and insights. Don't forget to like and follow us for more trading ideas and discussions.
Best Regards,
VectorAlgo
I only need this tradeThis will be my only trade in Forex for a while if it doesn't stop me out. The pair is rolling over from a high resistance area. That trendline won't hold, I'll add heavily if it breaks down the trendline in the daily timeframe. SL triggers if a weekly candle CLOSES above 159.20, otherwise is just volatility. I'm holding this for several weeks. Patience is the key.
BTC: Lost Key Support! What’s Next?🚀 Hey Traders!
If you’re finding value in this analysis, smash that 👍 and hit Follow for high-accuracy trade setups that actually deliver! 💹🔥
🚨 BTC Breakdown Alert!
BTC has lost the critical GETTEX:87K -$90K support in the daily timeframe—a level it held strong for over 3 months! Now, it's looking like a bearish retest, which could lead to another leg down. 📉
🔻 Next Major Support: $72K-$75K
✅ Bullish Reclaim? BTC must close above GETTEX:87K on the daily to confirm this as a fakeout—until then, the bias remains bearish.
🔥 What’s your take? Are we heading lower, or will BTC reclaim its lost ground? Drop your thoughts below! ⬇️🔥
ETH has broken its 2 year ascending trendlineI have been busy working on our AI Super Aggregator so have not been as active in the market but look at this chart, it looks not good. We have broken a 2 year ascending trendline, the only goodish news is that it looks like we are trying to assume a nearly horizontal channel versus some steep descending channel.
Since we are at the bottom of that new channel I would expect some reprieve from the current descent but a good chance its just enough to come up and prove our old ascending channel as resistance before potentially heading back down to retest the bottom of channel support.
Really most the broad crypto market looks not so great but some assets have been trying to break their descent, and for some assets they are so oppressed right now you have to wonder, how much lower can it go?
Be vigilant, the market has already been cruel and at the moment it looks like it still has more anger to blow off.
Bitcoin at a Critical Level: Will Support Hold or Break?CRYPTOCAP:BTC is currently accumulating within a marked zone, fluctuating within a broad range of approximately $17,800. The previous resistance line has now acted as support, indicating a key retest level.
If BTC fails to hold this support, a further decline toward the key support zone could be expected. The RSI is near 42.83, suggesting neutral momentum, with no strong bullish signs yet.
A breakdown below this range could trigger a bearish move, while a breakout above resistance would confirm bullish continuation.
DYOR, NFA
Thank you for your attention! If you found this valuable, please hit the like button and share your thoughts in the comments below.
To Thine Own Shoe be True - $BTC's Other Foot is About to FallBitcoin’s Floor Must Be Lower – Chart Physics and Market Psychology at Work
In this video, I explain why Bitcoin has no choice but to find a lower floor, despite many traders believing the worst is behind us. While price is briefly going to appear to confirm support, this is just part of the process before it comes back down and breaks through it on the third test. The real focus here isn’t whether this level holds for another day or two—it’s about why Bitcoin must go lower before it can establish true support.
For a long time, Bitcoin has been floating over clear air with no real structural support. When price climbs too high without building a strong foundation, it eventually has to fall back down to fill the gaps. Right now, the market is in denial, desperately trying to hold Bitcoin in the $90,000 range, but this isn’t about what traders want—it’s about chart physics and liquidity. When there’s nothing left to hold the price up, it must seek a lower equilibrium.
Psychologically, traders don’t want to accept that Bitcoin might have to revisit $70,000 or lower to reset before moving higher. But markets don’t move based on hope—they move based on supply, demand, and liquidity positioning. Right now, there are no meaningful buyers willing to absorb the sell pressure at this level, which means Bitcoin has nowhere to go but down. Once it finally breaks through, it will likely move quickly, as there’s no real support structure beneath it.
Know thy shoe.
The shoe will find the ground.
(My sincerest apologies about the volume ladies and gentlemen. The problem which I thought I had corrected from a prior video still exists in this video. It is an issue I'm hoping Trading View can correct before too long on their end… The problem originated on my end, but there was nothing I can do after it was recorded, and I had to get this video up there - I believe it contains important time sensitive information…
Please try listening with the volume turned all the way up or perhaps with headphones until the problem can be corrected.
My system issue has been corrected for the future, but Trading View if you can, please tweak this on your end and amplify it. This video is extremely worthwhile..)


