ABNB - Breakdown with backtestIt appears ABNB has broken through technical support, backtested the (new) resistance and has lower to go.
Breakdown

Weekly Outlook! 3/1 - 3/5Here we go over last weeks video and we take a look at a few things we are keeping an eye on for the coming week!

CCIV is lucid dreamingI recently told some friends to take profit and "sell the news" They didn't take my advice... Was riding on the upper end of the top channel and filled out an ascending triangle that signaled a reversal.
I would wait a bit before re-entry on a nice discount here. Get ready for calls soon. Cheers!
Please like/share, thank you!

USDCNH | Perspective for the new week | Follow-upWe saw the price decline and move over 1,000pips in our direction since my last publication before the rally began during last week trading session (see link below for reference purposes). Despite the general perception that the USD is on the verge of a rally due to the sudden & rapid rise that appears to be running ahead of itself during last week trading session, I am of the opinion that we are at a juncture in the market where the structure/pattern is "screaming" risk of further decline for the Greenback in the coming week(s). Even though there is room for a possible rally into the major Supply area @ Y6.5100 area, my bias still remains Bearish!
Tendency: Downtrend ( Bearish )
Structure: Harmonic Pattern (AB = CD) | Breakdown | Supply & Demand
Observation: i. Since the beginning of the year (2021), Buyers have found it difficult to break the Y6.51000 barrier thereby leaving clues of strong selling pressure at this zone.
ii. Continuous rejection of the Y6.51000 area followed by a complete Breakdown of Key level (Y6.4600/6.4400) at the beginning of the month (Feb 2021) is a sign emphasizing the strength of sellers.
iii. I am of the opinion that the rally that began on the 15th Feb 2021 is a Correction of the Impulse leg AB (expressed on the chart).
iv. Last week trading session saw price close at Y6.4600 area - exactly 61.8% retracement of AB with the possibility of extending into the Major Supply zone @ 78.6% retracement (appearing to be a rejection of key level) before the decline begins.
v. The setup evolving at this juncture might transpose into ABCD pattern parameters explained below;
a. Leg A-to-B is expected to be in harmony with the potential C-to-D leg.
b. The B- to-C leg is currently hovering at 61.8% (with a possible 78.6% in the future) Fibonacci retracement of the A-to-B leg.
c. The C-to-D leg is expected to fall within 127.2 - 1.414% Fib. ext. of the A-to-B move.
vi. It is hereby required that we become patient and wait for a strong Reversal pattern on lower time frames for confirmations... Best of luck and Trade consciously! :)
Trading plan: SELL confirmation with a minimum potential profit of 1,000 pips.
Risk/Reward : 1:3
Potential Duration: 7 to 14 days
NB: This speculation can be considered to make decisions on lower timeframes.
Watch this space for updates as price action is been monitored.
Risk Disclaimer:
Margin trading in the foreign exchange market (including foreign exchange trading, CFDs, etc.) has a high risk and is not suitable for all investors. The content of this speculation (including all data) is organized and published by me for the sole purpose of education and assistance in making independent investment decisions. All information herein is for your reference only and I take no responsibility.
You are hereby advised to carefully consider your investment experience, financial situation, investment objective, risk tolerance level, and consult your independent financial adviser as to the suitability of your situation prior to making any investment.
I do not guarantee its accuracy and is not liable for any loss or damage which may result directly or indirectly from such content or the receipt of any instruction or notification therewith.
Past performance is not necessarily indicative of future results.

Most likely scenario for Tesla for couple of next monthYou need to correct a bit to get new investors in before riding another Bull Year if you would.

gbpaud daily - shortPrices formed a double top onto a resistance area, now looking for a breakdown off the neckline structure. Look for selling opportunities on the lower timeframe to catch a move towards the next support area, indicated by the range arrow shown in the chart!

NOWWhen the markets start slipping it's important to be able to play both sides. Sometimes, you find setups like this one where every technical looks overbought, and theres nothing stopping it from falling. At the same time, we're in a bull market, and although all the signs point down, stocks will go up. I'm taking puts on $NOW due to MACD and RSI curling downwards, an overall shift out of tech, and the imminent correction needed in this stock due to how overvalued it's been! There's also a gap to fill from 546 to 543, with an overall PT of 508 in the coming weeks. Good luck!

Weak volumes suggest further dumpWeak volumes off the sudden crash indicates low buyer interest.
We should see another break of the red trendline to do a second test of Fib 0.382 @ 4.7 cents, then a slight drawback and another dump down to break through 4.7 and hit a new low at fib 0.28 (3.7 cents)
I expect to see a price channel between 3.7 and just above four cents as a possible accumulation zone.
The end of accumulation should be characterized by the second hard dump down to high 3, low 4 cents before being bought up and making all sorts of ascending triangles and teacup formations.

EURAUD H4 - SHORTEURAUD H4 - SHORT
Breakdown off a major ascending trendline and now retesting the breakdown zone.
We could potentially look for SELLING opportunities on the lower time frame to catch a move towards 1.55700 support area (Immediate swing low).

BTC BOOMI feel like BTC is ahead of the other moves in forex and futures.
Looks to be in a month long ascending wedge on daily chart and ascending on hourly as well.
Found support on the blue lower trend line from a couple days ago and already bounced off 3x, though could be consolidating for further downside.
Just slid out of the overbought condition on daily RSI and MACD looking to be lightening up as well.
Could retest the the 40000 range again or it could be a beast and not.
That's all folks

NZDCAD | Perspective for the new week | Follow-upThis is a follow up on my previous publication (see link below for reference purposes) on this pair as the price action continues to flow according to expectations! Unlike my previous publication, Excited to let you know that I have captured a distinct and tradable pattern on this pair.
The appearance of a Double Top pattern - a strong Reversal structure appears to fine-tune a Bearish setup as Buyers gradually lose momentum and price continues to show tendencies of risking a further decline in the nearest future.
Tendency: Downtrend ( Bearish )
Structure: Reversal pattern | Supply & Demand | Double Top | Channel
Observation: i. Since late January 2021, the price has been caught within a Channel and since the Breakdown of CA$0.91850 followed by a significant rejection of this level... my Bearish bias becomes a little stronger.
ii. This been said, I am anticipating a significant Breakdown/Retest of CA$0.91400 in the coming week(s) to join the decline as CA$0.91900/0.91500 remains a level to watch out for in this regard.
Trading plan: SELL confirmation with a minimum potential profit of 150 pips.
Risk/Reward : 1:5
Potential Duration: 2 to 7 days
NB: This speculation can be considered to make decisions on lower timeframes.
Watch this space for updates as price action is been monitored.
Risk Disclaimer:
Margin trading in the foreign exchange market (including foreign exchange trading, CFDs, etc.) has a high risk and is not suitable for all investors. The content of this speculation (including all data) is organized and published by me for the sole purpose of education and assistance in making independent investment decisions. All information herein is for your reference only and I take no responsibility.
You are hereby advised to carefully consider your investment experience, financial situation, investment objective, risk tolerance level, and consult your independent financial adviser as to the suitability of your situation prior to making any investment.
I do not guarantee its accuracy and is not liable for any loss or damage which may result directly or indirectly from such content or the receipt of any instruction or notification therewith.
Past performance is not necessarily indicative of future results.

GBPCAD 1hr longIn this trade we can see many pattern breaks on the way up, think there will be a final push to reach the 1:3 target. The stop is on 20pips so chance of getting stopped out is higher.

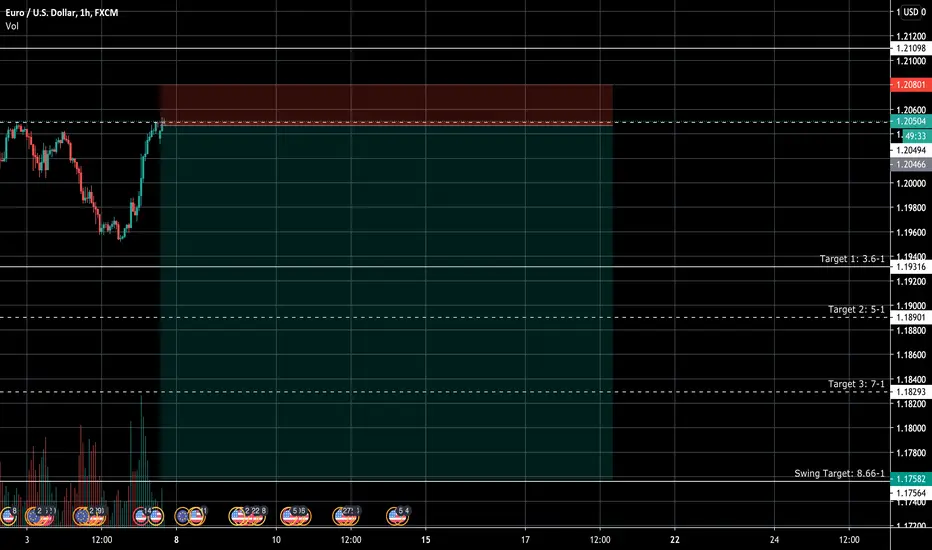
Longer Term Targets for EURUSDEURUSD has barreled through my previous targets tagged to this post. It has continued to consolidate and after a busy news week and despite volatility there was no true movement in the exchange rate it seems to have found some acceptance. However, with another busy news week that holds lots of weight in both pairs, I expect to see some nice movement in the price and have set swing targets for the rate from early November 2020 when the expeditious end of year run ultimately began. Though buyers now will have time to get out of positions with ease, I expect for it to have some crazy swings through these levels.
Bitcoin Breakdown: Psychology and VolumeBTCUSD has put on a show finding new highs over the course of two days. What sparked this large move? Well, part of it can be accredited to Tesla announcing that they were buying $1.5 billion dollars worth of Bitcoin. Crypto is no stranger to the wonders of Elon Musk and this was likely a huge pull for a lot of investors. There is a lot that can be taken away from this rally and there are some observations I made and would like to focus on, volume and psychology to be exact.
1st Observation: Volume on the break of 40k. Last time bitcoin had a large run up, 40k was hit and blown through very rapidly and prices quickly made their way to 42k within the same night. We see similar volume in both of these situations where the prevailing demand creates these long green candles and the volume to match it.
2nd Observation: Pullbacks at Psychological Price Points. While 40k had no problem being broken as price has experienced buying there prior to this run, it is interesting that at 42k, the former highs, Bitcoin began to experience some turbulence (see 2. on chart). Buying took prices more than $1,000 over former highs, but there is brief moment where the rally looked as though it might have been coming to an end. A huge pullback occurs and the price of Bitcoin briefly breaks under 41k. Shortly after, there is some absorption from buyers to take the 15 minute candle back up where it closes above the former highs. Going back to January 8 when these highs were made, there was a similar psychology surrounding 40k, price broke above 40k briefly only to then have what appears to be a rally ending downturn, followed by a quick buyback.
Conclusion: The prevailing bullish sentiment towards Bitcoin continues to astonish me, and as I watch this rally in awe, I only hope to guess what is to come next. However, what can be observed can be the edge needed to make wise decisions while investing and trading. In the wise words of Warren Buffett, "Risk comes from not knowing what you are doing."

ASIAN PAINTS LTD BREAKDOWNwww.tradingview.com
SELL BELOW : 2370
STOP LOSE : 2529.05
TARGET : 2106.95

EURAUD-4H-Wating for breakdownHI guys;
ON the EURAUD pair,we can see the price has a correction till upper trendline and after reached the trend line,price's reversed buy trendline.For present, we are watching the price's moving whenever it breakdown the key level and done the retest,can enter to a short position till the next strong support zone.

NIO descending triangle NIO has been consolidating for quite some time. I figured this might be a descending triangle and the possible playouts that might occur are indicated by the blue arrows. The support/resistants are possible entry/exit points.
Please share your ideas or tell me if you agree.

AUDJPY-4H-Short PotentailHello guys;
For AUDJPY pair , it is time to enter for short position after retest which is marked as a supply zone.
I look forward to hearing.Put your comment right away.

EURCAD-4H-Short potentailHi folks;
ON EURCAD 4H timeframe we can see a divergence on MACD and the other hand RSI has a breakdown which is marked.So, we can see an impulse and Correction on the chart.we can expect the candles moves down till demand zone.After Breakdown and retest we can get short till 1.52787 or 1.50846 level as a target.
JUST KEEP WATCHING FOR BREAKDOWN AND RETEST.
I look forward to receive your idea or comment.Put it right away guys.


BALKRISIND FORMING AN ASCENDING TRIANGLEWe can see the price is in ascending triangle and 20 and 50 MA is supporting the price and volume is decreasing so might give good movement once breakout or breakdown the targets are mentioned on the charts
please let me know your views on this analysis

My Trade Setup On PetroNetwe can see price formed a double top and broke from a rising wedge once price broke the neckline of the double top and 50% fib level we can short. target are mentioned on the. stoploss will be depend on risk apatite you can put your stoploss above previous high
please share your views on this analysis

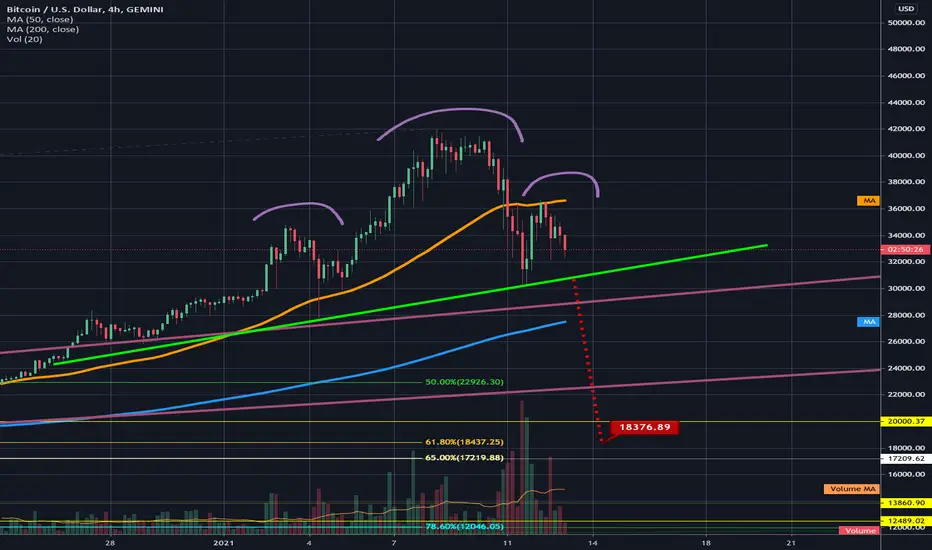
4hr chart h&s pattern could send us back to the golden .618 fibAs always we must wait for confirmation of this pattern before attempting to trade it. There is compelling bearish confluence here with the breakdown target from this pattern lining up perfectly with the .618 golden fib retracement. Not only this, but this zone is also just below where the extremely strong support from the weekly 21 ema (not shown here) is located. As we have seen in the previous bull market of 2015-2017, the weekly 21 ema was able to maintain support for price action throughout the entire bull market and was retested every correction except one during that bull market. These 3 things combined increases the probability of a breakdown to this zibe significantly where we could see a wick all the way down to the golden fib fulfilling the H&s breakdown target while the body of the candle still manages to close above that with the weekly 21 ema maintaining support. Of course, it's also possible the correction could be over well before that with such parabolic bullish fever still very much in the air....the coming FUD concerning the 14 trillion tether lawsuit as well as the recent executive order passed against chinese companies also suggests a deeper correction is likely...but ultimately we must still wait to see if this h&s breakdown confirms first. I will be watching to see if this top ascending plum colored trendline from the previous ascending broadening wedge we were in can maintain its support. I will not be convinced the h&s breakdown will occur until it is clear that this trendline has been flipped to solidified resistance. This is as always only my personal strategy and not financial advice nor am I a financial advisor. Best of luck in whatever trade you decide to take and thanks for reading!