GBPCHF | perspective for the new weekHopes of Brexit deal wanes again; GBPCHF sinking back towards lows as it finds a haven for selling pressure around Fr1.20300.
Tendency: Downtrend ( Bearish )
Structure: Breakdown | Supply & Demand | Harmonic (AB = CD)
Observation: i. Since completion of Double Top pattern in late Nov. 2020, price continues to risk further decline.
ii. Previous safe haven for Buyers was finally broken last week as price tested Fr1.19100 before making a corrective move.
iii. As price touches 50% retracement of AB leg, a possible Harmonic pattern AB = CD appears to metamorphosize in the coming week(s).
iv. AB = CD pattern shall guide me through the path price action takes in the coming week.
ii. ABCD pattern parameters explained below;
a. Impulse A-to-B will be in harmony with the potential C-to-D leg.
b. The B- to-C leg is at 50% currently (with a possible 61.8 or 78.6% in the future)Fibonacci retracement of the A-to-B leg.
c. The C-to-D leg is expected to fall within 127.2 - 1.414% Fib. ext. of the A-to-B move.
Trading plan: SELL confirmation with a minimum potential profit of 250 pips.
Risk/Reward: 1:3
Potential Duration: 1 to 5 days
NB: This speculation can be considered to make decisions on lower timeframes.
Watch this space for updates as price action is been monitored.
Risk Disclaimer:
Margin trading in the foreign exchange market (including foreign exchange trading, CFDs, etc.) has a high risk and is not suitable for all investors. The content of this speculation (including all data) is organized and published by me for the sole purpose of education and assistance in making independent investment decisions. All information herein is for your reference only and I take no responsibility.
You are hereby advised to carefully consider your investment experience, financial situation, investment objective, risk tolerance level, and consult your independent financial adviser as to the suitability of your situation prior to making any investment.
I do not guarantee its accuracy and is not liable for any loss or damage which may result directly or indirectly from such content or the receipt of any instruction or notification therewith.
Past performance is not necessarily indicative of future results.
Breakdown

EUR USD ANALYSIS clean and clear analysis on EURUSD
shared BUY and SELL setup with the break out and break down of the structure
1st trade long after break out with heavy volume for the target mention in chart
stop loss break down of trendline
2nd trade short after break down for the target T1 break down of T1 will leads to T2
stop loss vice versa
other scenarios
pull back from T1 to hit T2 or make double bottom in T1 (long) to hit T2 upper trendline
breakout T2 will 1st trade Target
All the best guys

$VFF - SHORT SWING TOWARDS TEST OF SUPPORT$VFF - One of my favorite stocks to swing. Came off yearly lows under $3, to hit highs once again near $11. Big distribution at this level from previous years, expecting a breakdown of first support near $9 (which is weak), and a swing towards first true support near $7/8.

EURUSDth euro is trading in a little range while its uptrending! From here these are the opportunities to grab. To the upside you want to step in if it breaks and pulls back to give a good oppportunity. If a breakdown occurs then you should grab the short when it tries to rally, but mind the uptrend shorting is riskier while is trending up. EURUSD could have more upside to test previous tops around 1,2500 levels.

don't miss this tradeprice broke the stucture level and H&S neckline we can enter the trade with a good risk to reward ratio
I recommend you to wait for lower timeframe confirmation signal(wedge,flag,..)
do you think it will move lower or not?
It's honor for me to have your point of view

Predicting - Bitcoin breaks down 15%everal signals are showing that a big break down will come this week. A clear rising wedge is forming near our all time high with volume diminishing as the week progresses. Target drop will possibly break several support levels, the first being around the 18,500 mark. Support is relatively strong at that mark, however, if a large sell volume breaks through 18.5k, the next floor will be a fragile 17k. Bearish divergence continues to form a clear picture in our daily chart and RSI.
This is the pull back many analysts have been anticipating after this parabolic run up to reach our all time high. If bitcoin breaks down to my target of 15.5k, this is not necessarily a trend reversal and that we are back in the bear market. The EMA ribbon has been our support during this bull market as we continue to bounce off it with every retracing.

USDCHF | Perspective for the new weekWith over 100pips running in profit since my last publication (see link below for reference purposes), the US dollar has continued its downtrend against the Swiss franc for the fourth consecutive day. Signs of a further decline in the Greenback continues to be emphatic as price breaks down and retest Fr0.90800 to make new Resistance level for future "sells".
Tendency: Downtrend (Bearish )
Structure: Trend Channel | Breakdown| Supply & Demand
Observation: i. Price appears to continue to respect the Downtrend that began in April 2019 as it gets caught in a Descending channel pattern.
ii. Connecting the lower highs and lower lows of price with parallel trendlines support my downward trend bias.
iii. Price making lower low since the beginning of the month points at the sellers' momentum at this juncture as we experienced a significant Breakdown followed by a retest of Fr0.90800 level last week.
iv. For me, Fr0.90800 level shall be my yardstick (new Resistance level) for selling opportunities in the following week(s).
Trading plan: SELL confirmation with a minimum potential profit of 150 pips.
Risk/Reward: 1:5
Potential Duration: 1 to 4 days
NB: This speculation can be considered to make decisions on lower timeframes.
Watch this space for updates as price action is been monitored.
Risk Disclaimer:
Margin trading in the foreign exchange market (including foreign exchange trading, CFDs, etc.) has a high risk and is not suitable for all investors. The content of this speculation (including all data) is organized and published by me for the sole purpose of education and assistance in making independent investment decisions. All information herein is for your reference only and I take no responsibility.
You are hereby advised to carefully consider your investment experience, financial situation, investment objective, risk tolerance level, and consult your independent financial adviser as to the suitability of your situation prior to making any investment.
I do not guarantee its accuracy and is not liable for any loss or damage which may result directly or indirectly from such content or the receipt of any instruction or notification therewith.
Past performance is not necessarily indicative of future results.

CADCHF | Perspective for the new weekThe impact of Sellers in February 2020 (Bearish Impulse leg that lasted a month on the weekly chart - ) appears to be too strong for the Buyers to gain that confidence needed to invest in the CAD. With the present Head and Shoulder look alike, I shall be patiently looking out for a significant Breakdown of Neckline and Support level @ 0.69300 to hop in the decline.
Tendency: Downtrend ( Bearish )
Structure: Channel | H & S| Supply & Demand
Observation: i. Despite having a Bullish structure, the CAD$0.0.69800 level has been a very stronghold for Sellers since mid-October 2020.
ii. Bullish move from CAD$0.69400 (Support level) continue to be rejected @ CAD$0.69800 hence making it a major level for Supply.
iii. With the present character in the market, the Breakout of CAD$0.698000 on the 9th of Nov. 2020 appears to be false as the price continues to experience weak Bullish momentum springing from the Bullish Trendline.
iv. This been said, CAD$0.69300 level becomes a level to watch out for significant breakdown for confirmation this week.
v. It is also worthy to note here that a significant Breakout of CAD$0.70000 level this week might render this setup invalid and an immediate shift to a rally continuation shall be activated.
Trading plan: SELL confirmation with a minimum potential profit of 100 pips.
Risk/Reward: 1:3
Potential Duration: 1 to 5 days
NB: This speculation can be considered to make decisions on lower timeframes.
Watch this space for updates as price action is been monitored.
Risk Disclaimer:
Margin trading in the foreign exchange market (including foreign exchange trading, CFDs, etc.) has a high risk and is not suitable for all investors. The content of this speculation (including all data) is organized and published by me for the sole purpose of education and assistance in making independent investment decisions. All information herein is for your reference only and I take no responsibility.
You are hereby advised to carefully consider your investment experience, financial situation, investment objective, risk tolerance level, and consult your independent financial adviser as to the suitability of your situation prior to making any investment.
I do not guarantee its accuracy and is not liable for any loss or damage which may result directly or indirectly from such content or the receipt of any instruction or notification therewith.
Past performance is not necessarily indicative of future results.

AUDUSD | Perspective for the new weekIt has really been a while since I visited this pair but the current structure appears to be promising as I see a defiant level packed with selling pressure @ $0.73400.
The AUD/USD pair has continued in a predictive pattern with a second consecutive week in a tight 100 pips’ range since hitting its highest level in recent times @ $0.73400. Despite rallying during the trading session on Friday, we are still stuck in the same range giving the impression that Buyers at this juncture lack the momentum to push the price above its previous high @ $0.73400 hereby opening a window for a counter-trend possibility.
Tendency: Downtrend ( Bearish )
Structure: Channel | Reversal pattern | Supply & Demand | Trendline
Observation: i. Despite structure screaming "Bullish!", we might be in for a correction phase this week in anticipation of a rally continuation.
ii. $0.73400 level has been respected since the beginning of this month at six different occasions making this a strong Supply zone.
ii. A sharp rejection of $0.73200 level on Friday despite a rally insinuates there might be a Breakdown of Trendline in the coming week.
iii. With the high expectation of a Trendline breakdown @ $0.72700, I shall be keeping tabs on my Demand area @ $0.72200 for a significant Breakdown which shall confirm Correction of the Impulse leg.
Trading plan: SELL confirmation with a minimum potential profit of 200 pips.
Risk/Reward: 1:5
Potential Duration: 5 to 10 days
NB: This speculation can be considered to make decisions on lower timeframes.
Watch this space for updates as price action is been monitored.
Risk Disclaimer:
Margin trading in the foreign exchange market (including foreign exchange trading, CFDs, etc.) has a high risk and is not suitable for all investors. The content of this speculation (including all data) is organized and published by me for the sole purpose of education and assistance in making independent investment decisions. All information herein is for your reference only and I take no responsibility.
You are hereby advised to carefully consider your investment experience, financial situation, investment objective, risk tolerance level, and consult your independent financial adviser as to the suitability of your situation prior to making any investment.
I do not guarantee its accuracy and is not liable for any loss or damage which may result directly or indirectly from such content or the receipt of any instruction or notification therewith.
Past performance is not necessarily indicative of future results.

DOW, support testThe DOW is looking to go down, it tried to rally today but failed and made a good short opportunity.
The previous wide bar can act as a support, tommorow u should look for a breakdown of that arrow and buy at the test of the breakdown.
The other scenario is if the support holds then look for upward motion to the upper end of the range.


USDCAD | PERSPECTIVE FOR THE NEW WEEKAfter taking a 200pips gain in our last publication on this pair (see link below for reference purposes), it appears we are at a juncture for a second wave of shorting the USDCAD as price breaks down my key level @ CAD1.30700. Despite making the previous four trading days in the positive territory, the USD/CAD pair rose to its highest level during the last week at CAD1.31740 on Friday only to experience a sharp rejection of this level with a Shooting star candle. Even though I have this intuition that the price of oil will surge soon, It is worthy to note that the performance of oil in the coming week shall be a significant point of reference to make a decision on this pair.
Tendency: Downtrend ( Bearish )
Structure: Breakdown | Supply & Demand | Trendline
Observation: i. As price continues to respect the major Trendline since May 2020; a Breakdown of Key level @ 1.30700 on the 5th of Nov. 2020 is a clue that the Trend might continue considering the Selling pressure at this juncture in the market.
ii. 1.31300 area which has been a Demand zone in the past appears to have been taken over by Sellers as this level no longer hold a haven for buyers.
iii. Our New Supply zone @ 1.32000 & 1.31500 which is also forming a Double Top pattern confirms the strength and presence of Sellers.
iv. We experienced significant growth in the Greenback last week but I am considering this minor uptrend to be a correction phase that might hit around 61.8% retracement in anticipation of a decline.
Trading plan: SELL confirmation with a minimum potential profit of 450 pips.
Risk/Reward: 1:3.5
Potential Duration: 5 to 10 days
NB: This speculation can be considered to make decisions on lower timeframes.
Watch this space for updates as price action is been monitored.
Risk Disclaimer:
Margin trading in the foreign exchange market (including foreign exchange trading, CFDs, etc.) has a high risk and is not suitable for all investors. The content of this speculation (including all data) is organized and published by me for the sole purpose of education and assistance in making independent investment decisions. All information herein is for your reference only and I take no responsibility.
You are hereby advised to carefully consider your investment experience, financial situation, investment objective, risk tolerance level, and consult your independent financial adviser as to the suitability of your situation prior to making any investment.
I do not guarantee its accuracy and is not liable for any loss or damage which may result directly or indirectly from such content or the receipt of any instruction or notification therewith.
Past performance is not necessarily indicative of future results.

EURCHF | PERSPECTIVE FOR THE NEW WEEKRisks remain asymmetric longer term as the SNB holds the downside in check and a possible global recovery in 2021 may bring some relief to the EURCHF but in the meantime, it is evident that the Bullish momentum finally begins to make a statement in the market. I shall be looking out for a "quick" temporary counter-trend opportunity on this pair in the coming week in anticipation of a Bullish continuation. This bias is a result of the Bearish engulfing candle on Friday which broke down key level @ 1.07780 which also signifies a correction phase following the Bullish engulfing run on the 9th of Nov. 2020.
Tendency: Temporary Downtrend ( Bearish )
Structure: Breakdown | Pennant | Supply & Demand
Observation: i. Price moves upward with pivot highs and lows converging toward a single point giving the appearance of a Pennant pattern.
ii. Breakdown of this pattern suggests a possible Reversal which could be the correction phase of the Bullish Impulse leg on the 9th of Nov. 2020.
iii. Taking advantage of this setup might require patience for a correction/retest of Trendline or Key level @ 1.07780.
iv. I anticipate a target extension within a minimum of 50 - 61.8% retracement which might as well extend to a 78.6% depending on market condition(s).
Trading plan: SELL confirmation with a minimum potential profit of 60 pips.
Risk/Reward: 1:3.5
Potential Duration: 1 to 5 days
NB: This speculation can be considered to make decisions on lower timeframes.
Watch this space for updates as price action is been monitored.
Risk Disclaimer:
Margin trading in the foreign exchange market (including foreign exchange trading, CFDs, etc.) has a high risk and is not suitable for all investors. The content of this speculation (including all data) is organized and published by me for the sole purpose of education and assistance in making independent investment decisions. All information herein is for your reference only and I take no responsibility.
You are hereby advised to carefully consider your investment experience, financial situation, investment objective, risk tolerance level, and consult your independent financial adviser as to the suitability of your situation prior to making any investment.
I do not guarantee its accuracy and is not liable for any loss or damage which may result directly or indirectly from such content or the receipt of any instruction or notification therewith.
Past performance is not necessarily indicative of future results.

EURGBP | EXCLUSIVE EXPECTATIONAfter Price broke down 0.90000, we saw a rejection of this level last week with a high expectation of diving down.

S&P500 Futures Break Down of Wedge Pattern 15m ChartFutures opened up green but have been inside of a rising wedge. Usually these breakout to the downside, which played out beautifully here.
For now it seems the bulls have lost their momentum but as I was typing these we even started breaking down further. My next target is my marked support. We could get bigger moves now.

Crude oil - another warning message for the marketsAfter almost two month period of consolidations, CL1! is breaking down from bear flag, indicating high probability of significant decline (10-20%) to 30$ level ahead.
But what is more important I think, breakdown in crude oil acts as another hint of what to expect from risky assets going forward, and clear warning sign that more downside in equities should be expected.

France is breaking down as well?EURONEXT:CAC is another index losing support right now, which if no recaptured in the upcoming hours may lead to another 10% decline in the upcoming days/weeks.


FSLY- Can it recover? Multi-time frame analysisBoth weekly and daily demand zones look shaky and precarious.
There are still AKAM and NET. Diversify your CDN and edge computing plays.

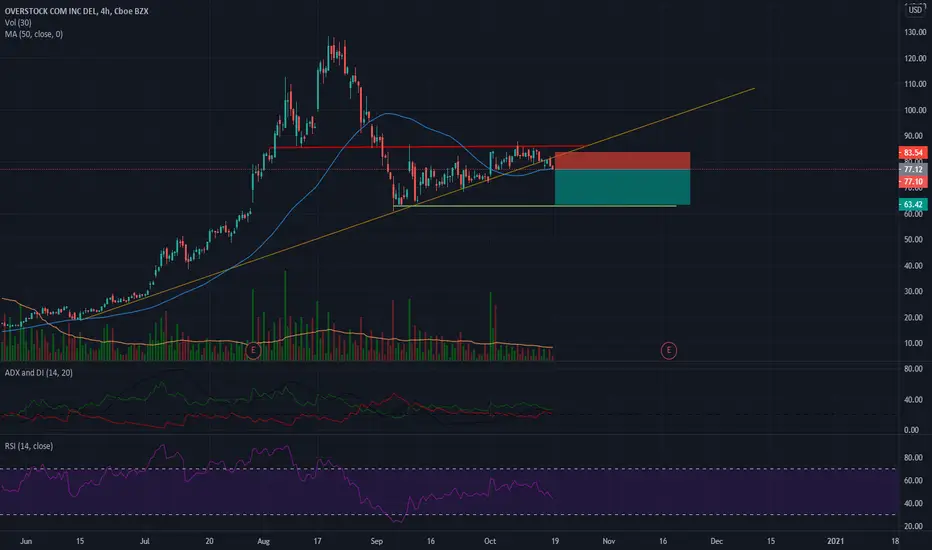
OSTK short ideaOSTK break uptrend line.
Now got support on 50MA. in case it will break down the 50MA, it will trigger a short position with 1:2 risk-reward ratio.
take profit @64
stop loss @84
HMMJ.CA trying to fight back Obviously, the 200DMA is still key. Until we breach the 200 day, we're stuck in purgatory. However, immanently, if we can get back to previous short term support, it would be constructive.

SQ- Square$SQ - Square closed at 169.61 on Friday. SQ
made a strong move after breaking
above the 158 level mentioned last Sunday.
SQ did touch the 170 resistance but failed to
hold above. If SQ can't break
above 170 this week it can get stuck range
bound between 163-170 for now. SQ above
170 should move towards 188-191.

EURUSD | PERSPECTIVE FOR THE WEEKIt is over 150pips in our direction since my last publication on this pair (see link below for reference purposes); The “risk-off” situation going on globally appears to favor the US dollar as the Euro rejected the Demand zone and fell during the trading session on Friday to close below $1.17500 (making this level a Supply zone as Selling pressure increases from this area).
Tendency: Downtrend ( Bearish )
Structure: Breakdown | Harmonic (AB = CD)
Observation: i. The Breakdown of the $1.17500 level mid last month followed by a rejection of this level last week insinuates a risk of further decline in the coming week(s).
ii. As the selling pressure continues to accumulate around $1.17500 - chances of a Breakdown of $1.1700 (Key Level) become greater.
iii. It is worthy to note that the rejection of $1.17500 is exactly at a 61.8% retracement of AB Leg with a better chance of forming the AB = CD pattern as stated below;
iv. ABCD parameters;
a. Impulse A-to-B will be in harmony with the potential C-to-D leg.
b. The B- to-C leg is at 61.8% Fibonacci retracement of the A-to-B leg.
c. The C-to-D leg is expected to fall within 127.2 - 1.414% Fib. ext. of the A-to-B move.
Trading plan: SELL confirmation with a minimum potential profit of 180 pips.
Risk/Reward: 1:4
Potential Duration: 2 to 6 days
NB: This speculation can be considered to make decisions on lower timeframes.
Watch this space for updates as price action is been monitored.
NirvanaForex
Risk Disclaimer:
Margin trading in the foreign exchange market (including foreign exchange trading, CFDs, etc.) has a high risk and is not suitable for all investors. The content of this speculation (including all data) is organized and published by me for the sole purpose of education and assistance in making independent investment decisions. All information herein is for your reference only and I take no responsibility.
You are hereby advised to carefully consider your investment experience, financial situation, investment objective, risk tolerance level, and consult your independent financial adviser as to the suitability of your situation prior to making any investment.
I do not guarantee its accuracy and is not liable for any loss or damage which may result directly or indirectly from such content or the receipt of any instruction or notification therewith.
Past performance is not necessarily indicative of future results.
