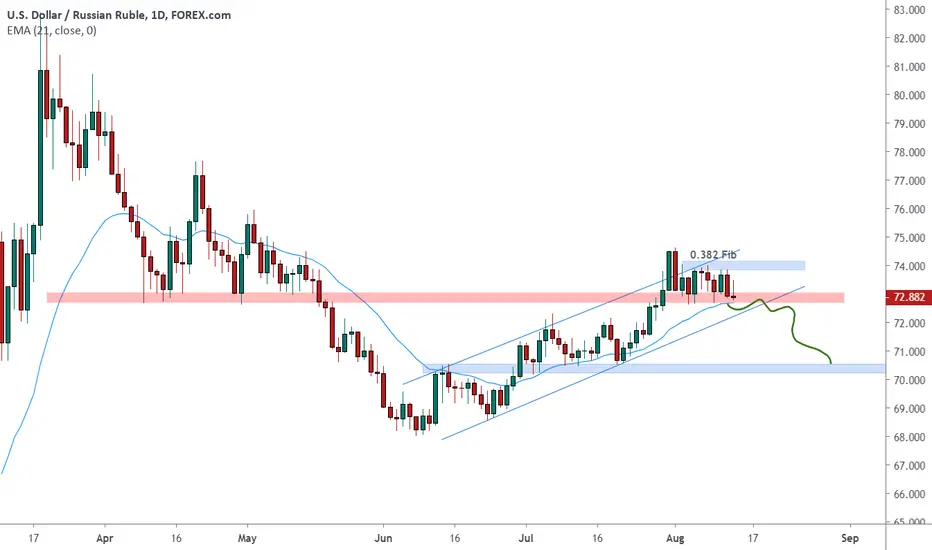
USDRUB short outlook 🦐USDRUB is side ranging between the weekly support (red) and the 0.382 fib level retracement.
Market has been inside an uptrending channel for the whole reteracement move.
IF the market will manage to break and close below the weekly structure and consequently will break the channel, according with Plancton's strategy we can set a nice short order.
–––––
Follow the Shrimp 🦐
Here is the Plancton0618 technical analysis, please comment below if you have any question.
The ENTRY in the market will be taken only if the condition of Plancton0618 strategy will trigger.
Breakdown
Reliance at a make or break levelNSE:RELIANCE is at a make or break level. It has respected the lower trendline since a long time, but it now faces strong resistance due to sentimental factors as well as rejection of 2200 psychological level. With the AGR dues hearing not being too favourable for Jio and the final verdict expected on August 17th, Monday's trading session should be quite crucial for RIL to keep its flawless uptrend intact.
Historically, the stock has given a fakeout fake out before retracing and then hitting a new ATH after a few weeks. Monday me be one of two things:
Fake out.
Retracement.
Continuation of the uptrend (which may later bring up the discussion about fake out vs break out once again).
Adding to the uncertainty, the past week has not seen very healthy volumes, especially on the trendline support.
While the trend is not bearish yet, I am not confident about entering fresh longs just yet, especially due to news-based factors.

EUR/USD is a Short from now! H&S.Hey, I am back with another EUR/USD idea.
So yesterday I have successfully shorted EUR/USD, see for yourself !
But I think I had missed the bigger picture..
Why? Let me Explain.
So as may know, I was a short term bull on EXY and the EUR/USD pair after it has broke out of Cup and handle pattern.
The pattern.
But now the 4H time frame has printed a legit Head and Shoulders bearish formation, which usually acts a Trend Changing formation.
Technical aspect of the chart
If we look at 1 Daily chart , we can see three things.
1. Daily Dojo Candle
2. RSI struggling to find support at key bullish continuation level of 60.
3. MACD Selling wave has started.
Looking at current chart in front us, 4H.
1. EMA's 20 and 50 are very near, giving a signal of possible trend change and increased volume!
2. RSI is holding at last neutral level 40, below it's bearish.
3. MACD has given sign of a continuation.
And how about DXY, is it in downtrend?
Yes, I agree DXY is still for me considered as downtrend Index, but it looks like it's gaining some bull power and showing a potential try to make a trend change.
And how are you going to trade this?
I am thinking about putting a sell limit somewhere around 1.17190, which would mean a lower low, that automatically brings sell volume , see the Trade on the chart.
That's it friends, please, if you enjoyed this Analysis and you would like more, let me know by Agreeing with this Idea, of course only if you agree haha.
Cheers and good luck trading!
Tibor

USDCNH | MY PERSPECTIVE FOR THE WEEKSince my last publication on this pair (see link below for reference purposes); price has moved over 500pips in our direction followed by a correction move with the anticipation of a further decline scattered all over the place! As USDCNH risk a further decline in the following week, a retest of my Key level is red flag to watch out for in the following week(s).
Tendency: Downtrend ( Bearish )
Structure: Retracement | Trendline | Breakdown | Supply & Demand
Observation: i. Breakdown of my Key zone @ 6.98000 followed by a retest of this zone in the following week confirms my Bearish bias on this one.
ii. Correction of Breakdown impulse leg appears to culminate at my key zone which is 61.8 retracements.
iii. It is also worthy to note how selling pressure has been strong at the corridors of my Bearish Trendline since it's inception in June 2020.
Trading plan: SELL confirmation with a minimum potential profit of 600 pips.
Risk/Reward: 1:3
Potential Duration: 3 to 7 days
NB: This speculation can be considered to make decisions on lower timeframes.
Watch this space for updates as price action is been monitored.
NirvanaForex
Risk Disclaimer:
Margin trading in the foreign exchange market (including foreign exchange trading, CFDs, etc.) has a high risk and is not suitable for all investors. The content of this speculation (including all data) is organized and published by me for the sole purpose of education and assistance in making independent investment decisions. All information herein is for your reference only and I take no responsibility.
You are hereby advised to carefully consider your investment experience, financial situation, investment objective, risk tolerance level and consult your independent financial adviser as to the suitability of your situation prior to making any investment.
I do not guarantee its accuracy and is not liable for any loss or damage which may result directly or indirectly from such content or the receipt of any instruction or notification therewith.
Past performance is not necessarily indicative of future results.

CADCHF | MY PERSPECTIVE FOR THE WEEKDespite the Bullish run (Corrective move) from late July 2020; The anticipation of negative numbers and economical dent from Unemployment rate and Net Change in employment was not a convincing yard for a continuing rally. Price broke out of my Key level in the beginning of the week only to Break down and close below this level in the latter part of the week inciting a much good reason for Buyers to step aside for a better deal in the following week(s).
Tendency: Downtrend ( Bearish )
Structure: Retracement | Trendline | Breakdown
Observation: i. The fall of price that began mid-July appears to continue its second phase of decline after completing a correction into 61.8 retracements of impulse leg.
ii. Breakdown of my Key level @ 0.68300 is enough signal for me to consider Bearish bias this coming week.
Trading plan: SELL confirmation with a minimum potential profit of 120 pips.
Risk/Reward: 1:2.5
Potential Duration: 3 to 10 days
NB: This speculation can be considered to make decisions on lower timeframes.
Watch this space for updates as price action is been monitored.
NirvanaForex
Risk Disclaimer:
Margin trading in the foreign exchange market (including foreign exchange trading, CFDs, etc.) has a high risk and is not suitable for all investors. The content of this speculation (including all data) is organized and published by me for the sole purpose of education and assistance in making independent investment decisions. All information herein is for your reference only and I take no responsibility.
You are hereby advised to carefully consider your investment experience, financial situation, investment objective, risk tolerance level and consult your independent financial adviser as to the suitability of your situation prior to making any investment.
I do not guarantee its accuracy and is not liable for any loss or damage which may result directly or indirectly from such content or the receipt of any instruction or notification therewith.
Past performance is not necessarily indicative of future results.

NZDUSD | MY PERSPECTIVE FOR THE WEEKThe NZD/USD pair is struggling to make a decisive move in either direction amid a lack of significant fundamental drivers in the latter part of the week. I am keeping a tab on a possible driver this week as we await Monetary Policy, RBNZD Rate and Interest rate decision on Wednesday for a possible headway. The NZD/USD pair closed the third straight day in the positive territory on Thursday but failed to preserve its bullish momentum on Friday which is a signal of a strong move coming in the following week(s).
With over 80pips in our direction (see link below for reference purpose) before experiencing a decline later in the week; insinuates a weakness of Buyers to push the price to complete Harmonic expectations (AB =CD) hereby making 0.66000level my Key level again for this week as I shall be looking at price reaction at this juncture in the market.
Tendency: Downtrend ( Bearish )
Structure: Channel | Trendline | Breakdown
Observation: i. A Breakdown (0.66375) and Re-test of Current Bullish Trendline (0.66900) on 4H gives a clue in the direction of a shift at the moment that drives towards a Bearish bias.
ii. I was expecting the price to make a Harmonic move (AB = CD) last week but unfortunately, it didn't as the 0.66900 level appears to be a level packed with Selling Pressure driving price further down.
iii. A significant Breakdown of my Key level in the following week(s) shall be a Bearish signal for me as I will be anticipating a hit of my Daily Trendline (seen on the chart) which also coincides with the nearest major Support @ 0.64000 (a psychological level).
iv. It is worthy to note that the economic news coming up mid-week shall be a significant driver in the direction of market participants in the following week(s).
Trading plan: SELL confirmation with a minimum potential profit of 250 pips.
Risk/Reward: 1:3
Potential Duration: 5 to 10 days
NB: This speculation can be considered to make decisions on lower timeframes.
Watch this space for updates as price action is been monitored.
NirvanaForex
Risk Disclaimer:
Margin trading in the foreign exchange market (including foreign exchange trading, CFDs, etc.) has a high risk and is not suitable for all investors. The content of this speculation (including all data) is organized and published by me for the sole purpose of education and assistance in making independent investment decisions. All information herein is for your reference only and I take no responsibility.
You are hereby advised to carefully consider your investment experience, financial situation, investment objective, risk tolerance level and consult your independent financial adviser as to the suitability of your situation prior to making any investment.
I do not guarantee its accuracy and is not liable for any loss or damage which may result directly or indirectly from such content or the receipt of any instruction or notification therewith.
Past performance is not necessarily indicative of future results.

BTC seems to be entering narrow range for time beingBTC seems to be entering the narrow range, it should be able to give breakout/breakdown from here when volumes again kick in, the view is still in bullish direction.

USDCAD | PERSPECTIVE FOR THE WEEKMy bias on this publication last week (see link below for reference purposes) was rendered invalid as price broke down 1.33800 level given rise to a stronger CAD, which might result in a further decline as price retest 1.38000 level.
The Loonie appears to begin the rally off of a backdrop of upside economic surprises and stronger commodity prices. Buyers couldn't continue the moment despite good figures resulting from NFP positive outlook on Friday as the price appears to stall at 1.33800 (Breakdown zone).
Tendency: Downtrend (Bearish)
Structure: Supply & Demand | Channel
Observation: i. Since Breakdown/Retest of 1.35000 level in mid-July 2020, the Bulls have found it immensely difficult to raise the bar resulting in a Channel to the downside.
ii. As selling pressure increase from my Key level @ 1.35000, I shall be looking out for Sell confirmation in the coming week on this pair.
Trading plan: SELL confirmation with a minimum potential profit of 300 pips.
Risk/Reward: 1:3
Potential Duration: 2 to 6 days
NB: This speculation can be considered to make decisions on lower timeframes.
Watch this space for updates as price action is been monitored.
NirvanaForex
Risk Disclaimer:
Margin trading in the foreign exchange market (including foreign exchange trading, CFDs, etc.) has a high risk and is not suitable for all investors. The content of this speculation (including all data) is organized and published by me for the sole purpose of education and assistance in making independent investment decisions. All information herein is for your reference only and I take no responsibility.
You are hereby advised to carefully consider your investment experience, financial situation, investment objective, risk tolerance level and consult your independent financial adviser as to the suitability of your situation prior to making any investment.
I do not guarantee its accuracy and is not liable for any loss or damage which may result directly or indirectly from such content or the receipt of any instruction or notification therewith.
Past performance is not necessarily indicative of future results.

VisaVery nice setup for Visa as it appears to be looking to break down out of a range for the past month and a half. Below the low of Friday around the $189.50 area looks like a very good opportunity to short down to a lower support for a $2 move. An overall market uptrend may try to stall this move, but it appears to be ready nonetheless.

USDCNH | WEEKLY PERSPECTIVERecent upbeat data from China standing in contrast to the sluggish US statistics, the Bears once again are gradually regaining control as Sellers bombard 6.9900 level, down 0.15% on the last day of last week. With a meagre 45pips since my last publication on this pair (see link below for reference purposes), my Bearish bias still persists as price action has been caught within a consolidation phase with the anticipation that a Breakout from this range might be emphatic in the following week(s).
Tendency : Downtrend ( Bearish )
Structure : Channel (Bearish Rectangle)
Observation : i. The fall of the USD since the beginning of July 2020 appears to continue even though we had a heavy consolidation pattern throughout the later part of last month.
ii. My Key level at 6.98000 is still a level on my radar in the coming week as I anticipate a significant Breakdown considering the selling pressure @ 7.00500.
iii. Kindly refer to my previous broadcast on this pair as the Harmonic expectation (AB = CD) is still in existence.
Trading plan : SELL confirmation with a minimum potential profit of 550 pips.
Risk/Reward : 1:3
Potential Duration : 1 to 5 days
NB: This speculation can be considered to make decisions on lower timeframes.
Watch this space for updates as price action is been monitored.
NirvanaForex
Risk Disclaimer:
Margin trading in the foreign exchange market (including foreign exchange trading, CFDs, etc.) has a high risk and is not suitable for all investors. The content of this speculation (including all data) is organized and published by me for the sole purpose of education and assistance in making independent investment decisions. All information herein is for your reference only and I take no responsibility.
You are hereby advised to carefully consider your investment experience, financial situation, investment objective, risk tolerance level and consult your independent financial adviser as to the suitability of your situation prior to making any investment.
I do not guarantee its accuracy and is not liable for any loss or damage which may result directly or indirectly from such content or the receipt of any instruction or notification therewith.
Past performance is not necessarily indicative of future results.

Btc needs breakout/down from the marked area to moveBTC is in need of breakout or down in the marked areas to give further massive move. I expect it to make a rally on positional timeframes soon

BTC at important resistance 11750-60This is important resistance, if broken we might have a good rally if not from here there will be some retracement.

USDJPY | WEEKLY PERSPECTIVEThe Greenback began a downward spiral at the beginning of last week as it came under strong Bearish pressure with the souring market sentiment to Breakdown my Key level @ 106.500 later in the week. With over 125pips in our direction since my last publication on this pair (see link below for reference purposes); the scope of the USDJPY pair to extend the decline becomes more pronounced.
Tendency: Downtrend ( Bearish )
Structure: Breakdown | Support & Resistance | Supply & Demand
Observation: i. Price action fell into an indecision pattern since early June 2020 to finally Breakdown of the Channel late last week.
ii. Breakdown off of 106.500 signals an extension in the decline of the USD as I anticipate a correction into this level for rally continuation.
iii. A Breakdown coinciding with Bearish Trendline @ 106.000 further confirms my bias.
Trading plan: SELL confirmation with a minimum potential profit of 160 pips.
Risk/Reward: 1:3
Potential Duration: 4 to 10 days
NB: This speculation can be considered to make decisions on lower timeframes.
Watch this space for updates as price action is been monitored.
NirvanaForex
Risk Disclaimer:
Margin trading in the foreign exchange market (including foreign exchange trading, CFDs, etc.) has a high risk and is not suitable for all investors. The content of this speculation (including all data) is organized and published by me for the sole purpose of education and assistance in making independent investment decisions. All information herein is for your reference only and I take no responsibility.
You are hereby advised to carefully consider your investment experience, financial situation, investment objective, risk tolerance level and consult your independent financial adviser as to the suitability of your situation prior to making any investment.
I do not guarantee its accuracy and is not liable for any loss or damage which may result directly or indirectly from such content or the receipt of any instruction or notification therewith.
Past performance is not necessarily indicative of future results.

Btc looks to be narrowing range over weekendBtc is entering a narrow range of pattern in a weekend, breakout/down from here is worth trading.

Symmetrical triangle formed NYSE:T
Looking for a breakdown <30.00 or breakout >31.00 in coming weeks. I would base a prediction off of their financials which I see as showing positive potential.

💣 ATTENTION! Powerful Brent breakdown! Opportunity to make $ or💸 Friends, we hope the graph is clear, which is more likely to happen. Risk / return ratio at excellent levels. Unfortunately links and names where we trade can not be placed, as the administration blocks all posts, but we think you can easily find us if you want in social networks!
👉 And the most important! Please remember that any bet can lose, and invest no more than 2% of the capital. Manage wisely! According to our system of 4 screens, this is a great opportunity!


$USO ETF Ascending Triangle Pattern$USO (United States Oil ETF) is currently in a Ascending Triangle Pattern and is near a breakout/breakdown point.
Upside Breakout Target: $33 to $34.
Downside Breakdown Target: $24.50 to $23.50.
Large Volume is needed to confirm the breakout or breakdown.

*CADCHF* trend continuationi expect a breakdown from the minor zone before a small retest and a signaling bar example(3 bar reversal or bearish engulfing ) before making an entry for the continuation of the trend

USDCAD | WEEKLY FORECASTAs the Greenback appears to be losing steam across major pairs; A Breakdown of our Key level (1.35500) last week is a significant Bearish signal for us.
Tendency: Downtrend ( Bearish )
Structure: Break-down | Support & Resistance
Observation: i. . 786 retracement of the most recent Bearish Impulse leg culminates at 1.37000 followed by a Bearish momentum.
ii. The Bearish momentum which started last week finally breaks our key level @ 1.35500 which also coincides with a Breakdown of our Bullish Trend .
iii . Expecting a further rally to the downside in the following week(s) with a 1.414 extension target.
Trading plan: SELL confirmation with a minimum potential profit of 350 pips.
Risk/Reward: 1:3
Potential Duration: 4 to 8 days
NB: This speculation can be considered to make decisions on lower timeframes.
Watch this space for updates as price action is been monitored.
Nirvana! Forex
Risk Disclaimer:
Margin trading in the foreign exchange market (including foreign exchange trading, CFDs, etc.) has a high risk and is not suitable for all investors. The content of this speculation (including all data) is organized and published byme for the sole purpose of education and assistance in making independent investment decisions. All information herein is for your reference only and NFTI takes no responsibility.
You are hereby advised to carefully consider your investment experience, financial situation, investment objective, risk tolerance level and consult your independent financial adviser as to the suitability of your situation prior to making any investment.
NFT&I does not guarantee its accuracy and is not liable for any loss or damage which may result directly or indirectly from such content or the receipt of any instruction or notification therewith.
Past performance is not necessarily indicative of future results.

NFLX (Netflix): Possible H&S PatternNFLX (Netflix) is developing a potential Head & Shoulders price pattern, on the daily chart.
Neckline Support in red is approximately $405 to $408 range.
Downside breakdown target would be -13%, or approximately $355 range.
If the H&S fails, NFLX would need to breakout above $444 and $459 to continue the uptrend.

FVRR (Fiverr): Possible H&S PatternFVRR (Fiverr) is developing a potential Head & Shoulders price pattern, on the daily chart.
Neckline Support in red is approximately 60.27.
Downside breakdown target would be -14.6%, or 51.48.
If the H&S fails, FVRR price would need to breakout above 66.39, 70.47, and 73.57 to continue the uptrend.

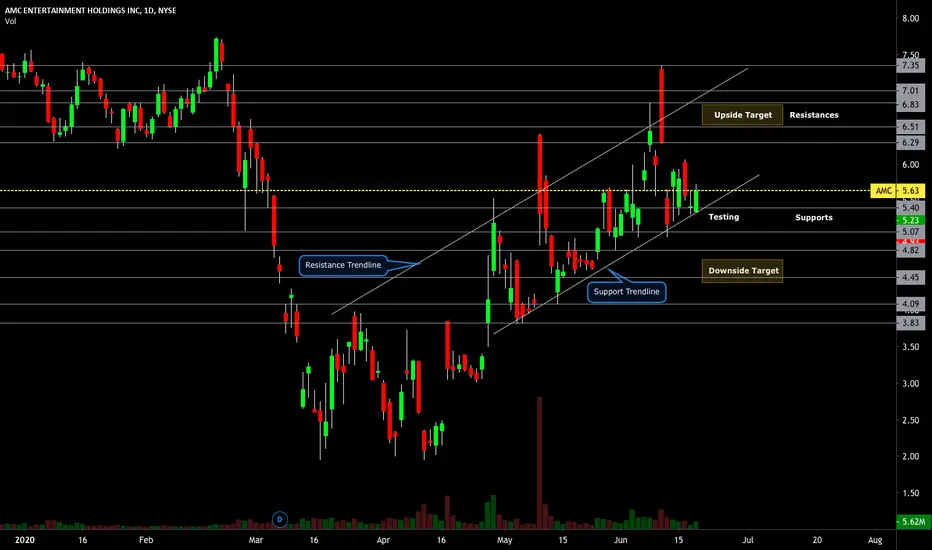
AMC: News Reaction PlayAMC (AMC Entertainment Holdings) is currently testing support and has been in a daily uptrend.
If support holds, a higher-high price level could be targeted in the 6.50 to 7.00 range.
If support fails, a lower-low price level could be targeted in the 5.00 to 4.50 range.
Resistance levels: 6.29, 6.50, 6.83, 7.00, 7.35.
Support levels: 5.40, 5.00, 4.50, 4.00, 3.83.