Breakdown

Home Depot Bearish Divergence Playing OutHD weekly chart had a bearish RSI divergence. The stock started breaking down on November 18th & has broken down through the support trendline this week as it nears the first potential pullback level.
There is a lot of call activity in this name today in the January 3, 2020, $230 calls.


EURUSDAfter a heavy rejection followed by a massive impulse to the downside, I expect some sort of pullback as we get very close to key level of resistance.
As well, with any impulse there must be some sort of liquidation/profit taking & the 50% fib zone seems appropriate,
- but so does any type of pullback so stay cognitive with prices movement.
For all we know the bulls could just be too overwhelming and continue to push down, but anticipate a pullback and make sure you are able to react properly when a decision is made.
EURUSD buy on pullback, take PP and hold onto position till next movement is confirmed. Then from there it's fair game.
Key is patience & execution
Cheers.


$CCMP Expect Further Weakness On Trend Line Breakdown$CCMP broke the uptrend yesterday and the stock crashed hard. For those that want to buy the dip, we advise not to. We think further weakness is ahead after yesterday's technical damage. The earliest near-term support we see is around $125.
Besides the technicals, $CCMP issued soft guidance, so the fundamentals don't support a higher price as well. Here are the highlights:
Cabot Microelectronics (CCMP -14.5%) beat Wall Street's earnings target on in-line sales in its Q4, but guided below views for the current quarter.
During the quarter, the company decided to cease future investment in the wood treatment business and not construct a new production facility to replace operations in Matamoros, Mexico and Tuscaloosa, Alabama, and triggered a non-cash impairment charge of $67.4M negatively impacting Q4 and FY results.
On a year-over-year basis, Cabot earnings rose 13% while sales jumped 78%, as revenue got a boost from its acquisition of KMG Chemicals. Excluding that deal, sales were flat vs. a year earlier.
For Q1, the company guided revenue of ~$279M, +26% Y/Y but flat sequentially
Electronic Materials revenue is expected to be approximately flat sequentially and Performance Materials revenue is expected to be approximately flat to up low single digits sequentially.
Forecasts FY 2020 adjusted EBITDA to be between $350M - $380M.
As always, use protective stops and trade with caution.
Good luck to all!

GOLD: Clear ranges for trading opportunitiesGold can go very fast in a short time so be ready to catch it on lower timeframes.
The daily chart shows a bullish trend but now its correction trend is valid.
The breakout of the top blue zone is required for long signals. The first take profit level is the last breakdown.
The continuation of the correction trend will be valid if the blue line is broken down. Watch out at the bottom blue zone because the price can be stuck there. If the price breaks down this zone and there is also a bearish wave system, then the profit zone is marked with the green rectangle.

Both side opportunities on DAXKeep in mind that we are in a bullish trend so we have to calculate with continuation of the upmovements. However, we are also in a profit zone of the higher timeframes so we have to be careful and need to plan the short opportunities as well.
The blue zones mark the support and the resistance. If one of the zone is broken then the green zone can be reached shortly.
Lower timeframes are suggested to use for finding earlier signal.
Feel free to share your thoughts and like it if you agree with.

Plan for the next week on GBPCADPrice is now at the correction trend, so watching this instrument is a key point. The continuation of the bull trend offers very good trade opportunities, so keep watching it not to miss.
Using lower timeframes is beneficial for finding sooner signals.
But be careful not to rush until the momentum is built.

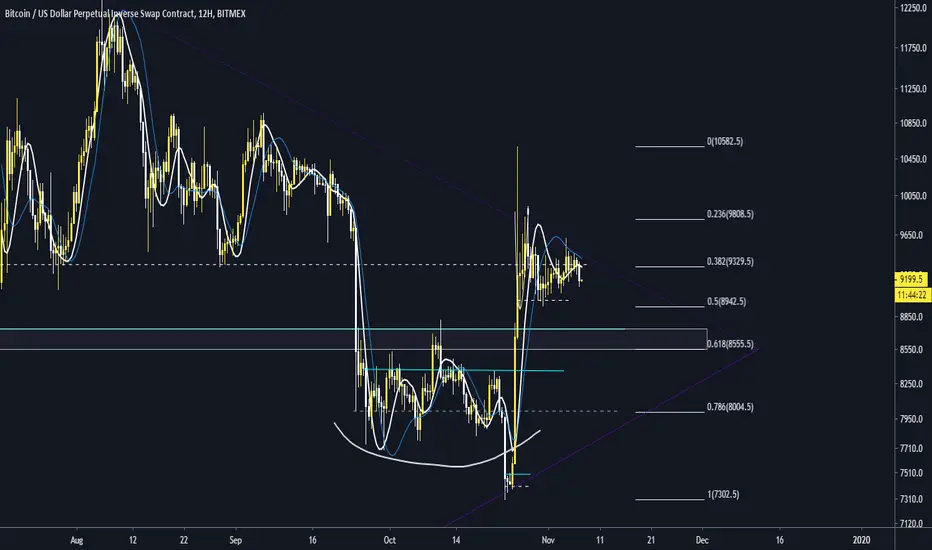
BTC in danger of a complete meltdownDecided to do a little follow up on my previous idea (below, under "Related ideas"). It took longer than expected but we finally seem to be getting that downside move. 12h time - frame says it the best here really:
1. my MAs are having a nearly perfect sell signal
2. structure on the lower time - frames has been clearly broken
3. 9350 is the key pivot here, yesterday we closed below it and so far we are pushing off of it
4. when it comes to bitmex funding longs are STILL paying shorts and I imagine sooner or later a lot of the people are going to get either stopped out or are going to close their positions which could lead into a absolutely nasty sell off
5. I could go on and on..
As far as targets go I am looking toward the white rectangle and the 0.618 retracement. What I would really like to see is for PA to take out the lows of that whole consolidation around the 8k region and quickly go back up - that would imply a liquidity run for the bigger players to fill in their longs to ultimately send BTC to 11k and beyond.
As always, nothing is guaranteed, have a SL and don´t be stupid.
Feel free to follow me on Twitter as I post a lot of quality stuff there:
twitter.com
Take care.
ROKU - ugly candle, but closed above the 61.8% retraceUgly daily candle, but we closed above the 61.8% retrace, I have my eye on the magenta trend-line for a long entry but the high volume and great attempt by the bulls today make me thinking we'll chop sideways into the trend. Decent volume at price at the magenta trend / support / fib confluence makes me optimistic of a bounce.
Feel free to add question and comments below, I'll check back to respond.

Breakdown before Golden Cross Part 1 & 2Before starting the "Golden Cross Part 1 & 2", this could well play out before entering the "Cross-Zone"..
(After ranging 5400-6500) See the nov 2018-march 2019 pattern in the green zone.


GBPNZD SHORT--Breakdowngbpnzd H4 chart price outlook.We are looking for sell opportunities.watch for clear breakdown and join sell wave

GRUB - Earnings BombGRUB was already in a descending triangle pattern. The stock did have a bullish RSI divergence at the beginning of October which did lead to prices rises somewhat to re-test the resistance line of the triangle pattern.
The price completely broke down after an ugly earnings report that was not taken well by the market prior to the market open. The breakdown price has held around the 1.618% Fibonacci Extension level. This is also the support level from back in March 2017. We will have to see where it ends the trading day.

Nasdaq - Rising Wedge - Breakout or Breakdown?The Nasdaq is at an important juncture at present time, as you can see we are in a massive rising wedge pattern (that typically resolves to the downside when triggered).
But it is also worth examining the last major bubble economy (given the current parallels) namely 2000 and 2007, in order to get a clearer picture of what is on the cards.
From what we can see it seems that while YES... as stated in my prior post, a yield curve inversion (YCI) is a very, very good recession/ crash indicator, it is not precise (obviously) therefore as investors and traders we need to have all bases covered.
I would not suggest going 100% short the market currently simply because of the fact that 2/2 of the last times there was a YCI, there were sustained rallies of varying intensity, in 2000 over 200% (fueled by the tech and internet bubble, so this is unlikely to occur again) and again in 2006 with a 30% rally from the point of first inversion.
What we need to take away from this is that despite ridiculous valuations, silly news driven headlines and flip flopping based on 'trade talks,' the market has proven to be an equal opportunity dream killer, both those who short too early and those who never exit their long positions when the market signals to do so.
P.S. It is worth elaborating on the rising wedge pattern seen in the Nasdaq, yes, it is a bearish sign and potentially a good shorting opportunity.
Look at the circled region on the chart during 2006 after the 1st YCI, that dip is an 18% drop in the index, for comparison i have drawn what an 18% drop from current values would look like.
Given the bearish pattern (rising wedge) and the overall lacking market sentiment despite being near ATHs i will be looking at playing a resolution to this pattern to the downside.


NOK short continuationRejected at zone and falling.
Brokevthrough trendline. Watch area
Around emas. With macd crossdown
Could retest bottom zone. Were on a
Gap fill end and at emas. Need confirmation
Below.
Join our discord for free colaboration, Chart Breakdowns, Trade Idea Alerts, Market Chat
discord.gg

****SHORT IDEA****Could be ready to break down this time, especially if the market looks weak. Short below 46
