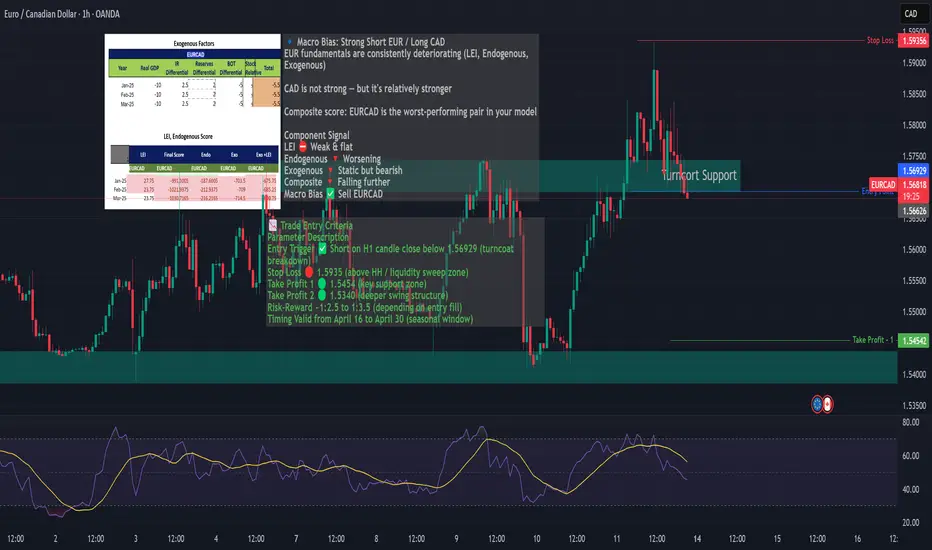
EURCAD Breakdown Watch–Bearish Divergence + Fundamental WeaknessEURCAD rallied into a key turncoat zone (former resistance → support)
Currently consolidating within this zone and showing clear RSI bearish divergence on both 1H and 4H timeframes.
Price is losing momentum while macro and seasonal factors align for a short bias.
🔍 Macro & Seasonality Confluence:
EUR Fundamentals: Worsening LEI, Endogenous & Exogenous scores
CAD Stability: Mildly bearish, but stronger than EUR
Seasonal Bias: EURCAD turns bearish after April 15
Breakdownshort
BNBUSDT 5% drawdown channeling H&S5% drawdown from the right shoulder of a Head and Shoulders pattern setup can be expected as drawn on this 15m chart. Price action in a parallel channel and downward impulse wave to fill the wave-iii. Chaikin Money Flown in a negative divergence as diving below zero plus Fisher transform 2H bearish crossing suggesting time correlation in 16h ahead.

Commodities ALUMINIUM Short Trade Thirty Minutes Time Frame30MTF
Short
Indicatrors: Bollinger bands , 200EMA , RSI
Bollinger bands 20Moving average rejection
Price closed below 200EMA
RSI Below 40
Dear traders, I have identified chart levels based on my analysis, major support & resistance levels.
Information shared by me here for educational purpose only. Please don’t trust me or anyone for trading/investment
purpose as it may lead to financial losses. Focus on learning, how to fish, trust on your own trading skills and please do consult your
financial advisor before trading.
Please do review, analyse and share your comments as well. Let us work and win together. Wish you a very happy, healthy & profitable trading day ahead!
Disclaimer: I have analysed the data based on my limited knowledge.
