XAUUSD Bearish SMC Analysis – Institutional RejectionXAUUSD Bearish SMC Analysis – Institutional Rejection from Supply Zone
Gold (XAUUSD) is showing a clear bearish structure after rejecting a major supply zone at premium pricing. This setup is aligned with Smart Money Concepts (SMC) and reflects how institutions manipulate liquidity and order flow before major price moves.
🔍 Market Structure Context:
The market had been trending upward with higher highs and higher lows, until it approached a key premium supply zone near $3,420.
At this level, price stalled, creating internal Equal Highs (liquidity) — a common trap used by institutions to grab orders before reversing.
🔄 Change of Character (CHoCH):
A clear CHoCH was printed when price broke below the most recent higher low, signaling a shift from bullish to bearish structure.
This change marked the first early signal that institutional order flow has flipped bearish, and distribution is underway.
📉 Break of Structure (BOS):
Following the CHoCH, the market confirmed intent with a clean BOS to the downside.
This structural break confirms bearish control and validates short bias.
🧲 Liquidity Engineering:
Equal Highs were swept at the top, indicating a liquidity grab before institutions drove price downward.
This move traps breakout buyers and provides large players with sell-side execution at premium pricing.
🧱 Fair Value Gap (FVG) & Supply Zone Mitigation:
After BOS, price retraced into a Bearish Fair Value Gap (FVG) and the origin of the supply zone, offering a high-probability entry.
The rejection from this zone showed imbalance was respected and no bullish continuation existed — further validating the short setup.
🔍 Confluences for the Bearish Bias:
Confluence Confirmation
CHoCH Structure flipped bearish
BOS Bearish continuation confirmed
Liquidity Sweep Equal highs taken
FVG Retest Smart Money re-entry signal
Supply Zone Mitigation Institutional reaction confirmed
📘 Educational Summary:
This setup exemplifies a complete Smart Money bearish reversal model:
Premium pricing ✅
Liquidity taken ✅
Structure flipped (CHoCH + BOS) ✅
Supply & FVG respected ✅
It reflects how institutions build positions quietly, using engineered liquidity to trap retail traders, and then drive price with high-volume imbalance moves.
Breakofstructure

GBPUSD Technical Breakdown – High-Probability Rejection Play📉 GBPUSD Technical Breakdown – High-Probability Rejection Play
🔥 Clean Structure | Strong Confluences | Smart Money Insight
This GBPUSD setup is a textbook example of price action meeting institutional behavior.
🧠 Key Observations:
• Break of Structure (BOS) identified multiple times confirming clear trend shifts.
• Price tapped into a well-defined resistance zone and showed an aggressive rejection, validating seller presence.
• Liquidity grab from the highs led to an immediate drop, marking the start of bearish momentum.
🎯 Target Zones:
• First TP: 1.33009
• Second TP: 1.32375
• Final Target: 1.31443 (aligned with major support zone and BOS retest)
🛡 Why This Setup Matters:
• Strong rejection from premium zone
• BOS confirms direction
• Volume and structure align for high RR potential
• Clean imbalance fill expectations
✅ Plan:
Sell from rejection zone with SL above the wick high. Trail stops as price approaches each target.

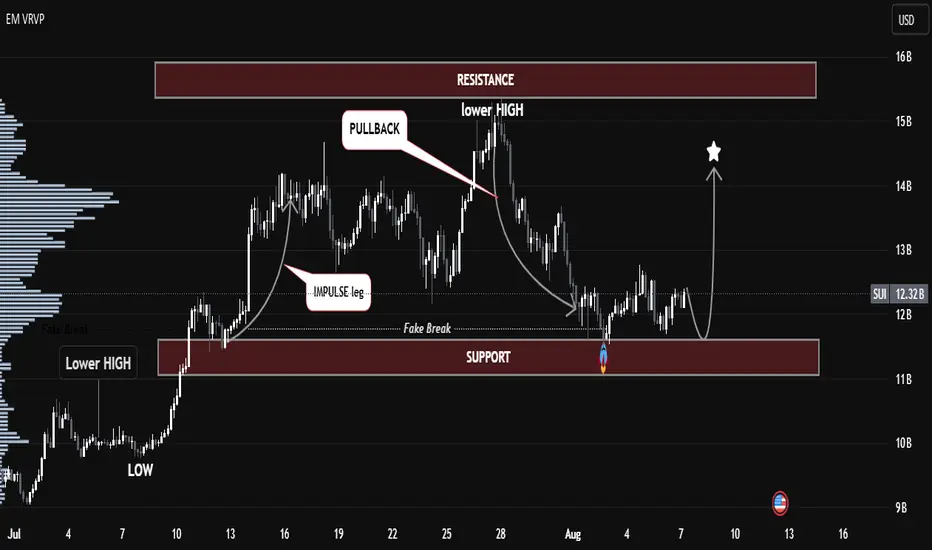
SUI/USDT – Smart Money Accumulation at Key Demand Zone📊 SUI/USDT – Smart Money Accumulation at Key Demand Zone | Bullish Outlook Ahead 🚀
The current SUI/USDT structure highlights a textbook Smart Money accumulation phase playing out at a key support zone, following a clear impulse–pullback–lower high formation.
🔍 Key Technical Insights:
🔻 Lower Highs Formation: A strong bearish structure led price back into the previous demand zone, sweeping liquidity below the support.
🎭 Fake Break Identified: Price action broke below the support briefly, indicating a liquidity grab (stop-hunt), often a precursor to bullish reversals.
🌀 Volume Node Alignment: Strong volume interest is building at the current support area, adding confluence for potential accumulation.
⚡ Projection Path: If the demand holds, expect a potential bullish reversal, targeting the previous resistance zone between 14–15B.
🧠 SMC Concepts in Play:
Fake Breakout = Liquidity Sweep
Impulse Leg = Institutional Activity
Pullback = Re-Entry for Smart Money
📈 Bullish Scenario:
Watch for confirmation around the support zone (~11B). A higher low or bullish engulfing pattern could trigger a rally toward 14B–15B resistance.
🛑 Bearish Invalidator:
A clean break and close below the 11B zone would invalidate the current bullish thesis.
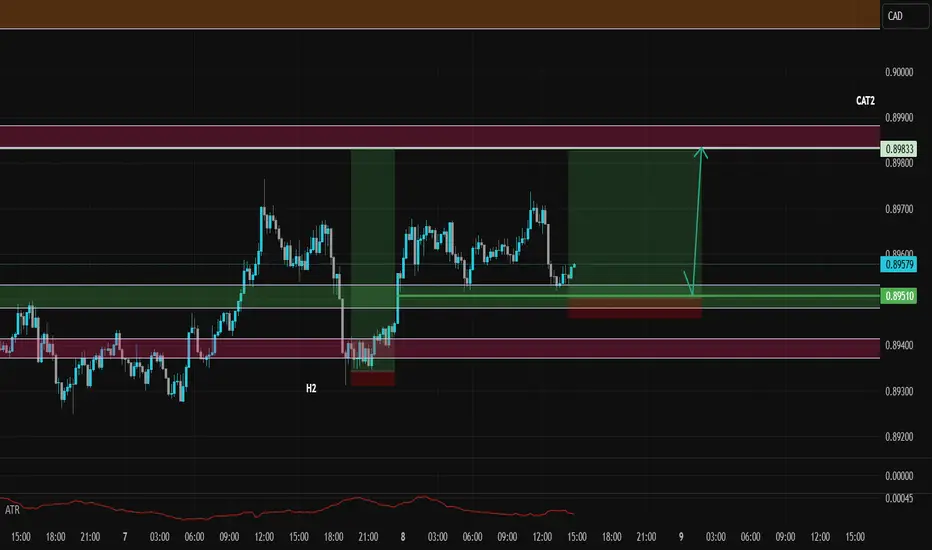
Sniper Entry on AUDCAD - SMC Concepts - Trade Code RevealedAlright snipers, here it is!
From today onwards, I will publish my live trades. My A+ setups.
In this one, I follow the H2 game ( Bullish) as there is no other game played at the moment on this pair contradicting my story.
Story says, H8 bullish, H2 bullish, BOS confirmed. Now market is mitigating towards an imbalance left behind and visible on m15/m8.
I am expecting this last point of true mitigation to be reached, inducing the last swing buyers who believe the market has to go up.
Also a very important info: market will break through the low of Asia and low of Europe sessions before taking off (0.89519)
No sign of reversal move either, H8 candles are closing above the H8 S/R. No sign of H2 or m30 reversal candlestick pattern (Rejection + Acceleration or Supply Zone). So we're good to go.
Enjoy this trade! See you on the one...
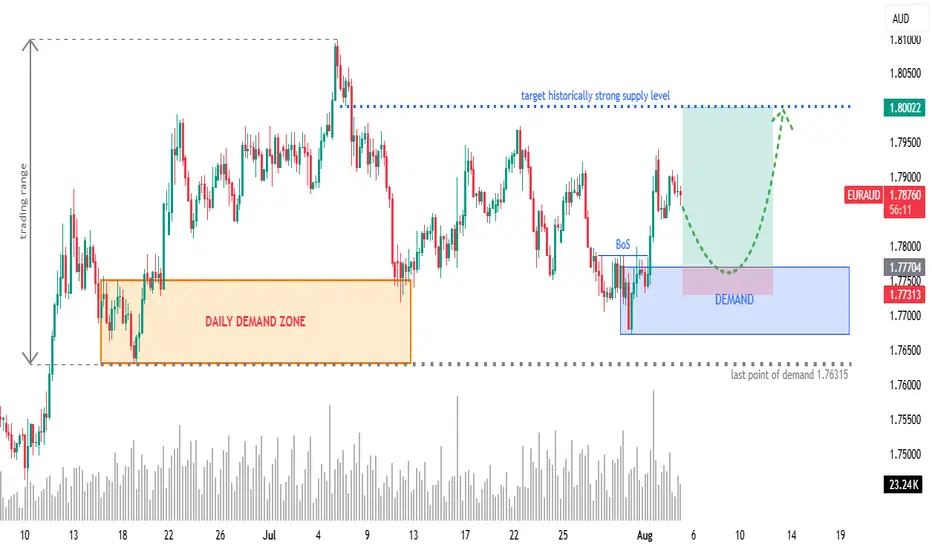
EURAUD 4H: Long Setup from Fresh Demand ZoneOverview:
OANDA:EURAUD retracing into a newly formed 4H demand zone after a bullish Break of Structure (BoS). Eyes on continuation towards a historically significant supply zone at 1.8000.
🧩 Setup Details
• Asset & Timeframe: EURAUD, 4H
• Bias: Bullish
• Entry Zone: 1.77300 – 1.77700 (DEMAND area)
• Targets:
🎯 T1 = 1.7900 (minor reaction level)
🎯 T2 = 1.8000 (historical supply level)
• Stop-Loss: Below 1.77300 (last valid demand)
• Risk-Reward: Approx. 1:6+
🧠 Why Now? (Trade Rationale)
• ✅ Fresh 4H Demand Zone: Price is retracing into a clear demand zone after rejecting lower prices.
• ✅ Break of Structure (BoS): Bullish BoS confirms shift in order flow.
• ✅ Volume Confirmation: Increasing demand near current price levels.
• ✅ Clear Liquidity Sweep: Price likely swept short-term lows before BoS.
• ✅ Target Supply Zone: 1.8000 is a well-respected historical supply/resistance level — clean magnet for price.
⏱ Multi-Timeframe Context
• Daily Chart: Price is reacting off a larger DAILY DEMAND ZONE. Trend bias is bullish.
• 4H Chart: Structure break + demand formation suggest continuation.
• 1H/Entry Level: Monitor price action in the blue zone for lower-timeframe confirmation (e.g. bullish engulfing, flip zones, LQ sweep, etc.) and potentially greater risk-reward.
📉 Risk Management & Duration
• Stop below 1.76315 keeps you protected from deeper invalidation.
• Trade Duration: Short to mid-term (1–4 days).
• Position Size: Scale based on volatility; ideal for swing trade conditions.
📌 Trade Plan Summary
📍 Watch for bullish PA on re-entry into demand (1.77300–1.77700)
📍 Set SL below 1.76315
📍 TP1 at 1.79000 — partials advised
📍 TP2 at 1.80000 — strong historical level
📍 Adjust SL to BE on momentum breakout
Trend Exhaustion Detected – Bearish Structure AheadUS100 (NASDAQ) 30-minute chart as of July 26, 2025, with technical insights based on the visible elements.
🔍 1. Trend Analysis
Primary Trend: Uptrend (bullish structure)
The price has been respecting a rising parallel channel, marked by:
Ascending support (lower boundary)
Ascending resistance (upper boundary)
Market structure shows:
Higher Highs (HH)
Higher Lows (HL)
✅ This indicates continuation of bullish momentum until structure breaks.
📐 2. Market Structure Elements
Structure Type Label on Chart Price Zone (approx.)
Break of Structure (BOS) BOS (center-left) ~22,950
Higher Low (HL) HL (2x) ~22,700 (1st), ~23,050 (2nd)
Higher High (HH) HH (2x) ~23,150 and ~23,300
Resistance Labelled ~23,300–23,320
Demand Zones Labelled ~22,450–22,700
🔁 Break of Structure (BOS)
The BOS occurred after a prior swing low was broken, followed by a new higher high, confirming a bullish shift.
🧱 3. Support / Resistance Analysis
🔼 Resistance Zone
The price is testing strong resistance around 23,300–23,320
Multiple rejections in this area
Trendline resistance also aligns here
A rejection arrow is drawn, indicating potential bearish reaction
🔽 Support Zone (Immediate)
23,180–23,220: highlighted green box is a local support block
If broken, likely to revisit 23,000–23,050, or even down to 22,900 range
🟩 4. Demand Zones
Zone 1:
22,450–22,600: Strong bullish reaction historically — likely to act as a key demand if a deeper pullback occurs
Zone 2:
22,850–22,950: Validated with prior accumulation & BOS event
🧠 5. Key Observations
Price is at a critical inflection zone:
Testing a resistance zone
At the upper trendline of an ascending channel
A bearish reaction is projected (black arrow)
Possibly targeting the green support zone around 23,180–23,220
If that fails, demand at ~23,000 will likely be tested
Ichimoku Cloud:
Currently price is above the cloud → still bullish
Cloud is thin → potential weakness or upcoming consolidation
⚠️ 6. Trading Bias & Setup Ideas
✅ Bullish Bias (if price holds above ~23,180)
Long entries can be considered on bullish reaction from support
Target: retest of 23,300–23,350 or even breakout continuation
❌ Bearish Bias (if breakdown below support)
Short entry valid below 23,180 with:
TP1: 23,050
TP2: 22,900
A breakdown from the ascending channel would signal trend exhaustion
🔚 Conclusion
Current Price: 23,298.4
Trend: Bullish, but at resistance
Next move: Watch for reaction at resistance and support box below
Bias: Neutral-to-bullish unless the structure breaks below ~23,180

XAUUSD: Demand Rejection or Breakdown? All Eyes on 3,300 ZoneChart Analysis Breakdown (30m TF – Gold/USD)
1. Market Structure Overview
Bearish Trend Dominance:
The price has shifted into a bearish structure after a Break of Structure (BOS) to the downside, indicating bearish control after failing to sustain higher highs.
Lower Highs & Lower Lows:
A consistent formation of LHs and LLs confirms bearish momentum.
2. Key Zones & Reactions
🟩 Demand Zone (~3,300–3,310):
Current price is reacting from a clearly defined demand zone.
Strong buying wick indicates interest and potential short-term bounce.
This zone has historical significance — previous reversal point.
🟥 Supply Zone (~3,420–3,445):
Price reversed sharply from here.
This is a key liquidity zone; expect heavy resistance if price retraces.
🔵 BOS Areas Marked:
Confirmed transitions in structure:
Bullish BOS followed by a bearish BOS — great illustration of shift in control.
🟨 Consolidation Blocks:
Highlighted ranging periods show distribution/accumulation phases before breakouts.
3. Trendlines & Channel Patterns
📉 Descending Trendline:
Acts as dynamic resistance.
If price retraces to this level (around 3,330–3,340), expect potential rejection unless broken cleanly.
📈 Previous Bullish Channel (Broken):
Price moved out of a bullish ascending channel, confirming bearish intent.
4. Ichimoku Cloud Context
Price is below the Kumo cloud, suggesting bearish bias remains intact.
Future cloud is bearish.
However, short-term pullback into cloud possible (especially if demand zone holds).
📊 Forecast & Trade Idea
Scenario 1: Bullish Rejection from Demand
Price may bounce towards 3,340 (previous S/R + trendline retest).
Watch for reaction at this level.
Scenario 2: Clean Break of Demand Zone
Opens path toward deeper downside (e.g., 3,280 or even lower).
Could trigger liquidity grab before reversal.

"XAU/USD Hits Major Demand – Is a Relief Rally Brewing?"🟡 XAU/USD (Gold) – Demand Zone Rejection in Play | Bullish Correction Ahead?
Timeframe: 30-Minute | Date: July 25, 2025
Created by: AllyPipsExpert
Indicators: Ichimoku Cloud, BOS (Break of Structure), Dynamic S/R, Trendlines
---
🔍 Technical Analysis & Key Insights:
🔸 1. Market Recap – Distribution & Downtrend Confirmation:
After the Break of Structure (BOS) near 3385, gold confirmed a bearish reversal following the distribution phase at the top resistance zone around 3445–3460.
Bearish momentum was sustained by a descending trendline, paired with a bearish Kumo (Ichimoku cloud) crossover.
🔸 2. Major Zone Tagged – Key Demand Area Tested:
Price has now reached the critical demand block at 3320–3340, a zone that previously initiated bullish impulse on July 18–19.
The current bullish projection (in blue) reflects potential short-term recovery or correction phase, following oversold conditions and historical support strength.
🔸 3. Bullish Reversal Potential – Short-Term Retracement?
The blue arrow reflects a likely bullish retracement toward 3360–3380, aligning with trendline retest and potential Kumo rejection.
Expect sellers to re-enter if price retests former BOS/imbalance zone, creating scalp or swing sell setups on confirmation.
---
🔧 Confluences & Technical Highlights:
Confluence Point Description
Demand Zone Strong previous accumulation at 3320–3340
BOS Retest Area Key liquidity level now acting as resistance
Ichimoku Cloud Price below cloud = bearish bias maintained
Descending Trendline Reinforces bearish structure unless broken
Price Action Rejection wick at demand + potential short squeeze
---
🎯 Trade Outlook:
🧭 Bias: Short-Term Bullish Rebound → Long-Term Bearish Continuation
🟩 Support: 3320 – 3340
🟥 Resistance: 3360 – 3385 (BOS & Trendline zone)
🔁 Scenario: Bounce → Retest → Continuation lower (unless breakout confirmed)
---
📘 Why This Chart Could Be Featured:
✅ Multi-layered Analysis: BOS, zones, cloud, price action, and psychological zones used together.
✅ Forward-Looking: Projects the next logical market reaction instead of just explaining the past.
✅ Clean, Structured, Educational: Layout and visuals guide the viewer through logical trade steps.
✅ Value-Packed: Provides actionable levels and flexible scenarios — helpful to traders of all levels.

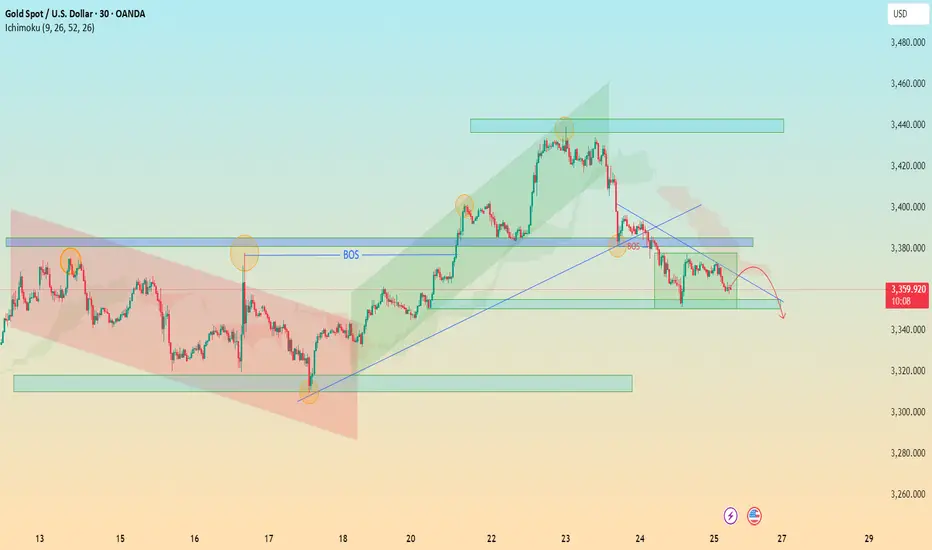
XAU/USD Bearish Retest in Motion – Watch 3340 for Breakout 🔍 XAU/USD (Gold) – Bearish Reversal Outlook
Timeframe: 30-Minute
Date: July 25, 2025
Indicators Used: Ichimoku Cloud, BOS (Break of Structure), Trendlines, Support & Resistance Zones
---
⚙ Technical Breakdown:
1. Previous Market Structure – Accumulation to Expansion:
Descending Channel (Red Box): Market moved within a bearish channel until the breakout occurred.
Key Break of Structure (BOS) around 3365 level signaled the beginning of bullish momentum — a textbook shift from accumulation to expansion phase.
Rally towards 3445 zone: Strong impulsive wave followed by higher highs and higher lows within a green rising channel.
2. Bull Trap and Structural Breakdown:
At the 3445-3460 resistance zone, price failed to maintain momentum and formed a double top / distribution setup.
The second BOS near 3385 confirmed a shift from bullish to bearish market structure.
Ichimoku Cloud also flipped bearish — price is now trading below the cloud, signaling potential continued downside.
3. Current Consolidation and Bearish Retest:
Price is now trapped in a bearish flag / rectangle pattern between 3360 – 3380.
Recent rejections from the descending trendline and overhead supply zone indicate weak bullish attempts and presence of strong selling pressure.
4. Anticipated Move – Bearish Continuation:
The projected red path suggests a retest of the diagonal resistance, followed by a breakdown toward key demand zone at 3340 – 3320.
If that zone fails, we may see a deeper move toward 3280.
---
📌 Key Technical Zones:
Zone Type Price Level (Approx.) Description
Resistance 3445 – 3460 Double Top / Strong Supply
Support 3340 – 3320 Historical Demand Zone
Short-term Resistance 3375 – 3385 BOS Retest + Trendline
---
🎯 Trading Insight:
📉 Bias: Bearish
⚠ Invalidation Level: Break above 3385 with volume
📊 Potential Target: 3340 → 3320
🧠 Trade Idea: Look for short entries on weak retests near descending trendline or cloud rejection.
---
🏆 What Makes This Chart Unique for Editors’ Picks:
✅ Multiple Confluences: Structural shifts (BOS), trendlines, Ichimoku, and classic patterns (channels, flags).
✅ Clear Visual Storytelling: Logical flow from bearish to bullish and back to bearish structure.
✅ Forward Projection: Predictive outlook based on strong technical context — not just reactive analysis.
✅ Educational Value: Useful for beginners and intermediate traders alike to understand structure transitions and key levels.
BTC/USD Technical Analysis — Educational BreakdownBTC/USD Technical Analysis — Educational Breakdown
🧠 Key Observations:
🔹 Market Structure: Break of Structure (BOS) Confirmations
The chart highlights multiple BOS points, showing clear transitions in market structure – a strong indication of bullish momentum building up after prior consolidation and retracements.
🔹 Support Zone (Demand Area): 115,355 – 117,403
This area has acted as a liquidity pool where buyers previously stepped in, forming the base for new BOS formations. A retest of this level could offer a high-probability long entry.
🔹 Resistance Zone (Supply Area): 123,375 Region
This marked level is a prior high and expected profit-taking or potential short-trigger zone. Price is likely to target this level if bullish momentum continues.
⸻
📈 EMA Analysis (20/50/100/200)
• Stacked Bullishly: EMAs are layered with the shorter-term EMAs (20/50) above the longer-term ones (100/200), suggesting trend continuation to the upside.
• Price reclaiming above all EMAs signals momentum is shifting from accumulation to expansion.
⸻
🔮 Potential Scenario:
1. Bullish Retest Play
A pullback toward the demand/support zone (116k–117.4k) can present a high-RR entry.
2. Continuation Toward Resistance
If price holds above the EMAs and structure, we could see a push toward 123,375, where profit booking may occur.
⸻
📌 Market Sentiment Bias: Bullish
• Structure: Bullish BOS
• Momentum: Above all EMAs
• Volume Profile: High acceptance near

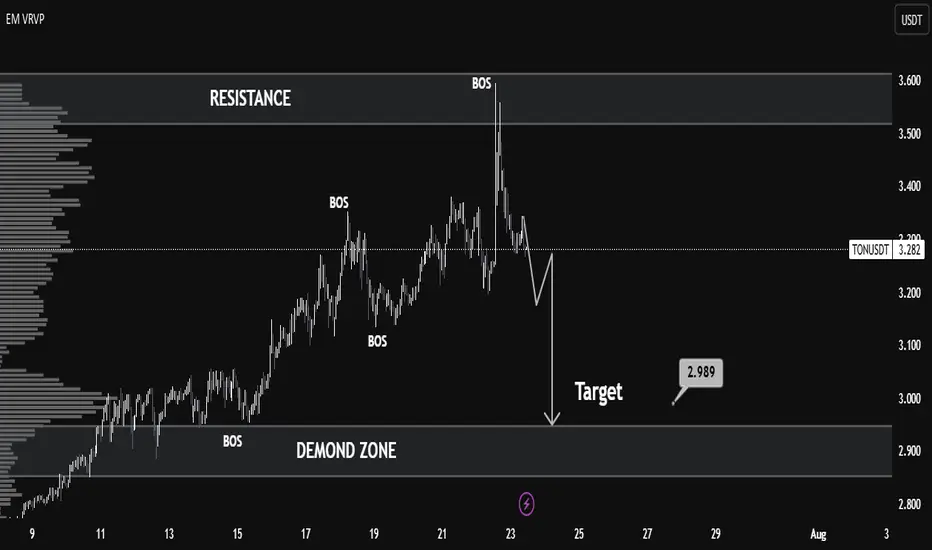
TONUSDT Technical Analysis – Bearish Shift with Clean TargetMarket Context:
TONUSDT recently showed strong bullish momentum, breaking multiple structure levels (noted as BOS – Break of Structure), indicating a clear uptrend. However, the most recent price action reveals a sharp rejection from the resistance zone around 3.55–3.60, marking a significant trend reversal.
Key Levels:
Resistance: 3.55 – 3.60
Price tested this zone and was strongly rejected, forming a potential top.
Demand Zone: 2.88 – 2.99
This zone provided previous accumulation and serves as a probable liquidity area and downside target.
Target: 2.989
The chart marks this as the near-term bearish objective, aligning with the volume node and prior demand.
Technical Signals:
Multiple BOS (Break of Structure):
Confirmed bullish structure earlier, but the latest BOS downward indicates a possible trend reversal.
Volume Profile (VRVP):
Shows high volume nodes around 3.00, suggesting strong market interest at lower levels — acting as a magnet for price.
Bearish Market Structure:
After the peak, the lower highs and lower lows pattern reflects short-term bearish dominance.
Liquidity Grab & Selloff:
The spike above resistance likely induced liquidity before a rapid selloff — classic distribution behavior.
Outlook:
If the market fails to reclaim levels above 3.35, a bearish continuation toward 2.989 remains likely.
The demand zone (2.88–2.99) is a critical area where buyers may re-enter — look for reversal signals here.
Conclusion:
TONUSDT has shifted from bullish to bearish in the short term. A clean rejection from resistance and strong structural breaks suggest a move toward the 2.989 demand zone. Traders should watch for confirmation of support or continuation upon reaching this level.
NZDCAD: Patience Before the PushNZDCAD on the 1H chart just completed a clean liquidity sweep below the previous day’s low. That long wick aggressively took out resting sell stops before price sharply reversed.
We’ve now seen a break of structure to the upside, showing a possible shift in market direction. Price is currently pulling back toward two visible imbalance zones (iFVGs), both sitting just below the previous day’s low.
If price trades into these iFVGs and gives us a clear bullish confirmation like a bullish engulfing candle, a rejection wick, or a strong break of structure on lower timeframes, we could look for continuation toward the liquidity above the highs.
📌 Key Levels
• Liquidity sweep below PDL
• Bullish break of structure
• iFVGs aligning as potential entry zones
• Final target: liquidity resting near 0.81900
🧠 Psychology Tip
The best trades don’t need to be forced. Wait for confirmation. A setup without a signal is just a theory. Protect your capital, trade your plan, and trust the process.

ETHUSD Smart Money Breakdown – Price Rejection from Premium ZoneEthereum has shown a strong impulsive rally after multiple Breaks of Structure (BOS) from early June, signaling a clear shift in market sentiment from bearish to bullish. Each BOS indicates that demand zones have been respected and liquidity has been efficiently used to fuel higher prices — a classic signature of institutional involvement.
🧠 Smart Money Insight
As price aggressively rallied into the resistance zone ($3,600–$3,800), the market entered a premium pricing area, where smart money typically offloads positions and hunts liquidity from late buyers. This area has historically been a high reaction zone — and as seen on the chart, ETH shows signs of buyer exhaustion, suggesting a possible short-term reversal.
🔁 Anticipated Market Behavior
A corrective move is likely from this resistance, and the first target for retracement lies in the support zone around $3,000–$3,200. This level aligns with:
Previous BOS retest area
Fair value imbalance fill
Mid-range equilibrium
If momentum continues downward, the next zone of interest will be the strong support region at $2,200–$2,400, which served as a major accumulation zone. That’s where large orders previously entered the market — and a strong reaction is expected again.
📊 Market Structure Summary:
BOS Confirmations: Validated bullish structure
Liquidity Grab: At resistance – potential sweep and reversal
Premium Zone Rejection: Smart money short opportunity
Discount Zone Targets: Support & strong support zones
✅ Conclusion
ETH is at a critical decision point. If price holds below resistance with continued bearish pressure, a retracement is not only healthy — it's expected. Traders should wait for confirmation of lower timeframe structure breaks before entering shorts, and target the $3,000 zone first, with eyes on $2,200 if momentum persists.

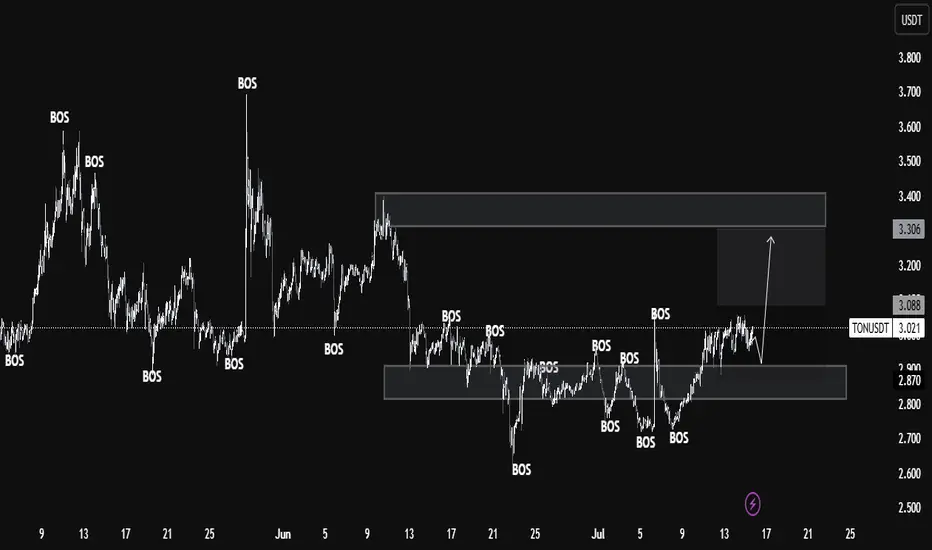
TON/USDT Monthly Structure Flip – Smart Money Targets $3.30+ Aft🔍 Key Observations:
Current Price: 2.974 USDT
Support Zone (Demand Area):
Strong demand zone around 2.870 - 2.800 USDT.
Price previously reacted multiple times from this zone, showing strong buyer interest and BOS confirmations.
Resistance Zone (Supply Area):
The next significant resistance lies in the range of 3.306 - 3.400 USDT.
This zone previously caused a BOS to the downside, making it a critical level to monitor for potential profit-taking or reversals.
Market Structure:
Price is currently consolidating just above the demand zone after a bullish BOS.
Recent BOS confirms a shift in structure from bearish to bullish bias.
Potential Price Path:
If price sustains above the 2.870 support, a bullish move targeting the 3.306 level is likely.
Expect short-term retracements within the structure but with a medium-term bullish bias.
Liquidity Mapping:
Liquidity is likely resting above the 3.088 local highs and the 3.306 major resistance.
Smart money may push price to these levels to mitigate orders or engineer exit liquidity.
📈 Educational Perspective:
This chart is a strong representation of Smart Money Concepts (SMC), particularly the use of BOS as confirmation for directional bias. Traders can look to:
Use the demand zone for potential long entries.
Watch for confirmation (like bullish engulfing or internal BOS) within the zone.
Manage trades toward the premium zone near 3.3 for a favorable risk-reward.
EURJPY Weekly Analysis (MMC + SMC) - Trend Expansion + Target🧠 Contextual Overview:
EURJPY has been on a strong long-term bullish rally, fueled by institutional demand and consistent volume expansion patterns. This pair is approaching a critical macro resistance/reversal zone around the 175–176 level, where historically large players have shown interest in redistributing or taking profit.
This analysis uses the MMC (Market Mechanics Concept) integrated with SMC (Smart Money Concepts) to provide a complete perspective on price structure, order flow, and volume behavior.
📊 Structural Breakdown:
🔹 1. Volume Expansion as a Leading Indicator
Volume precedes price — this is a foundational MMC principle.
The recent aggressive impulse to the upside is backed by clear volume expansion visible on higher time frames.
This type of movement indicates smart money accumulation and commitment, rather than retail-driven volatility.
A key insight: Volume Expansion typically signals trend continuation, not reversal—unless a liquidity grab or divergence shows up in reversal zones.
🔹 2. Break of Structure (BOS) Confirms Trend Continuation
A clear BOS occurred when price violated previous swing highs around the 165–167 range.
This BOS suggests a new bullish leg is forming, confirming the market has transitioned from consolidation (accumulation) to distribution (markup phase).
🔹 3. Current Price Path: Heading into a Key Reversal Zone (175–176)
This zone has been mapped based on previous supply imbalances and historical resistance.
Price may tap into this zone before we see either:
A clean continuation above (indicating absorption of supply), or
A rejection or smart money sell-off pattern (distribution, divergence, or exhaustion candles).
Institutions tend to execute significant moves in these areas — watch for liquidity sweep traps and break-of-structure (BOS) on lower timeframes for confirmation.
🧱 Support Zones & Safety Net:
🔸 Major Support: 155–157 Zone
This is a historically significant demand block, respected multiple times since 2023.
A drop into this region could offer a prime long-term swing entry, should price reject the reversal zone.
Also acts as invalidity for current bullish structure. A weekly close below this would signal a potential trend shift or deeper correction.
📉 Technical Patterns & Confluences:
Trendline Breakout + Retest occurred from 2024 into early 2025. This is a classic break-and-retest continuation pattern, confirming bullish interest from smart money.
Price consolidated (reaccumulation) and exploded upward with volume expansion, aligning with Wyckoff theory’s markup phase.
Strong candles with minimal upper wicks = clear sign of institutional commitment.
🎯 Trade Strategy & Scenarios:
🟢 Bullish Continuation Scenario:
If price breaks above 176.000 with volume and closes weekly bullish, expect continuation toward 180.00+ in coming months.
Watch for:
Clean BOS above the reversal zone
Volume expansion confirmation
Retest of breakout level (176–174) for safe re-entry
🔴 Bearish Rejection Scenario:
If price rejects the reversal zone with bearish engulfing or divergence, expect a retracement back toward 165–162 short-term, and possibly 157–155 long-term.
Lower time frame structure shift (BOS to the downside) will confirm early exit from bulls or reversal setups for bears.
🧠 Psychological Perspective:
Smart Money uses reversal zones to entice late buyers before triggering liquidity grabs.
Reversal zones serve as liquidity magnets, often leading to false breakouts before true direction is revealed.
Retail traders often buy into strength at these levels, providing liquidity for institutional exits.
📌 Summary:
✅ Trend: Strong bullish
✅ Structure: Clean BOS with volume confirmation
✅ Next Key Level: 175–176 (Reversal Zone)
✅ Strategy: Monitor for rejection/continuation; align with volume + structure
✅ Volume Behavior: Expansion supports trend continuation
🔖 Final Thoughts:
The EURJPY pair presents a highly educational and strategic opportunity. Whether you trade intraday or swing, this zone (175–176) will define the market direction for the next few months. Use volume, structure shifts, and institutional behavior to guide your trades, not just candlestick patterns.

What Is a Change of Character (CHoCH) and How Can You Trade It?What Is a Change of Character (CHoCH) and How Can You Trade It?
Navigating the nuances of Smart Money Concept (SMC) trading requires a keen understanding of market signals like the Change of Character (CHoCH). This concept can help traders detect and react to potential trend reversals. Today, we’ll delve into the mechanics of CHoCHs, explaining how they manifest in different market conditions and how they can be strategically leveraged for trading decisions.
Understanding Breaks of Structure
Understanding Breaks of Structure (BOS) is essential for traders before delving into concepts like Change of Character (CHoCH). A BOS in trading signifies a continuation within the current trend and is marked by a clear deviation from established swing points that indicate previous highs and lows.
In the context of an uptrend, a BOS is identified when the price exceeds a previous high without moving below the most recent higher low. This action confirms that the upward momentum is still strong and likely to continue as buyers push the market to new heights.
Similarly, in a downtrend, a BOS occurs when prices drop below a previous low without breaking the prior lower high, suggesting that sellers remain in control and the downward trend is set to persist.
By recognising these points where the market extends beyond its former bounds, traders can confirm that the current trend is robust and act accordingly. This foundational concept of BOS not only helps in assessing trend strength but also sets the stage for understanding more complex patterns like CHoCH, where the focus shifts from trend continuation to potential trend reversals.
CHoCH Trading Meaning
In trading, a Change of Character (CHoCH) signals a potential shift in market dynamics, often indicating a reversal from the prevailing trend. This concept is particularly valuable as it helps traders discern when the momentum is shifting, offering a strategic point to consider adjusting their positions.
A CHoCH occurs when there's a noticeable deviation in the market's price trend. For example, in a bullish trend characterised by a series of higher highs and higher lows, a CHoCH is indicated by the price failing to set a new high and subsequently falling below a recent higher low. This suggests that buyers are losing control, and a bearish trend could be emerging.
Similarly, during a bearish trend marked by lower highs and lower lows, a bullish CHoCH would occur if the price unexpectedly breaks above a recent lower high. This break indicates that sellers are losing their grip, and a bullish trend may be starting.
The Significance of CHoCHs Across Timeframes
The fractal nature of financial markets means that patterns and behaviours recur across various timeframes, each providing unique insights and implications for trading. Understanding CHoCHs in different timeframes is crucial for traders to effectively align their strategies with both short-term opportunities and long-term trend shifts.
In intraday trading, where decisions are made on lower timeframes (like minutes or hours), a CHoCH can signal a possible short-term trend reversal. For example, if a currency pair in a downtrend on a 15-minute chart suddenly posts a higher high, this could indicate a weakening of the bearish momentum, suggesting a potential bullish reversal.
Traders might use this information to close short positions or to consider a long position, capitalising on the emerging upward trend. These short-term CHoCHs allow traders to respond quickly to market changes, potentially securing returns before larger market shifts occur.
Conversely, CHoCHs observed on higher timeframes, such as daily or weekly charts, are particularly significant because they can indicate a shift in the broader market trend that might last days, weeks, or even months. Such changes can then be used by both long and short-term traders to adjust their positioning and directional bias.
How to Identify a CHoCH
The initial step to identify a CHoCH in trading involves clearly defining the existing trend on a specific timeframe. This is done by marking the significant swing highs and lows that delineate the trend's progress. These points should represent somewhat meaningful retracements in the price, providing clear markers of trend continuity or potential reversal points.
According to the Smart Money Concept (SMC) theory, the integrity of an uptrend is maintained as long as the price does not trade through the most recent significant higher low. Conversely, a downtrend is considered intact if the price does not surpass the most recent significant lower high. Therefore, traders focus their attention on these critical points.
To identify a CHoCH, traders watch for a break in these crucial high or low points. For instance, in an uptrend, a bearish CHoCH is indicated when the price achieves a higher high but then reverses to descend below the previous significant higher low.
Similarly, in a downtrend, a bullish CHoCH occurs when the price drops to a lower low before reversing to break above the previous significant lower high, setting a new high. Both types of breaks signal a potential reversal in the trend direction.
How to Trade a CHoCH
When trading a CHoCH, it’s essential to recognise that it should be integrated with other aspects of the SMC framework to get the best results. This includes the use of order blocks and imbalances, which are key components in identifying potential reversals.
Order Blocks and Imbalances
An order block is essentially a substantial consolidation area where significant buying or selling has occurred, and prices often revisit these zones before reversing. These blocks can be seen as levels where institutional orders were previously concentrated.
An imbalance, also known as a fair value gap, occurs when the price moves sharply up or down, leaving a zone that has not been traded extensively. Price often returns to these gaps to 'fill' them, establishing equilibrium before a potential reversal happens.
In practice, traders can look for a sequence where the price first approaches an order block and begins to fill any existing imbalances. This setup increases confidence in a potential reversal. As the price meets these criteria and a CHoCH occurs, this indicates that the influence of the order block is likely to initiate a price reversal.
Practical Example on GBP/USD
Consider the 4-hour chart of the GBP/USD pair above. We see the pair encounter an order block on the left, one that’s visible on the daily chart. As the price interacts with this block, it begins to retrace, attempting to fill the imbalance but moves away. Eventually, the price completes the fill of the imbalance and meets the previously established order block.
Switching to a 1-hour timeframe, this scenario unfolds similarly. After reaching the order block on the 4-hour chart, another CHoCH occurs, signalling the start of a new uptrend. This lower timeframe CHoCH, following the meeting of the order block, corroborates the potential for a reversal initiated by the higher timeframe dynamics.
This example illustrates how CHoCHs can be effectively utilised across different timeframes, tying back to the fractal nature of markets discussed earlier. By recognising these patterns and understanding their interaction with order blocks and imbalances, traders can strategically position themselves to capitalise on potential market reversals, aligning their trades with deeper market forces at play.
CHoCH vs Market Structure Shift
A Market Structure Shift (MSS) is a specific type of Change of Character that includes additional signals suggesting a potential trend reversal. Unlike a straightforward CHoCH that typically indicates a trend is shifting but may also be a false break, an MSS can be seen as a higher confluence CHoCH. An MSS occurs after the market first makes a key movement contrary to the established trend—forming a lower high in an uptrend or a higher low in a downtrend—without plotting a higher high or lower low.
Following these preliminary signals, an MSS is confirmed when there is a decisive break through a significant swing point accompanied by a strong displacement (i.e. impulse) move, creating a CHoCH in the process. This sequence not only reflects that the prevailing trend has paused but also that a new trend in the opposite direction is establishing itself.
Due to these additional confirmations, an MSS can offer added confirmation for traders, indicating a stronger likelihood that a new, sustainable trend has begun. This makes the MSS particularly valuable for traders looking for more substantiated signals in their trading strategy.
The Bottom Line
The concept of a CHoCH is instrumental in navigating the complexities of SMC trading. By identifying these crucial market signals, traders may align their strategies to capitalise on market movements efficiently.
FAQs
What Is CHoCH in Trading?
In trading, CHoCH is a technical observation that signifies a change in the trend's character, where the price movement breaks from its established pattern of highs and lows, suggesting a potential reversal or substantial shift in the market's direction.
What Is CHoCH in SMC Trading?
In Smart Money Concept (SMC) trading, a Change of Character (CHoCH) refers to a clear shift in market behaviour that indicates a potential reversal of the prevailing trend. This concept is used by traders to detect early signs of a momentum shift that might lead to significant changes in price direction, enabling strategic adjustments to their trading positions.
What Is a CHoCH in the Market Structure?
A CHoCH in market structure is identified when there is an observable deviation from established price patterns — specifically when new highs or lows contradict the current trend. It signifies that the previous market sentiment is weakening, and a new opposite trend may be starting, prompting traders to reassess their strategies.
How Do You Identify a CHoCH?
Identifying a CHoCH involves monitoring significant swing highs and lows for breaks that are contrary to the existing trend. For instance, in an uptrend, a CHoCH would be indicated by a failure to reach a new high followed by a drop below the recent higher low, suggesting a shift to a bearish outlook.
What Is ChoCH vs BOS in Trading?
While both CHoCH and Break of Structure (BOS) are critical in assessing market dynamics, they serve different purposes. CHoCH indicates a potential trend reversal by highlighting a significant change in the price pattern. In contrast, a BOS indicates a continuation of the current trend by showing the price surpassing previous significant highs or lows, reinforcing the ongoing direction.
This article represents the opinion of the Companies operating under the FXOpen brand only. It is not to be construed as an offer, solicitation, or recommendation with respect to products and services provided by the Companies operating under the FXOpen brand, nor is it to be considered financial advice.

They Had to Take Before They Could GivePrice swept below the previous day’s low (PDL), triggered liquidity, and gave us a clean BOS. This isn’t random, it’s intention.
Now, we wait to see if the market delivers the follow-through into that FVG below.
Your job isn’t to chase price. Your job is to recognize its story.

Mitigation Block in Forex Trading: What It Is and How to Use It?What a Mitigation Block Is, and How You Can Use It When Trading Forex?
Understanding specific market mechanisms like mitigation blocks may enhance strategic decision-making. This article delves into the concept of mitigation blocks, detailing their definition, function, and practical application within forex.
Definition and Function of a Mitigation Block
A mitigation block in forex trading refers to a specific order block on a chart that indicates where previous movements have stalled and reversed, marking it as a potential area for future market turns. This concept within the Smart Money framework is crucial for traders looking to manage their positions by taking advantage of strategic entry and exit points.
The idea behind these areas is rooted in the dynamics of supply and demand within forex. When a currency pair reaches a level where buyers or sellers have previously entered the market in force, causing a reversal, it suggests a potential repeat of such actions when the price returns to the area.
Characteristics and How to Identify a Mitigation Block
Mitigation blocks can be bullish or bearish, each with distinct characteristics:
- Bearish Mitigation Block: This type forms during an uptrend and is identified by a significant peak followed by a decline and a failed attempt to reach or surpass the previous high, creating a lower high. When prices drop below the previous low, the order block above the low becomes mitigation. It may be characterised by an increase in selling volume as the price approaches the level, signalling resistance and a potential downward reversal.
- Bullish Mitigation Block: Conversely, a bullish type is established during a downtrend. It is characterised by a significant trough, followed by a rise to form a higher low, and a failure to drop below the previous low. As the pair moves up, the order block below the high marks mitigation one. This area often shows an increase in buying volume as the price approaches, indicating support and a potential upward reversal.
Mitigation Block vs Breaker Block
Mitigation and breaker blocks are both significant in identifying potential trend reversals in forex trading, but they have distinct characteristics that set them apart. A mitigation block forms after a failure swing, which occurs when the market attempts but fails to surpass a previous peak in an uptrend or a previous trough in a downtrend. The pattern indicates a loss of momentum and a potential reversal as the price fails to sustain its previous direction.
On the other hand, a breaker block is characterised by the formation of a new high or low before the market structure is broken, indicating that liquidity has been taken. This means that although the trend initially looked set to continue, it quickly reverses and breaks structure.
In effect, a breaker appears when the market takes liquidity beyond a swing point before reversing the trend. A mitigation appears when the price doesn’t move beyond the trend’s most recent high or low, instead plotting a lower high or higher low before reversing the trend.
How to Use Mitigation Blocks in Trading
Areas of mitigation in trading can be essential tools for identifying potential trend reversals and entry points. When they align with a trader's analysis that anticipates a reversal at a certain level, it can serve as a robust confirmation for entry.
Traders can effectively utilise these zones by simply placing a limit order within the area once it is considered valid. Validation occurs after a new peak or trough is established following the initial failure swing that forms the mitigation area.
If a liquidity void or fair-value gap is present, the trader may look for such a gap to be filled before their limit order is triggered, potentially offering a tighter entry. Stop losses might be placed beyond the failure swing or the most extreme point.
Furthermore, if a mitigation block is identified on a higher timeframe, traders can refine their entry by switching to a lower timeframe. This approach allows for a tighter entry point and potentially better risk management, as it offers more granular insight into the momentum around the area.
Common Mistakes and Limitations
While these blocks are valuable for forex trading, they come with potential pitfalls and limitations that traders should know.
- Overreliance: Relying solely on mitigation blocks without corroborating with other trading indicators can lead to misjudged entries and exits.
- Ignoring Context: Using these zones without considering the broader market conditions may result in trading against a prevailing strong trend.
- Misinterpretation: Incorrect identification can lead to erroneous trading decisions, especially for less experienced traders.
- False Signals: Mitigation blocks can sometimes appear to signal a reversal but instead lead to a continuation of the trend, trapping traders in unfavourable positions.
The Bottom Line
Understanding mitigation blocks offers traders a strategic edge in navigating the forex market. They can be vital for recognising potential price reversals and improving trading outcomes.
FAQs
What Is a Mitigation Block?
A mitigation block in forex trading is an order block that identifies potential reversal points. It signals where a currency pair has previously stalled, indicating strong buying or selling pressure, suggesting a potential for similar reactions in future encounters with these levels.
How Do You Identify a Mitigation Block?
Mitigation blocks are identified by analysing charts for areas where previous highs or lows were not surpassed, leading to a reversal. Traders look for a sequence of movements, including a swing high or low followed by a retracement that fails to exceed the previous swing.
What Is the Difference Between a Breaker Block and a Mitigation Block?
While both indicate potential reversals, a breaker block forms when the price makes a new high or low before reversing, suggesting a temporary continuation of the trend. In contrast, a mitigation block forms without creating a new extreme, indicating a direct loss of momentum and an immediate potential for reversal.
This article represents the opinion of the Companies operating under the FXOpen brand only. It is not to be construed as an offer, solicitation, or recommendation with respect to products and services provided by the Companies operating under the FXOpen brand, nor is it to be considered financial advice.

Did You Catch the Sweep & Shift on GBPAUD?Sometimes the market whispers its intentions before making a move — and this was one of those moments. This GBPAUD setup was built on the core principles of Candle Range Theory (CRT):
Sweep of the Previous Day’s Low (PDL)
Break of Structure (BOS) confirming a shift in momentum
Entry retracement into the Fair Value Gap (FVG)
What stood out here was the precision of the sweep and how price reacted cleanly after BOS, tapping into the FVG zone and immediately pushing toward the high-probability target.
No indicators, no noise, just clean market structure and smart money behavior.
The temptation to enter early was real, but the edge came from waiting for price to validate itself. A textbook example of how patience and plan adherence outweigh prediction .

Did Gold Just Sweep the Low for a Reversal?After a clean sweep of the Previous Day’s Low (PDL) on XAUUSD, price reacted sharply, grabbing liquidity and signaling a possible shift in order flow. This forms the first pillar of my CRT model (Candle Range Theory) : Sweep, Break, Retest .
Following the sweep, we observed a strong Break of Structure (BOS) , indicating bullish intent. We will then wait for price to retrace back to a FVG at a discount, and then execute the trade.
The stop loss was logically placed just beneath the PDL sweep and FVG zone, protecting against deeper liquidity hunts. Take profit targets the next high where resting buy-side liquidity is likely to be engineered.
This setup checks all the boxes:
Sweep of PDL ✅
BOS confirming shift ✅
FVG retest for refined entry ✅
Solid RR and clean narrative ✅
This is a great example of how patience and a structured approach can create high-probability setups.

BTC Short Setup! Break of Structure + OB + 70.5% Premium TapBitcoin (BTCUSD) | 30-Min Chart – Clean Bearish SMC Setup
BTC just delivered a textbook Break of Structure (BoS) to the downside, and price is now retracing into a high-confluence premium zone packed with Smart Money signals: a bearish Order Block (OB), Fair Value Gap (FVG) alignment, and multiple Fibonacci retracement levels. This setup is precision-crafted for patient traders who wait for institutional footprints before striking.
🔍 Trade Breakdown:
🔺 Market Structure Shift:
Price broke decisively below the internal range, forming a clear BoS (Break of Structure). The lower low confirms bearish intent. Any retracement into premium is now a potential short opportunity.
📉 Bearish Order Block:
Marked just above the 61.8% Fib
Originated the strong bearish impulse that created the BoS
This is where Smart Money likely entered the move — we look to join them
🟣 Fair Value Gap (Imbalance Zone):
Gap within the OB
Price is likely to rebalance this inefficiency before continuing the bearish trend
📐 Fibonacci Levels (Swing High to Low):
50%: 103,617 (current price)
61.8%: 103,963
70.5%: 104,800
79%: 105,200
This premium zone (104,400–104,951) overlaps with the OB and FVG — massive confluence.
🧠 Smart Money Playbook:
🔹 Entry Zone:
From 103,963 to 104,951 — OB + FVG + 61.8–70.5% retrace = sniper entry window
🔻 Stop Loss:
Above 105,000 (protect against OB invalidation and final liquidity sweep)
📉 Take Profit:
100,464 — aligned with the low of the full fib swing and prior liquidity pocket
⚖ RRR:
Over 1:4 — clean sniper risk-reward with clear structure validation
📉 Bearish Continuation Expectation:
Price enters OB → taps imbalance → reacts at 70.5% level
Expected move: Sell-off toward the discount zone + full swing completion
Look left — no major support zones until the 100,400–100,600 level, making it a liquidity magnet and realistic TP zone.
💬 Ninja Wisdom:
Structure + Liquidity = Foundation
OB + FVG + Fib = Precision Tools
Trade where Smart Money enters — not where retail hopes. 🥷💸
📍 Save this chart – this setup could play out fast
🔁 Share your thoughts: will BTC respect the OB or break above?
👣 Follow @ChartNinjas88 for daily sniper-level BTC/ETH/Gold trades

Is This the Optimal Entry After a PDL Sweep and FVG Retest?A clean structural development on CHFJPY (1H TF)
After sweeping the Previous Day’s Low (PDL), price created a bullish Break of Structure (BOS) to the upside , shifting short-term sentiment. This BOS was followed by a precise retest into a Fair Value Gap (FVG), suggesting possible continuation as liquidity shifts from weak hands to strong.
🧠 Educational Notes :
CRT Sweep Logic: Market often sweeps the previous day's high or low before making its true move. In this case, a clean PDL sweep was followed by a strong bullish reaction.
Break of Structure (BOS): Confirmed bullish intent after the sweep, validating a shift in order flow.
FVG Retest: Institutional pricing inefficiency filled — a classic SMC continuation behavior.
Entry Thesis: Based on reaction from FVG + BOS confirmation, with invalidation below the swept low and TP near the previous swing high.
This setup is not financial advice, but a clear visual case study for traders applying SMC + CRT logic.

XAUUSD Mind Mapping Breakout – MMC Strategy + Target📍 Overview:
In today's Gold (XAUUSD) 30-minute chart, we’re witnessing a flawless execution of MMC (Mind Mapping Concept) strategy combined with SMC (Smart Money Concept) principles. This is a perfect case study for traders who want to understand how psychology, curve-based support, and structural mapping come together to create a high-probability bullish setup.
🔍 Full Breakdown of the Chart
1. Initial Market Behavior: Liquidity Grab & Structural Shift
The market begins with a bearish drop, clearing liquidity below the previous consolidation.
This is followed by a QFL zone (Quick Flip Level), which acts as a smart money accumulation point.
Shortly after, price rebounds from the SR Interchange zone, where resistance transforms into support—a key MMC signal for upcoming structural shift.
🧠 Key Concept: Smart money often grabs liquidity before making a move. These zones are critical for identifying market reversals.
2. Black Mind Curve Support – Dynamic Trend Logic
The Black Mind Curve is a dynamic support curve, not a traditional trendline. It represents how the market naturally flows, mapping out the collective psychology of buyers.
Price respects this curve multiple times, forming higher lows—each one stronger than the last.
This is where patient MMC traders build their positions, aligning entries with psychological market rhythm.
🔥 Why It Matters: While static lines may break under pressure, dynamic curves breathe with the market, providing more accurate structure support.
3. Structure Mapping – Tracking Market Intentions
Structure Mapping is one of the core MMC techniques—tracking the "story" price action is telling through:
BOS (Break of Structure)
QFL traps
SR interchanges
Internal higher-highs and higher-lows
The Major BOS line indicates a key shift in market direction from bearish to bullish, a confirmation point for trend-followers.
📌 Lesson: Once BOS is confirmed, the probability favors continuation rather than reversal.
4. Ellipse Trap – The Psychological Kill Zone
This blue-highlighted ellipse zone marks where retail traders often get manipulated—buying false breakouts or shorting fake reversals.
Price consolidates inside this ellipse before launching upwards.
MMC refers to this phase as the “After Effect”—where true momentum begins after psychological traps are triggered.
🎯 Insight: Never enter a trade inside the ellipse unless you clearly understand market context—it’s where the market “confuses the masses.”
5. VIP Zone – The High-Probability Entry Window
The VIP zone is a small but powerful price area where risk is minimized, and reward is maximized.
It aligns with the curve, inner structure support, and BOS retest. This is your ideal entry zone, especially for those using curve-based confirmations.
🔑 Pro Tip: This is the sniper entry for MMC traders. Small SL, big reward. Enter after internal confirmation like pin bars or bullish engulfing.
6. Target Zone & Next Reversal Area
After the explosive breakout, price hits the projected target marked clearly on the chart.
The move aligns with prior imbalance zones and market inefficiencies, filling previous gaps.
The market is now approaching the Next Reversal Zone, highlighted in blue—this is where MMC traders start watching for signs of exhaustion.
📉 What to Watch:
Slowing bullish candles
Bearish divergence on RSI or momentum indicators
Sudden spikes in volume with no further upside
📚 Key MMC Concepts in This Chart:
Concept Description
QFL Zone Quick Flip Level; a liquidity trap zone before reversals.
Black Mind Curve Curved support line reflecting psychological market flow.
Structure Mapping Tracking HH/HL and BOS to define clear market bias.
Ellipse Trap Market maker zone used to trap and reverse retail traders.
VIP Entry Zone The safest and most efficient entry after structure confirmation.
Next Reversal Zone Anticipated resistance based on confluence of previous S/R and imbalance.
🧠 Strategic Conclusion:
This analysis perfectly illustrates how combining SMC with MMC enhances your trading edge. It’s not about predicting price, but understanding structure, reading psychology, and entering at high-probability points.
Whether you're a scalper, day trader, or swing trader, using curve-based mapping like the Black Mind Curve gives you a fluid understanding of price, beyond rigid lines and lagging indicators.
💡 Final Thoughts:
📈 Follow the Story, Not the Noise.
📉 Enter Where It Makes Sense, Exit Where Others Get Emotional.
⚡ Use MMC to Read What the Market is Really Saying.
✅ Action Plan:
🔍 Monitor price in the Next Reversal Zone.
📉 Look for exhaustion signals before considering shorts.
🟢 If bullish continuation holds above target zone, next micro-level target would be derived from 1.618 Fibonacci extension.
