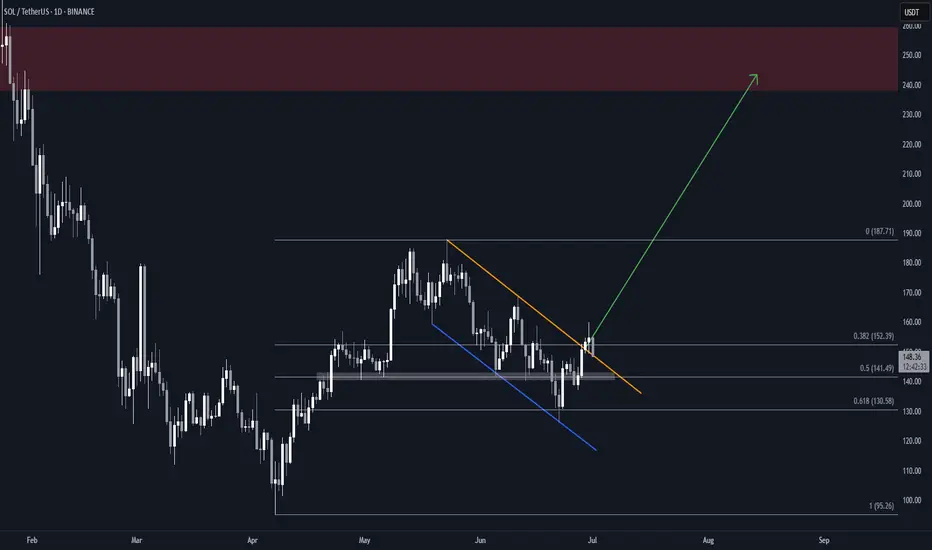
Solana (SOL) Flag & Pole Breakout (1D)BINANCE:SOLUSDT broke out of a textbook falling wedge two days ago, and is now retesting the former resistance as support.
Key Technicals
• Falling channel with clean structure and multiple touches
• Resistance trendline broken
• Price now retesting the breakout zone (~$148)
• Overhead supply zone at $238–$260
• Measured Target: $240, within supply
Why This Setup Matters
• Clear breakout followed by a retest, which can often precede the next leg up if support holds
• Falling channel retracement aligns with 0.618 Fib, a common reversal area
What to Watch
• Daily close above the previous resistance trendline
• Push above the local $160 high for full confirmation
Breakout
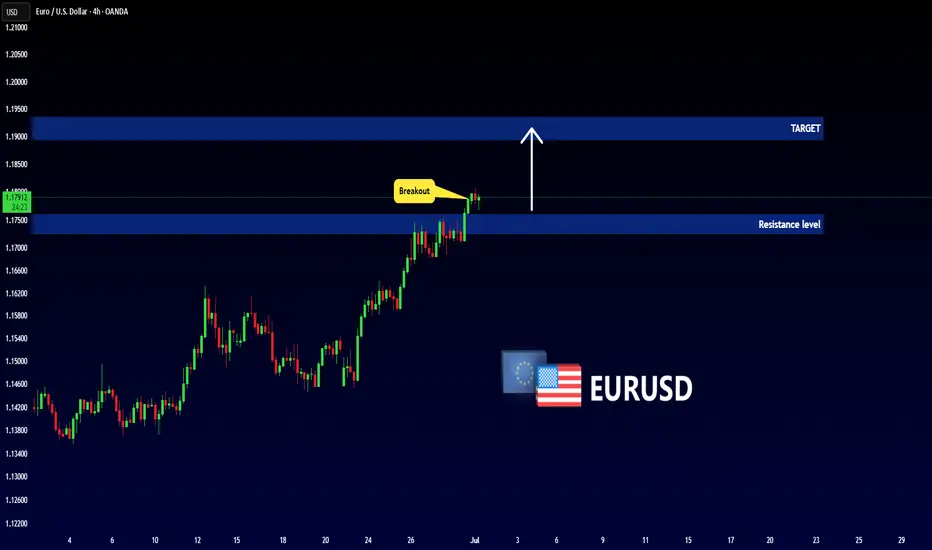
EURUSD - Important Breakout !Hello Traders !
The EURUSD price broke the resistance level (1.17255 - 1.17602).
This key level becomes new support!
So, I expect a bullish move🚀
________________
TARGET: 1.18950🎯
HAL: fake breakdown and a possible bullish move.Stock: Hindustan Aeronautics Ltd NSE:HAL
• Timeframe: 1-day candles (each candle represents one day of trading)
1. Consolidation Zone: A grey rectangular box highlights an area of "consolidation" starting from around May 14th. This means the stock price has been trading sideways within a relatively narrow range, not showing a clear uptrend or downtrend.
2. Fake Breakdown: An arrow points to a price dip below the lower boundary of the consolidation zone. The annotation calls this a "fake breakdown." This implies that the price temporarily moved below the support level, but then quickly bounced back up.
3. Potential Trade Setup: The chart suggests a potential long (buy) trade based on the fake breakdown and the subsequent recovery.
• Entry Point: Around 4,897.55 (labeled "ENTRY" on the chart) which is the price at which the stock could be bought.
• Stop Loss: Around 4,733.75 (likely intended to be the "4733.60")
This is the level below which the trader would exit the position to limit potential losses if the price moves against them.
• Targets: The chart identifies three potential profit targets:
* Target 1: 5,087.85
* Target 2: 5,305.15
* Target 3: 5,497.80

NZD_JPY WAIT FOR BREAKOUT|LONG|
✅NZD_JPY is trading in an
Uptrend and the pair has formed
A bullish triangle pattern
And we are bullish biased
So IF we see a bullish breakout
It will be our signal that
A bullish continuation is
Likely and we will be
Able to enter a long trade
LONG🚀
✅Like and subscribe to never miss a new idea!✅
Disclosure: I am part of Trade Nation's Influencer program and receive a monthly fee for using their TradingView charts in my analysis.

CAD_CHF WILL KEEP FALLING|SHORT|
✅CAD_CHF broke the key structure level of 0.5840
While trading in a strong downtrend
Which makes me bearish
And I think that after the retest of the broken level is complete
A rebound and bearish continuation will follow
SHORT🔥
✅Like and subscribe to never miss a new idea!✅
Disclosure: I am part of Trade Nation's Influencer program and receive a monthly fee for using their TradingView charts in my analysis.


GBP-CHF Bearish Breakout! Sell!
Hello,Traders!
GBP-CHF formed a H&S
Pattern and now we are
Seeing a strong bearish
Breakout of the neckline
Key level around 1.0933
Area and as the breakout
Is confirmed we will be
Expecting a further bearish
Move down towards the
Target below around 1.0867
Sell!
Comment and subscribe to help us grow!
Check out other forecasts below too!
Disclosure: I am part of Trade Nation's Influencer program and receive a monthly fee for using their TradingView charts in my analysis.

Euro will make correction to support line of channelHello traders, I want share with you my opinion about Euro. In this chart, we can see how the price entered to triangle, where it at once bounced from the support line and rose to the 1.1100 support level, which coincided with the buyer zone. Soon, price broke this level, after a small correction, and continued to move up to the 1.1575 current support level, which coincided with the support area. This area also coincided with the resistance line of the triangle, and the Euro rebounded from this line and started to decline. In a short time, it declined to the buyer zone, where it turned around and started to move up. Soon, Euro exited from triangle and continued to rise inside an upward channel, where it made a correction first and then continued to grow. Later, EUR rose to 1.1575 current support level, one more time and even almost broke it, but failed and corrected. But soon, it finally broke this level and rose to the resistance line of the channel, where at the moment it continues to trade near. In my mind, Euro will rebound from this line and go to the correction until to support line of the channel, breaking the support level. For this case, my TP is located near this line - at the 1.1490 points. Please share this idea with your friends and click Boost 🚀
Disclaimer: As part of ThinkMarkets’ Influencer Program, I am sponsored to share and publish their charts in my analysis.

WLDUSDT – Bullish Setup Unfolding!Hey Traders — if you're into high-conviction setups with real momentum, this one’s for you.
WLD is breaking out from a well-defined falling wedge pattern on the 4H chart — a classic bullish structure. Currently retesting the breakout zone while holding the green demand box like a champ. 📈
💥 Entry Zone:
$0.87 – $0.91 (accumulate inside the green box)
🎯 Targets:
• $1.08
• $1.28
• $1.45
• $1.58
🛑 Stop Loss:
$0.81 (below the wedge + demand zone)
Looks poised for a strong move. As always, use proper risk management and watch for volume confirmation.
Let’s see how this plays out — bullish structure, solid risk-reward!

DXY Swing Short! Sell!
Hello,Traders!
DXY keeps falling down
And the index broke the
Key wide horizontal level
Around 97.800 which is now
A resistance and the breakout
Is confirmed so we are very
Bearish biased and we will
Be expecting a bearish
Continuation on Monday
Sell!
Comment and subscribe to help us grow!
Check out other forecasts below too!
Disclosure: I am part of Trade Nation's Influencer program and receive a monthly fee for using their TradingView charts in my analysis.

RSI Flashes Warning on EURUSD: Critical Level Under Watch!Good morning traders,
If the EURUSD pair breaks below the 1.16729 level due to an RSI divergence, the next potential target could be around 1.16093.
Keep in mind that a break below 1.16729 may also signal a potential trend reversal.
I've marked the pivot points for you on the chart for better clarity.
Additionally, it's crucial to keep an eye on current economic data and news releases as part of your fundamental analysis.
I meticulously prepare these analyses for you, and I sincerely appreciate your support through likes. Every like from you is my biggest motivation to continue sharing my analyses.
I’m truly grateful for each of you—love to all my followers💙💙💙

CHF-JPY Local Long! Buy!
Hello,Traders!
CHF-JPY is trading in a strong
Uptrend and the pair made a
Bullish breakout from the bullish
Triangle pattern and is now seems
To be consolidating above the
Support cluster around 180.740
So we are bullish biased and
We will be expecting a further
Bullish move up on Monday
Buy!
Comment and subscribe to help us grow!
Check out other forecasts below too!
Disclosure: I am part of Trade Nation's Influencer program and receive a monthly fee for using their TradingView charts in my analysis.

USD-CHF Will Fall! Sell!
Hello,Traders!
USD-CHF keeps falling down
And the pair broke the key
Horizontal level of 0.8090
Decisively so we are bearish
Biased and we will be expecting
A further move down next week
Sell!
Comment and subscribe to help us grow!
Check out other forecasts below too!
Disclosure: I am part of Trade Nation's Influencer program and receive a monthly fee for using their TradingView charts in my analysis.

DXY STRONG DOWNTREND CONTINUES|SHORT|
✅DXY is going down currently
In a strong downtrend and the index
Broke the key structure level of 98.000
Which is now a resistance,
And after the pullback
And retest, I think the price
Will go further down next week
SHORT🔥
✅Like and subscribe to never miss a new idea!✅
Disclosure: I am part of Trade Nation's Influencer program and receive a monthly fee for using their TradingView charts in my analysis.

Gold may bounce up from support line of channel to 3330 pointsHello traders, I want share with you my opinion about Gold. Previously, the price broke out of a symmetrical triangle and moved confidently toward the seller zone. However, it failed to consolidate there and formed a downward channel, where price action has remained since. The movement inside this channel has been consistent, respecting both the resistance and support lines. After reaching the lower boundary, the price bounced up and approached the resistance area (3290 - 3300), which now acts as a key short-term obstacle. This zone was tested multiple times and served as support earlier, making it a strong technical level. Currently, the price is trading just below this zone and forming a base for the next move. I expect a possible retest of the support line of the downward channel, which may provide the impulse needed for a new upward move. In my opinion, the price will rebound from the bottom of the channel and start to grow toward the current resistance level at 3300. If this level is broken and confirmed via a retest, I expect continued movement toward the channel’s upper resistance line. That’s why I set my TP 1 at 3330 points, right near the resistance line of the channel. Please share this idea with your friends and click Boost 🚀
Disclaimer: As part of ThinkMarkets’ Influencer Program, I am sponsored to share and publish their charts in my analysis.

GOLD 4H: not all that glitters is bullish...The 4H chart shows a clean descending triangle breakdown. Price failed to reclaim the trendline and was rejected under both MA50 and MA200. The bounce into 3325–3340 was absorbed — classic liquidity sweep and fade. Volume confirms bearish control.
Technically, the breakdown below 3320 opens the way toward $3293 (1.0 Fibo), $3250 (1.272 extension), and final target at $3195 (1.618), where buyers might step in. RSI supports the continuation without signs of reversal. Structure broke — and the market is telling us where it's heading.
Tactical plan:
— Entry at market or on a retest of $3325–3335
— Targets: $3293 → $3250 → $3195
— Stop: above $3340 (above MA50 and broken trendline)
When gold looks shiny, smart traders look deeper. This breakout isn’t golden — it’s a trap for late bulls.

You like expulsive moves?Price is squeezing into the falling wedge against the 10.2 - 10.5 support zone. I think is going to break out soon. SL Triggers if a daily candles CLOSES below the support zone as shown.

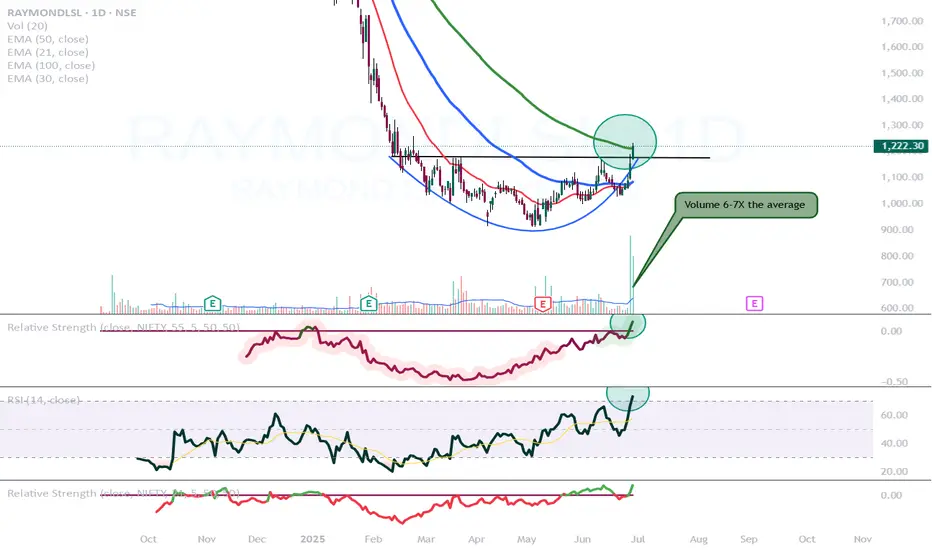
Raymond Lifestyle is looking good!NSE:RAYMONDLSL
- After a 5 month long consolidation now breaking out.
- This is looking like a stage 2 breakout.
- Relative strength turned positive.
- RSI is above 70 indicating very high momentum
- Volume is also very good on the break out candle. Also we can observe that volume is higher on the green candles and lower on the red ones.
- Today it closed above its 100 day exponential moving average as well.
EUR/JPY Analysis – Flag Breakout Signals Further UpsideHello Traders,
It's been a while. I trust you are good.
Kindly find below my analysis of EURJPY currency pair.
Overview:
EUR/JPY has been consolidating within a bullish flag pattern, characterized by lower highs and lower lows over the past few trading sessions. Price action has now broken above the flag’s resistance, indicating a possible continuation of the broader bullish trend.
Idea:
The breakout above the bullish flag suggests that bulls are regaining control. Price is currently hovering around 169.370, having just cleared the wedge’s resistance line.
Key levels to monitor:
1. Support Zone: Around 169.200–169.300
2. Resistance Level: 169.699
Trade setup:
Entry: On a successful breakout or break and retest of 169.200–169.300.
Stop Loss: Below 168.816 (beneath the flag's support and recent swing low).
Targets: TP1: 169.699, TP2: 170.000–170.200
Conclusion:
EUR/JPY has broken out of a bullish flag pattern, signaling momentum shift in favor of buyers. If price sustains above the breakout zone or clears 169.699 resistance, we may see an extended rally toward the 170.000 mark. Trade with caution.
Cheers and happy trading.

USD_CHF BEARISH BREAKOUT|SHORT|
✅USD_CHF broke the key structure level of 0.8050
While trading in a strong downtrend
Which makes me bearish
And I think that after the retest of the broken level is complete
A bearish continuation will follow
SHORT🔥
✅Like and subscribe to never miss a new idea!✅
Disclosure: I am part of Trade Nation's Influencer program and receive a monthly fee for using their TradingView charts in my analysis.

DOW JONES Will Keep Growing! Buy!
Hello,Traders!
US30 is trading in an
Uptrend and the index broke
The key horizontal level
Around 43,200 and the
Breakout is confirmed so
We are bullish biased
And we will be expecting a
Further bullish move up
Buy!
Comment and subscribe to help us grow!
Check out other forecasts below too!
Disclosure: I am part of Trade Nation's Influencer program and receive a monthly fee for using their TradingView charts in my analysis.

XPTUSD 1W:While Everyone Watches Gold, Platinum Quietly Wakes UpGold gets the headlines — but platinum just broke two years of silence with a clean, high-volume breakout from a symmetrical triangle on the weekly chart. And this isn’t noise — this is the structural shift traders wait for.
Price has been coiled inside a compressing wedge since early 2022. Equal highs. Equal lows. Stop hunts both ways. The classic “shake out before take off.” Now? The breakout is in. And the weekly candle closed above resistance with volume confirmation. Oh, and while we're at it — the 50MA just crossed above the 200MA, signaling a long-term trend reversal.
Target? Measure the triangle height: ~398 points. That projects a breakout target of 1440 USD, which aligns perfectly with previous institutional rejection zones.
But this isn’t just about the chart.
🔹 South Africa, the top global supplier, is struggling with energy and production cuts;
🔹 The Fed is pausing rate hikes — the dollar weakens, metals rally;
🔹 Demand from hydrogen tech, clean energy, and industrial catalysts is on the rise.
Translation? Smart money has been accumulating. The move from 965–1070 was just the ignition. The drive hasn’t started yet.
So while everyone fights over gold highs, platinum sits at the base of a move no one's prepared for — except those who know how accumulation ends.
🧭 Key support: 965–985
📍 Resistance zone: 1150–1180
🎯 Measured target: 1440+

US100 BULLISH BREAKOUT|LONG|
✅US100 is going up
Now and the index made a bullish
Breakout of the key horizontal
Level of 22,222 and the breakout
Is confirmed so we are bullish
Biased and we will be expecting
A further bullish move up
LONG🚀
✅Like and subscribe to never miss a new idea!✅
Disclosure: I am part of Trade Nation's Influencer program and receive a monthly fee for using their TradingView charts in my analysis.
