Full trade plan with exact prices laid out ahead of time!After shortsellers forcefully pushed NASDAQ:MODV down from mid $2's I said this will most likely result into powerful squeeze.
I said buy at the dip $2.31 exactly, waited to get filled, double dip to $2.31 happened to get a full position and from there straight up to mid $3's, took profits in 2 parts and sent out messages live as it was happening so everyone that followed along knew what to do.
Solid +30% gain in minutes, taking safest piece of the 200% move the stock made before focus shifted elsewhere.
That's how it's done, in and out at highly predictable levels, then moving on to the next stock because NASDAQ:NIVF NASDAQ:EYEN NASDAQ:REVB are already up and hot this morning, not marrying it and holding & hoping forever.
Breakout

DEXE/USDT: FALLING WEDGE BREAKOUT!!DEXE Breakout Alert – 80% Move Loading?
Hey Traders! If you're into high-conviction plays and real alpha — hit that like and tap Follow for trade setups that actually deliver.
DEXE has broken out of a falling wedge pattern on the daily timeframe and has successfully retested the breakout level. The structure looks strong, and momentum is starting to build.
Entry Zone: $13.4 – $14.4
Targets: $16.1 / $18.2 / $21.2 / $24.4
Stop-loss: $12.60
Leverage: Use low leverage (Max 5x)
This could be the beginning of a powerful upward move.
Keep this setup on your radar and manage risk accordingly.
Let me know your thoughts or if you're riding this one too.

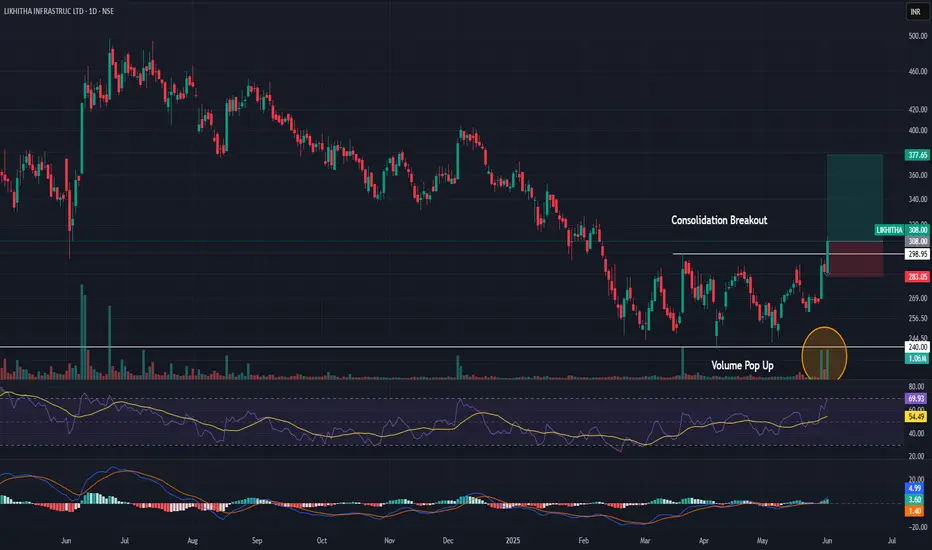
Momentum Trade in Likhitha Infra1. Positive Divergence on RSI
2. Good Volume
3. Consolidation Breakout
4. RSI near 70
5. MACD signal turning green
Gold breakout? My opinionGold in short time frame was in bearish trend which it broke out of, however price action is still bearish. Generally trendlines are powerful enough to change price section. Turning points are marked on the chart, I will look for trades in these areas.

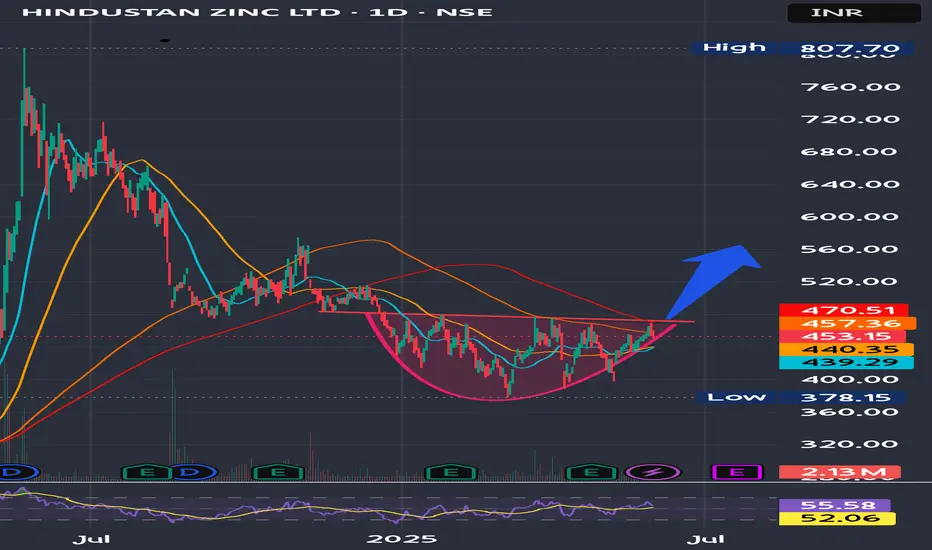
Hindustan Zinc Ltd at near breakout Hindustan Zinc Ltd. (Hindzinc) is one of the world's largest integrated producers of zinc, lead, and silver.
It is near a crucial resistance level and making higher lows indicating a breakout upwards soon.
Trading Levels-
Tgt Price-564
SL-448.5
GOLD Massive Bullish Breakout! Buy!
Hello,Traders!
GOLD is trading in a strong
Uptrend and the price just
Made a massive bullish
Breakout of the falling
Resistance line and the
Breakout is confirmed
So after a potential pullback
We will be expecting a
Further bullish continuation
Buy!
Comment and subscribe to help us grow!
Check out other forecasts below too!
Disclosure: I am part of Trade Nation's Influencer program and receive a monthly fee for using their TradingView charts in my analysis.

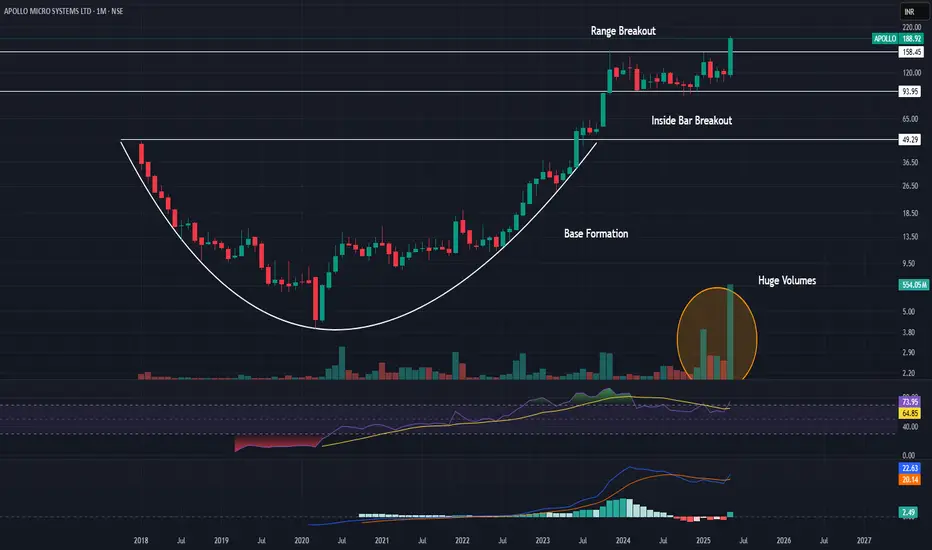
Flag Breakout in Apollo Micro Systems1. Inside Bar Breakout
2. Good Volume
3. Consolidation Breakout
4. RSI above 70
5. MACD signal turning green
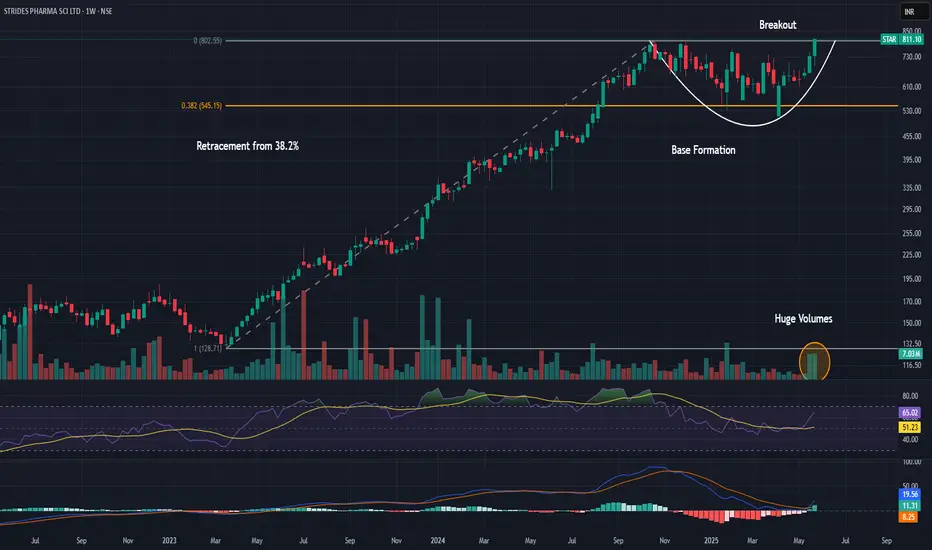
Round Bottom Breakout in Strides Pharma1. Reversal from 32.8% retracement (strong up-move)
2. Good Volume
3. Round Bottom Breakout
4. RSI above 50
5. MACD signal turning green
$1 to $7.18 continued to 600% vertical $BMGLIt just didn't want to stop ripping higher, congrats if you got in if not sooner then at least when I posted a chart in $3's there was still time to catch a doubler up into $7's NASDAQ:BMGL

GBPCAD Rejection Signals Possible DropThe GBPCAD pair is currently displaying a textbook technical structure within a long-term ascending parallel channel that has been in place since late 2022. Price action has consistently respected both the upper resistance and lower support boundaries of this channel, making it a reliable framework for anticipating future movement. Recently, the pair attempted to break above the upper boundary but was met with strong resistance around the 1.8680-1.8700 level, forming a clear rejection that aligns with multiple previous turning points (marked by red arrows). This rejection coincides with a horizontal resistance level that has been tested several times, suggesting a significant barrier for buyers.
Following this rejection, the price is now beginning to show signs of weakness and a potential bearish shift. If the market breaks below the minor rising trendline and the horizontal support zone around 1.8145, it could confirm a near-term trend reversal. In that scenario, the next logical support lies near the midline of the channel around 1.8000, a level that has previously acted as dynamic support. A deeper correction could push the pair toward the lower boundary of the channel in the 1.7700-1.7800 region, where long-term buyers may re-enter.
This analysis is based on the principles of trend channel theory and price action behavior at key support and resistance zones. The repeated failure to break above channel resistance, combined with the formation of a potential lower high, supports the idea of a corrective move. Traders considering a short position may look to enter around 1.8650-1.8680 with confirmation, targeting 1.8145 as the first support, followed by 1.8000 and possibly 1.7700. A daily close above 1.8720 would invalidate the bearish outlook and indicate a potential breakout scenario.
As always, proper risk management and confirmation through price structure or candlestick patterns are essential before initiating any trade based on this setup.

ETHEREUM Wedge Breakout! Sell!
Hello,Traders!
ETHEREUM was trading in an
Uptrend but then the coin
Formed a bearish wedge pattern
And we are now seeing a bearish
Breakout so we are locally
Bearish biased and we will be
Expecting a long awaited
Bearish correction
Sell!
Comment and subscribe to help us grow!
Check out other forecasts below too!
Disclosure: I am part of Trade Nation's Influencer program and receive a monthly fee for using their TradingView charts in my analysis.

USDCAD Makes Retest At 200 EMA After Bull Trap BreakoutOANDA:USDCAD here on the 1Hr Chart has printed an Ascending Channel and Bears have made a Breakout!
Price currently looks to be on its way to retesting the Breakout of the Channel with the 200 EMA and Upper Bollinger Bands sitting at the Rising Support adding some heavy Bearish Pressure.
Fundamentally, BOC will be releasing GDP m/m ( Gross Domestic Product ) numbers tomorrow morning at 0730 AM CST with analysts forecasting a .3% Increase at .1% with Previous being -0.2%.

Euro can reach resistance line of pennant and then dropHello traders, I want share with you my opinion about Euro. The price of the Euro had been gradually declining, forming a series of lower highs and finding support around the 1.1070 - 1.1025 buyer zone. This pullback created the groundwork for a new structure to form as volatility narrowed and momentum shifted. After reaching a local bottom, the market rebounded and began constructing an upward pennant, a classic consolidation pattern that often precedes continuation or reversal, depending on breakout direction. Within this pennant, price respected both trendlines, each approach to the upper resistance was followed by a rejection, and each touch of the support line triggered a bounce. Now, the Euro is moving closer to the resistance line of the pennant once again. Given the overall structure, proximity to the 1.1415 resistance level, and prior reactions from the seller zone, I think the Euro can reach the top boundary and then continue to decline, potentially breaking below the pattern. That’s why I set my TP at 1.1150 points, targeting a move toward the support level and exit from the pennant. Please share this idea with your friends and click Boost 🚀
Disclaimer: As part of ThinkMarkets’ Influencer Program, I am sponsored to share and publish their charts in my analysis.

AUD_NZD BEARISH BREAKOUT|SHORT|
✅AUD_NZD made a bearish
Breakout of the key horizontal
Level of 1.0783 and the breakout
Is confirmed so we are locally
Bearish biased and we will be
Expecting a further bearish
Move down
SHORT🔥
✅Like and subscribe to never miss a new idea!✅
Disclosure: I am part of Trade Nation's Influencer program and receive a monthly fee for using their TradingView charts in my analysis.

CAD-CHF Bearish Wedge! Sell!
Hello,Traders!
CAD-CHF formed a bearish
Wedge pattern and now we
Are seeing a powerful breakout
Which is confirmed so we are
Locally bearish biased and
We will be expecting a
Further bearish move down
Sell!
Comment and subscribe to help us grow!
Check out other forecasts below too!
Disclosure: I am part of Trade Nation's Influencer program and receive a monthly fee for using their TradingView charts in my analysis.

USOIL - Bullish Double BottomHello Traders !
The USOIL price formed a double bottom pattern.
Currently, The neckline is broken !
So, I expect a bullish move🚀
_______________
TARGET: 63.49🎯

SIGN/USDT – Bullish Breakout Alert!🚀 SIGN Breakout Alert – 80% Potential Incoming?! 👀🔥
Hey Traders! If you're all about high-conviction plays and real alpha, smash that 👍 and tap Follow for more setups that actually deliver! 💹💯
SIGN has just broken out from a symmetrical triangle after consolidating tightly for weeks. The breakout is supported by strong volume and a solid bounce from the base of the structure.
Entry: $0.082 - $0.085 (post-breakout zone)
Targets:
• $0.095
• $0.112
• $0.134
• $0.159
Stop-loss: Below $0.076
Risk-Reward: Over 6:1 — Excellent setup for trend traders.
This move could mark the beginning of a strong upside wave. Keep it on your radar and manage your risk accordingly!
Let me know your thoughts or if you're riding this one too!

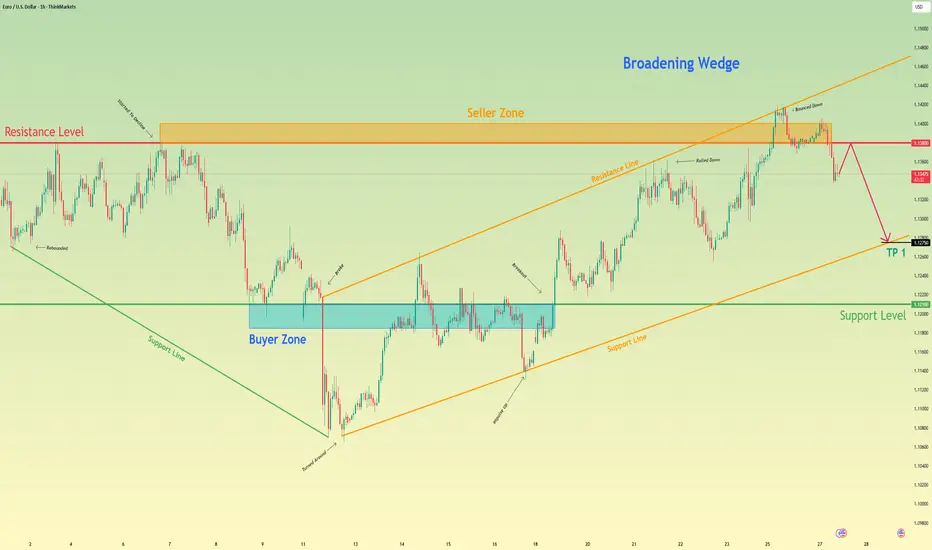
Euro may grow to resistance level and then drop to 1.1275 pointsHello traders, I want share with you my opinion about Euro. After forming a strong upward move from the buyer zone (1.11850–1.1210), the price rose sharply, broke the mid-range resistance, and entered the seller zone between 1.1380 and 1.1400. Once it reached the upper boundary of the broadening wedge, the price bounced down from resistance at 1.1380. Now the price is trading inside a broadening wedge, showing signs of a potential reversal. After failing to hold above resistance, the Euro started to decline from the seller zone, confirming selling pressure. The current movement points to a correction within the wedge structure. I expect the Euro will continue falling toward 1.1275, my TP 1, where the support line of the wedge coincides with the upper boundary of the previous buyer zone. This zone has already shown strong reactions before and could act as a short-term reversal area. Given the recent rejection from resistance, the broadening wedge formation, and return from the seller zone, I remain bearish and anticipate further decline. Please share this idea with your friends and click Boost 🚀
Disclaimer: As part of ThinkMarkets’ Influencer Program, I am sponsored to share and publish their charts in my analysis.
CADJPY - NEW BREAKOUT !Hello Traders !
The CADJPY price formed a descending channel.
Currently, The resistance line is broken !
So, I expect a bullish move🚀
_______________
TARGET: 105.390🎯

AAPL summer breakoutFriday 5/23, Tues 5/27, Wed 5/28 - bullish
Targets up to 225-230 maybe... not all this week (summer)
*looks like AAPL has already moved toward the 207-208 level overnight.
*hope we are blessed with a pullback to buy back up. 202-203
*NVDA earnings propping market = good
*Catalyst conversations mounting:
finance.yahoo.com

GOLD Bearish Breakout! Sell!
Hello,Traders!
GOLD made a bearish
Breakout of the key horizontal
Level of 3285$ which also
Seems to have been a neckline
Of the small H&S pattern so
We are locally bearish biased
And we will be expecting a
Further bearish move down
Sell!
Comment and subscribe to help us grow!
Check out other forecasts below too!
Disclosure: I am part of Trade Nation's Influencer program and receive a monthly fee for using their TradingView charts in my analysis.

ASTRAMICRO READY FOR BLAST!Astra Micro is in a strong uptrend on the daily chart, steadily forming higher highs and higher lows. On the lower time frame, the stock had gone through a phase of consolidation but has now broken out of it with strong volume support. The current setup presents a limited downside risk of around 5 per cent, while offering a potential upside of 12–15 per cent.

INOX WIND BREAKOUT Target Levels
- Short-Term Target: 204–211.
- Medium-Term Target: 261–343
Stop-Loss Levels
- Short-Term Stop Loss: 184.2 near immediate support
- Medium-Term Stop Loss: 157.1–153.8 strong support zone
- Long-Term Stop Loss: 170.6 major trend support
