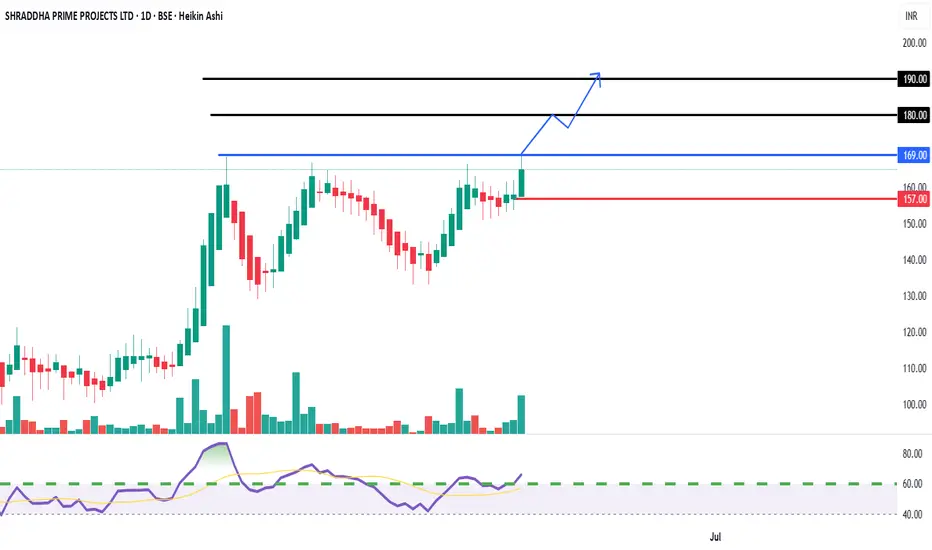
On the Cusp of a Breakout - Short-Term Buy OpportunityEntry Price:
Aggressive Entry: Around CMP (₹165.00) with a strict stop loss, anticipating the breakout.
Conservative Entry: On a confirmed breakout and close above ₹170 on a daily basis.
Target Price 1 (T1): ₹180
Target Price 2 (T2): ₹190
Stop Loss (SL): ₹157 (Closing basis below immediate support)
DISCLAIMER
This report is prepared for informational purposes only and is not intended as a solicitation or an offer to buy or sell any securities. The information contained herein is based on technical analysis and publicly available data, which are believed to be reliable, but no guarantee is made as to their accuracy or completeness. Investing in equities involves risks, and investors should conduct their own due diligence and consult with a financial advisor before making any investment decisions. Past performance is not indicative of future results.
Breakout
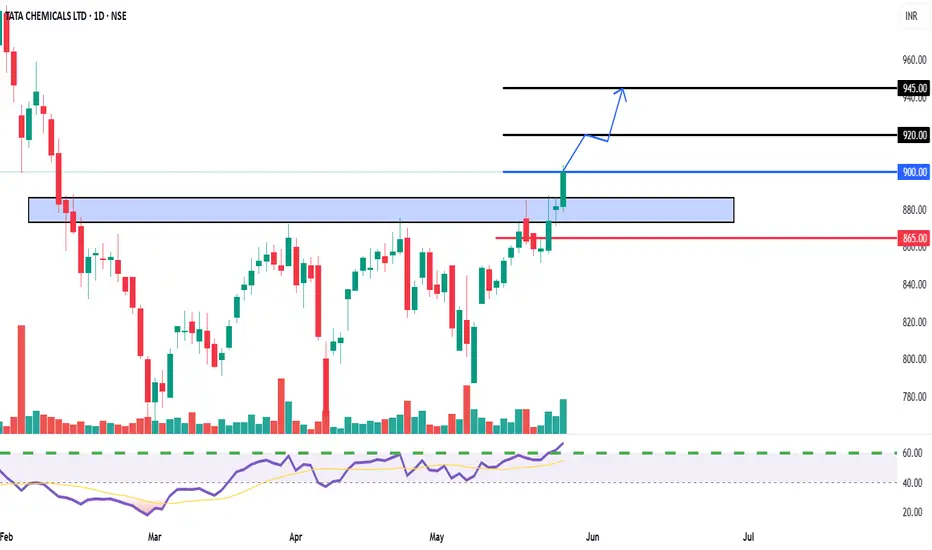
TATA CHEMICALS Breakout Confirmed - Buy on MomentumEntry Price:
Aggressive Entry: Around CMP (₹900-₹905)
Conservative Entry: On a retest of the breakout zone (₹875-₹885), if the opportunity arises.
Target Price 1 (T1): ₹920
Target Price 2 (T2): ₹945
Stop Loss (SL): ₹865 (Closing basis below the breakout zone and previous support)
Cautiously Bullish - Approaching Long-Term Resistance.Entry Zone: We recommend initiating a BUY position in TCGSRAAC only upon a decisive and sustained breakout above the major descending trendline (around ₹115 - ₹118). A daily close above this level with good volumes would be a strong confirmation.
Target 1 (T1): ₹125
Target 2 (T2): ₹132
Target 3 (T3): ₹140+ (If momentum sustains significantly post-breakout)
Stop Loss (SL): ₹105 (Strictly on a daily closing basis, for a breakout entry)
Rationale:
Long-Term Resistance Test: The stock is currently testing a significant descending trendline that has been acting as a major resistance for over several months. A successful breakout would signal a substantial shift in the long-term trend.
Support from Accumulation Zone: The stock has recently bounced from a strong demand zone around ₹80 - ₹88 (highlighted in blue), indicating underlying buying interest.
RSI Rising: The Relative Strength Index (RSI) has recently crossed above the 50-mark and is trending upwards, suggesting a buildup of bullish momentum as the price approaches resistance.
Volume Activity: While recent volumes are moderate, a significant surge in volume on the day of the potential breakout would be crucial for confirmation.
Risk-Reward: A breakout offers a good risk-reward setup for short-term traders, targeting the next set of resistance levels.
Key Risk: Failure to break above the major descending trendline could lead to a reversal and a fall back towards the ₹95 - ₹100 levels. A sustained daily close below ₹105 would invalidate the bullish breakout attempt.
Disclaimer: This report is for informational purposes only and does not constitute financial advice. Investors should conduct their own due diligence and consult with a qualified financial advisor before making any investment decisions. Equity investments are subject to market risks.
For Education Purposes Only

GUN/USDT: FALLING WEDGE BREAKOUT ALERT!!🚀 GUN Falling Wedge Breakout – 35%+ Potential Incoming?! 👀🔥
Hey Traders! If you're all about high-conviction plays and real alpha, smash that 👍 and tap Follow for more setups that actually deliver! 💹💯
GUN has officially broken out of the falling wedge structure on the 2H timeframe — a classic bullish reversal pattern. 🚨
Right now, it's retesting the breakout zone, which is a key confirmation step before the next leg up. If this retest holds, we could see a strong continuation move soon.
📊 Technical Setup:
✅ Falling wedge breakout
🔄 Retesting resistance as new support
🎯 Targets:
TP1: $0.053
TP2: $0.057
TP3: $0.061
TP4: $0.067
🛑 Stop-Loss: Below $0.046
⚙️ Leverage: 5x–10x (use proper risk management)
This is the make-or-break moment — if the retest holds, GUN could fire off big. Stay sharp.

1INCH Inverse Head & Shoulders (1H)BINANCE:1INCHUSDT completed an Inverse Head & Shoulders pattern, clearly visible on the hourly timeframe.
Key Levels
• Left Shoulder: $0.223
• Head: $0.218
• Right Shoulder: $0.223
• Neckline: $0.232
• Measured Target: $0.245 (aligned with local high)
Status
Breakout has already occurred, activating the target.
Next Steps
It may be too late to chase, but a retest of the neckline as support (~$0.232) could offer a compelling long entry.
Invalidation Levels
• Early Invalidation: Break below $0.232
• Full Invalidation: Break below the right shoulder at $0.223

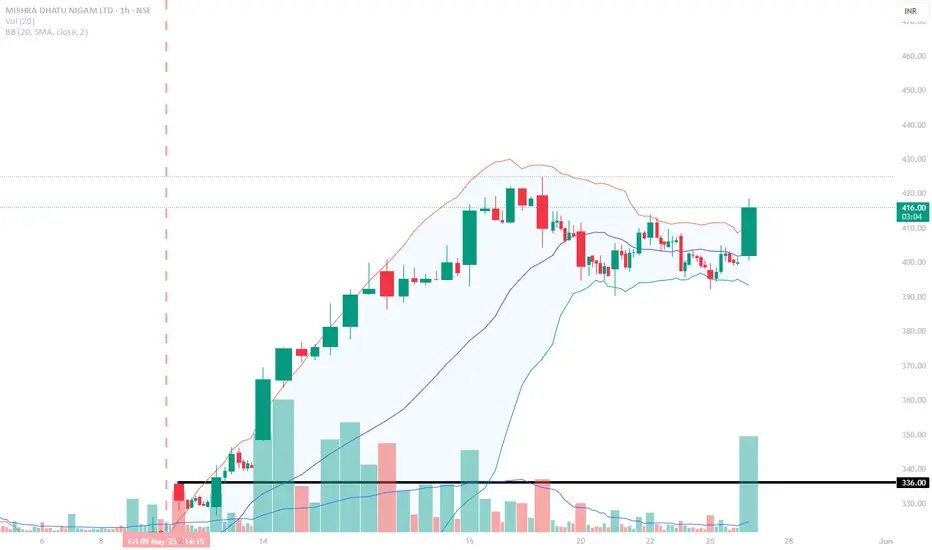
Midhani Ready for Blast!Midhani is in a strong uptrend on the daily time frame, consistently forming higher highs and higher lows. On the lower time frame, the stock had cooled off but has now resumed its upward move, breaking out of a falling trendline on strong volumes. The current setup offers a risk of around 6 per cent, with potential upside targets of 12–15 per cent.
Cardano (ADA) Rectangle + Internal Uptrend (1D)BINANCE:ADAUSDT has spent months ranging between ~$0.51 and ~$1.15, and the structure now clearly qualifies as a rectangle pattern.
After a 3rd touch on support in April, Cardano is showing strength with steady higher lows and a reclaim of a key High Volume Node (HVN).
Key Levels to Watch
• Main Demand: ~$0.51-$0.58
• Rectangle Support: ~$0.51
• Rectangle Resistance: ~$1.15
• Internal Uptrend Support: Rising diagonal from April
• HVN Zone: ~$0.75 — key volume cluster
• Rectangle Midline: ~$0.83 — also a previous S/R
• Main Supply: $1.10–$1.32
Measured Target
If price breaks above $1.15 with volume, the rectangle measured move points to ~$1.80.
Context
ADA has respected this range for nearly half a year. A breakout could mark the start of a macro bullish leg.
Triggers
• Bullish: Clean daily close above $1.15 with volume → $1.80 target activated. For a safer entry, it could be worth waiting a full breakout from the main supply above $1.32.
• Bearish: Breakdown of the ascending trendline and HVN → Potential return to ~$0.51. Failure to hold that level could lead to further downside to the previous ~$0.30 demand zone.

Confirmed Breakout and Retest of Channel Resistance.Entry Zone: We recommend accumulating Rolex Rings Ltd. in the zone of ₹1,460 - ₹1,500. This area represents a crucial retest of the broken descending channel's resistance, now acting as strong support.
Target 1 (T1): ₹1,580
Target 2 (T2): ₹1,650
Target 3 (T3): ₹1,750 (Extended target if momentum remains strong)
Stop Loss (SL): ₹1,400 (Strictly on a daily closing basis)
Rationale:
Clear Channel Breakout: The stock has executed a textbook breakout from a well-defined multi-month descending channel. This indicates a significant shift in the underlying trend from bearish to bullish.
Successful Retest: Post-breakout, the price has pulled back to retest the upper boundary of the channel, which is a classic technical confirmation of a valid breakout. The retest appears to be holding, suggesting the former resistance has turned into reliable support.
Volume Confirmation: The initial breakout was supported by decent volumes, and the current consolidation/retest phase is occurring on relatively lower volumes, which is typical before the next leg up.
RSI Bullish Momentum: The Relative Strength Index (RSI) is maintaining its position above the 50-mark and shows bullish bias, supporting the upward price momentum.
Favorable Risk-Reward: The current entry point offers an attractive risk-reward profile for a short-term trade, with the potential upside significantly outweighing the downside risk defined by the stop-loss.
Key Risk: A decisive daily closing below ₹1,400 would invalidate the bullish breakout and retest pattern, suggesting a false breakout or a resumption of the downtrend. Strict adherence to the stop-loss is advised.
Disclaimer : This report is for informational purposes only and does not constitute financial advice. Investors should conduct their own due diligence and consult with a qualified financial advisor before making any investment decisions. Equity investments are subject to market risks.
For Education purposes only

OMNI ANALYSIS📊 #OMNI Analysis
✅There is a formation of Descending Channel Pattern in daily time frame in #OMNI .
Also there is a perfect breakout and retest. There is an instant trending formation in #OMNI and if #OMNI breaks the trend line then we would see a bullish trend .
👀Current Price: $2.74
🎯 Target Price : $7.49
⚡️What to do ?
👀Keep an eye on #OMNI price action and volume. We can trade according to the chart and make some profits⚡️⚡️
#OMNI #Cryptocurrency #Breakout #TechnicalAnalysis #DYOR

OPEC Countdown: Inverted H&S Signals Potential Oil Price Rise🧭 Market Context – OPEC in Focus
As Crude Oil Futures (CL) grind in tight consolidation, the calendar reminds traders that the next OPEC meeting takes place on May 28, 2025. This is no ordinary headline event — OPEC decisions directly influence global oil supply. From quota adjustments to production cuts, their moves can rapidly shift price dynamics across energy markets. Every tick in crude oil reflects not just current flows but also positioning ahead of such announcements.
OPEC — the Organization of the Petroleum Exporting Countries — coordinates oil policy among major producers. Its impact reverberates through futures markets like CL and MCL (Micro Crude), where both institutional and retail traders align positions weeks in advance. This time, technicals are speaking loud and clear.
A compelling bottoming structure is taking shape. The Daily timeframe reveals an Inverted Head and Shoulders pattern coinciding with a bullish flag, compressing into a potential breakout zone. If momentum confirms, CL could burst into a trend move — just as OPEC makes its call.
📊 Technical Focus – Inverted H&S + Flag Pattern
Price action on the CL daily chart outlines a classic Inverted Head and Shoulders — a reversal structure that traders often monitor for high-conviction setups. The neckline sits at 64.19, and price is currently coiled just below it, forming a bullish flag that overlaps with the pattern’s right shoulder.
What makes this setup powerful is its precision. Not only does the flag compress volatility, but the symmetry of the shoulders, the clean neckline, and the breakout potential align with high-quality chart pattern criteria.
The confirmation of the breakout typically requires trading activity above 64.19, which would trigger the measured move projection. That target? Around 70.59, which is near a relevant UFO-based resistance level — a region where sellers historically stepped in with force (UnFilled Orders to Sell).
Importantly, this bullish thesis will fail if price drops below 60.02, the base of the flag. That invalidation would potentially flip sentiment and set up a bearish scenario with a target near the next UFO support at 53.58.
To properly visualize the dual scenario forming in Crude Oil, a multi-timeframe approach is often very useful as each timeframe adds clarity to structure, breakout logic, and entry/exit positioning:
Weekly Chart: Reveals two consecutive indecision candles, reflecting hesitation as the market awaits the OPEC outcome.
Daily chart: Presents a MACD bullish divergence, potentially adding strength to the reversal case.
Zoomed-in 4H chart: Further clarifies the boundaries of the bullish flag.
🎯 Trade Plan – CL and MCL Long/Short Scenarios
⏫ Bullish Trade Plan:
o Product: CL or MCL
o Entry: Break above 64.19
o Target: 70.59 (UFO resistance)
o Stop Options:
Option A: 60.02 (tight, under flag)
Option B: ATR-based trailing stop
o Ideal for momentum traders taking advantage of chart pattern combined with fundamental data coming out of an OPEC meeting
⏬ Bearish Trade Plan:
o Trigger: Break below 60.02
o Target: 53.58 (UFO support)
o Stop Options:
Option A: 64.19 (tight, above flag)
Option B: ATR-based trailing stop
o Ideal for momentum traders fading pattern failures
⚙️ Contract Specs – CL vs MCL
Crude Oil can be traded through two futures contracts on CME Group: the standard CL (WTI Crude Oil Futures) and the smaller-sized MCL (Micro WTI Crude Oil Futures). Both offer identical tick structures, making MCL a powerful instrument for traders needing more flexibility in position sizing.
CL represents 1,000 barrels of crude per contract. Each tick (0.01 move) is worth $10, and one full point of movement equals $1,000. The current estimated initial margin required to trade one CL contract is approximately $6,000 per contract, although this may vary based on market volatility and brokerage terms.
MCL, the micro version, represents 100 barrels per contract — exactly 1/10th the size of CL. Each 0.01 tick move is worth $1, with one point equaling $100. The estimated initial margin for MCL is around $600, offering traders access to the same technical setups at significantly reduced capital exposure.
These two contracts mirror each other tick-for-tick. MCL is ideal for:
Testing breakout trades with lower risk
Scaling in/out around events like OPEC
Implementing precise risk management strategies
Meanwhile, CL provides larger exposure and higher dollar returns but requires tighter control of risk and account drawdowns. Traders can choose either—or both—based on their strategy and account size.
🛡️ Risk Management – The Foundation of Survival
Technical setups don’t make traders profitable — risk management does.
Before the OPEC meeting, traders must be aware that volatility can spike, spreads may widen, and whipsaws can invalidate even the cleanest chart pattern.
That’s why stop losses aren’t optional — they’re mandatory. Whether you choose a near level, a deeper stop below the head, or an ATR-based trailing method, the key is clear: define risk before entry.
MCL helps mitigate capital exposure for those testing breakout confirmation. CL demands higher margin and greater drawdown flexibility — but offers bigger tick rewards.
Precision also applies to exits. Targets must be defined before entry to maintain reward-to-risk discipline. Avoid adding to losers or chasing breakouts post-event.
And most importantly — never hold a losing position into an event like OPEC, hoping for recovery. Risk is not a gamble. It’s a calculated variable. Treat it with respect.
When charting futures, the data provided could be delayed. Traders working with the ticker symbols discussed in this idea may prefer to use CME Group real-time data plan on TradingView: www.tradingview.com - This consideration is particularly important for shorter-term traders, whereas it may be less critical for those focused on longer-term trading strategies.
General Disclaimer:
The trade ideas presented herein are solely for illustrative purposes forming a part of a case study intended to demonstrate key principles in risk management within the context of the specific market scenarios discussed. These ideas are not to be interpreted as investment recommendations or financial advice. They do not endorse or promote any specific trading strategies, financial products, or services. The information provided is based on data believed to be reliable; however, its accuracy or completeness cannot be guaranteed. Trading in financial markets involves risks, including the potential loss of principal. Each individual should conduct their own research and consult with professional financial advisors before making any investment decisions. The author or publisher of this content bears no responsibility for any actions taken based on the information provided or for any resultant financial or other losses.

JUP/USDT: Classic Inverse Head & Shoulders Breakout!🚀 JUP Inverse Head and Shoulder Breakout – 80% Potential Incoming?! 👀🔥
Hey Traders! If you're all about high-conviction plays and real alpha, smash that 👍 and tap Follow for more setups that actually deliver! 💹💯
JUP is breaking out of a textbook Inverse Head and Shoulders pattern on the 12H timeframe — signaling a strong bullish reversal after a long downtrend.
🟢 Pattern: Inverse H&S
📊 Breakout Confirmation: Neckline flipped into support
🎯 Target Zone: $1.05+
🛡️ Invalidation: Close below $0.534
Momentum is shifting, and bulls seem to be back in charge. If this pattern plays out fully, we’re looking at a potential 70%+ move from current levels.
Let the chart speak. Keep this one on your radar!

EURUSD - Important Breakout !Hello Traders !
The EURUSD price formed a descending channel.
Currently, The resistance line is broken !
So, I expect a bullish move🚀
______________
TARGET: 1.14095🎯

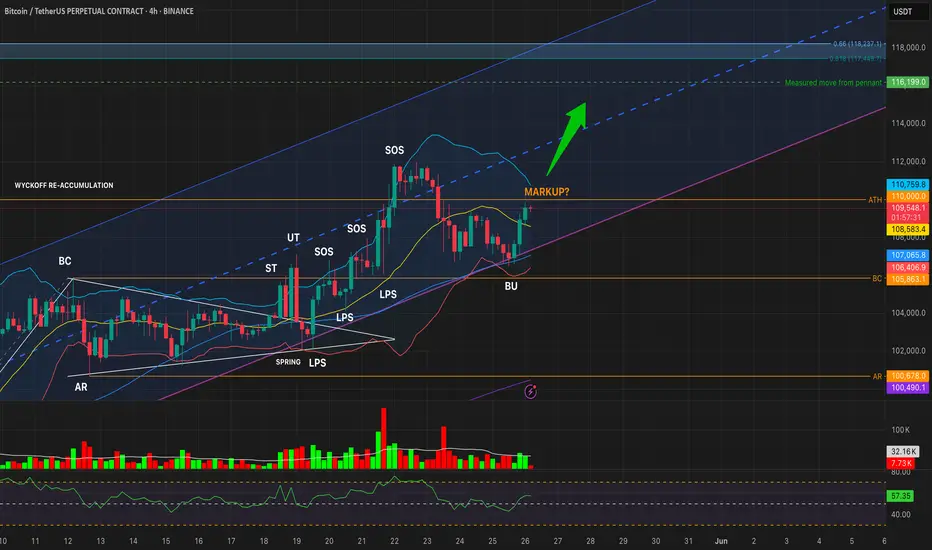
BTCUSDT – Reaccumulation Breakout or Bearish S/R Flip?Timeframes: 1W • 1D • 4H
Structure: Wyckoff Reaccumulation nearing Phase E — but ATH is acting as resistance
🔹 WEEKLY OUTLOOK: Macro Structure Points to Markup
Last weekly candle closed above the reaccumulation Buying Climax (BC), showing bullish intent
Weekly upper Bollinger Band is rising toward 113k
RSI at 67, strong but not overbought
Structure suggests we’re entering Wyckoff Phase E
Weekly Targets:
🟢 TP1: 113,049 (Upper BB)
🟢 TP2: 116,199 (measured move)
🟢 TP3: 118,237 (Fib 0.66 extension)
🔹 DAILY OUTLOOK: Still Holding Above Reaccumulation Range
Multiple daily closes above the BU (backup) zone, but all below 110k ATH
RSI is strong (~66), and price is tracking near the upper BB, but volume is not convincing
Until a daily close above 110,000, breakout remains unconfirmed
🔹 4H OUTLOOK: Structure Valid, Momentum Rising
BU zone held; price made two lower lows followed by a higher high
RSI has reclaimed 57+, and volume is picking up modestly
4H structure looks like an early Phase E breakout attempt, but...
⚠️ Caution: Is This a Bearish S/R Flip?
While the broader Wyckoff structure suggests a transition into markup, we must also consider the bearish scenario:
BTC may be failing a support/resistance flip at 110k
All timeframes have rejected at or below 110k, despite multiple attempts
If we see a lower high under 109k + 1D close below 105,863 with red volume and RSI < 45 → this becomes a confirmed bull trap
📊 TL;DR:
BTC is structurally bullish — but we are at the final test zone.
🔓 Breakout confirmed: Daily close above 110k
🔒 Failure confirmed: Close below 105,863 + red volume + RSI breakdown
Stay nimble. This is either the last shakeout before markup… or the top of the range before reversal.
#Bitcoin #BTCUSDT #Wyckoff #CryptoTrading #TechnicalAnalysis #Reaccumulation #Breakout #SupportResistance
HCCHCC is on the verge to give triangle breakout provided that it sustains and closes above 31.5. I observed increased market participation. It may face bit of resistance near 36 level and above that it has a potential to go up to 45 levels. But closes below 28.5 may change my view for the stock. Again I'm saying that sustaining above 31.5 is very crucial. Keep a closer watch on how it reacts near this levels.

Potential Reversal and Breakout Retest.Entry Zone: We recommend initiating a BUY position in AIA Engineering Ltd. around the current levels, ideally between ₹3,280 - ₹3,320. This area represents a retest of the recent trendline breakout.
Target 1 (T1): ₹3,400
Target 2 (T2): ₹3,480
Target 3 (T3): ₹3,580 (If momentum sustains above T2)
Stop Loss (SL): ₹3,200 (Strictly on a closing basis)
Trendline Breakout & Retest: The stock recently broke out of a significant descending trendline, indicating a potential end to the corrective phase. The current price action appears to be a successful retest of this broken trendline, which often acts as new support, presenting a lower-risk entry point.
Volume Confirmation: The initial breakout was accompanied by higher volumes, and while the retest phase has lower volumes (typical), sustained buying interest on subsequent upward moves would confirm strength.
RSI Bounce from Support: The Relative Strength Index (RSI) is showing a bounce from the 40-50 zone, indicating that momentum is regaining strength and potentially moving towards the bullish territory.
Positive Structure: The overall chart structure suggests that the stock is attempting to reverse its short-term downtrend and potentially resume its broader upward trajectory.
Favorable Risk-Reward: The current setup offers a reasonable risk-to-reward ratio for a short-term trade, with potential for upside gains outweighing the defined risk.
Key Risk: A close below ₹3,200 would invalidate the bullish retest scenario and could lead to further downside, bringing the previous lows into play. Traders should adhere strictly to the stop-loss.

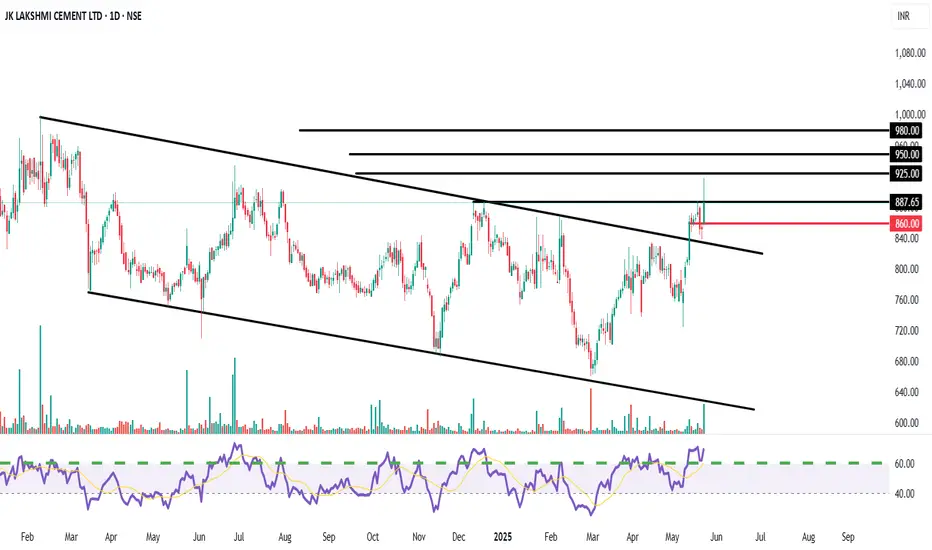
Potential Breakout from a Symmetrical Triangl Descending ChannelEntry Zone: We recommend initiating a BUY position in JK Lakshmi Cement around the current levels, ideally between ₹880 - ₹890. This considers the strong closing above the resistance trendline.
Target 1 (T1): ₹925
Target 2 (T2): ₹950
Target 3 (T3): ₹980 (If momentum sustains above T2)
Stop Loss (SL): ₹860 (Strictly on a closing basis)
Channel Breakout: The stock has decisively broken out of a multi-month descending channel/symmetrical triangle pattern, indicating a potential strong reversal from a corrective phase. This breakout appears to be supported by a noticeable pickup in volumes.
Key Resistance Breach: The stock has also managed to close above a significant horizontal resistance level around ₹880-885, which has acted as a hurdle multiple times in the past. A sustained move above this level confirms bullish intent.
RSI Strength: The Relative Strength Index (RSI) is showing strength, trading well above the 50-mark and moving towards the overbought zone, confirming increasing buying momentum.
Positive Price Action: The overall structure suggests accumulation at lower levels, and the current breakout could initiate the next leg of the uptrend.
Favorable Risk-Reward: The setup offers a compelling risk-reward profile for a short-term trade, with significant upside potential compared to the defined stop-loss.
Key Risk: A failure to sustain above the ₹880 level or a close below the ₹860 stop-loss would invalidate the bullish view and could lead to renewed selling pressure.
Bullish - Breakout observed from a descending channelEntry Zone: We recommend accumulating FSL in the zone of ₹375 - ₹385.
Target 1 (T1): ₹405
Target 2 (T2): ₹420
Target 3 (T3): ₹450 (If momentum sustains above T2)
Stop Loss (SL): ₹360 (Closing basis)
Rationale:
Channel Breakout: The stock has successfully broken out of a prominent descending channel, indicating a potential shift in momentum from bearish to bullish. This breakout is supported by decent volumes on the breakout candle.
RSI Confirmation: The Relative Strength Index (RSI) has shown a strong move above the 50-mark and is trending upwards, suggesting increasing buying interest and underlying strength.
Support from Previous Levels: The breakout retests appear to hold the previous resistance now acting as support, which is a classic bullish reversal pattern.
Risk-Reward: The current setup offers a favorable risk-to-reward ratio for short-term traders.
Key Risk: A close below ₹360 would negate the current bullish view and could lead to further downside. Traders should adhere strictly to the stop-loss.
Disclaimer: This report is for informational purposes only and does not constitute financial advice. Investors should conduct their own due diligence and consult with a qualified financial advisor before making any investment decisions. Equity investments are subject to market risks.

GBP_USD SWING BREAKOUT|LONG|
✅GBP_USD made an absolutely
EPIC breakout of the key horizontal
Level of 1.3426 and the breakout is
Confirmed even on a DAILY timeframe
Which combined with the strong uptrend
Makes us extremely bullish biased on
The pair and we will be expecting
Further growth in the coming weeks
After a potential local pullback
LONG🚀
✅Like and subscribe to never miss a new idea!✅
Disclosure: I am part of Trade Nation's Influencer program and receive a monthly fee for using their TradingView charts in my analysis.

Bitcoin - Confirmed Breakout#BTC/USDT #Analysis
Description
---------------------------------------------------------------
+ Bitcoin has successfully broken out from the resistance, this is the third time bitcoin has broken out from the resistance line, in the previous two breakouts bitcoin had significant growth and we can expect similar growth this time.
+ the next target for bitcoin is around 150k and this is an easy target for bitcoin.
+ Bitcoin can see some consolidation around previous resistance (around 109k) but this can be broken easily.
+ Lets see how this plays out.
---------------------------------------------------------------
Enhance, Trade, Grow
---------------------------------------------------------------
Feel free to share your thoughts and insights. Don't forget to like and follow us for more trading ideas and discussions.
Best Regards,
VectorAlgo

ARB - Beautiful Falling Wedge Pattern---------------------------------------------------------------
Description
---------------------------------------------------------------
+ Perfect falling wedge pattern has formed for ARB, a clear breakout from this falling wedge pattern is imminent.
+ breakout from this falling wedge pattern could push the price to previous All time high.
---------------------------------------------------------------
VectorAlgo Trade Details
------------------------------
Entry Price: 0.39
Stop Loss: 0.16
------------------------------
Target 1: 0.6229
Target 2: 0.9196
Target 3: 1.1430
Target 4: 1.6343
Target 5: 2.1129
------------------------------
Timeframe: 1W
Capital: 1-2% of trading capital
Leverage: 5-10x
---------------------------------------------------------------
Enhance, Trade, Grow
---------------------------------------------------------------
Agree or Disagree with the ideas ? lets discuss in the comments.
Like and follow us for more ideas.
Best Regards,
VectorAlgo

Conslidation Box
Closed at 9.14 (23-05-2025)
Trying to break the long consolidation box.
Important Support Zone is around 8 - 8.70
Channel bottom is around 5.30 which seems
unlikely as of now because of Bullish Divergence
on weekly tf.
Upside targets can be around 11 & then around 14

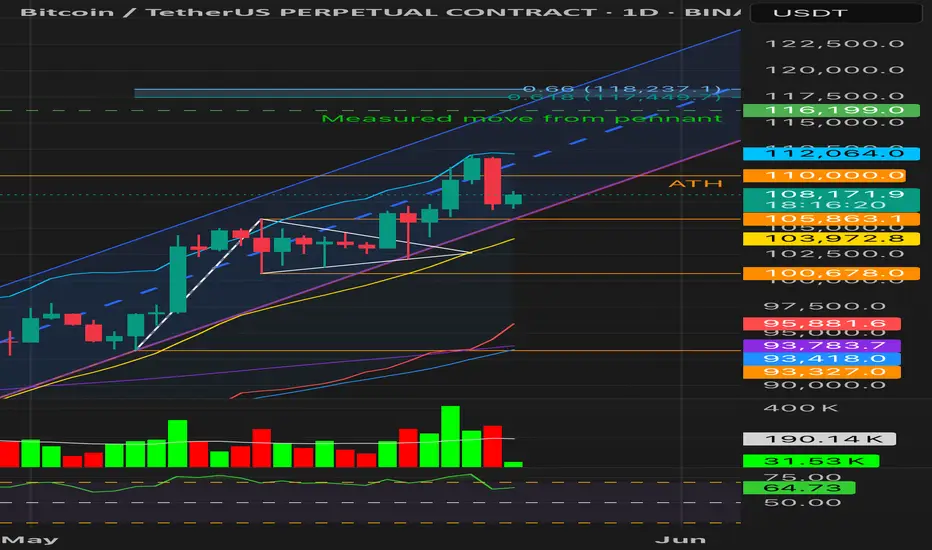
Bitcoin Breakout Under Threat or Bullish Retest?1D Chart
• Price broke above ATH (~110K) on May 22 with a +1.87% gain, backed by strong volume (~413K vs 190K avg) — signaling legitimate breakout intent.
• May 23 followed with a -3.93% bearish engulfing candle, closing back below ATH on elevated sell volume (~279K).
• Despite the rejection, the breakout bar showed no upper wick exhaustion, so not a blow-off.
• RSI = 63.26 — still bullish but curling down.
• Price is testing the channel midline; Fib extensions (117.4K–118.2K) remain unmet.
Conclusion: Initial breakout was technically valid and volume-confirmed, but price is now under threat.
Loss of 103.9K would invalidate the structure and raise distribution risks.
⸻
4H Chart
• Price closed 4 times below mid-Bollinger Band — short-term momentum has weakened.
• RSI bounced back above 50, avoiding breakdown territory.
• Volume is tapering (weekend), and price is hovering just above the previous LPS zone.
• Watching for resolution from a potential Backup (BU) retest.
⸻
Wyckoff View
• Still within Phase E of re-accumulation — unless 103–105K breaks decisively.
• Valid structure: Spring → LPS → SOS → BU(?)
• A break below structure = possible UTAD scenario
⸻
Key Levels
• Support: 105,863 / 103,986 / 100,678
• Resistance: 110,000 / 112,100 / 116,199
• Target Extension Zone: 117,449 – 118,237
NFP ANALYSIS🚀#NFP Analysis : Pattern Formation💲💲
🔮As we can see in the chart of #NFP that there is a formation inverse head and shoulder pattern and it's a bullish pattern. Also there is a perfect breakout and retest of the levels. This indicates a potential bullish move.📈📈
🔰Current Price: $0.0910
🎯 Target Price: $0.1100
⚡️What to do ?
👀Keep an eye on #NFP price action. We can trade according to the chart and make some profits. The price must close above the neckline. After that we will see a bullish move. ⚡️⚡️
#NFP #Cryptocurrency #TechnicalAnalysis #DYOR
