Gold Set to Reach Historic HighsHello everyone, great to see you again!
Gold has been on a strong upward trajectory, breaking previous bearish structures and showing solid growth momentum. Market sentiment is heavily supported by the weakening of global currencies, particularly the US dollar, and expectations surrounding the potential interest rate cuts by the Federal Reserve.
Looking at the technical picture, we are approaching the historic peak of $3,433. The gold market is showing significant strength, confirmed by EMA 34 and EMA 89, as well as new support zones, signaling a trend reversal and confirming the bullish outlook.
The next few trading sessions could play a critical role in confirming whether the precious metal can break the all-time highs.
What do you think? Is gold about to make history? Let me know in the comments below!
Breakout

BTCUSD – Heading Towards Lower Support?Hello everyone, what are your thoughts on BTCUSD?
BTCUSD is currently trading around 113,92, moving within a clear downward price channel. It seems like the price could continue to decline as the coin moves toward the lower boundary of the channel.
If conditions remain favorable, I expect 110,000 to be tested in the short term.
What do you think? Do you expect BTCUSD to keep heading lower, or will it bounce back? Let me know your thoughts below!

USDJPY Bullish Momentum Continues ? Hello traders, what do you think about USDJPY?
As of now, USDJPY is showing a slight upward movement after the recent correction. The price is trading around 147.59, not changing much since the beginning of the session.
The Japanese yen remains under pressure due to Japan’s slow recovery and ongoing economic challenges, giving USD an edge to capitalize on recent gains.
From a technical standpoint, USDJPY is moving in an ascending wedge pattern. After testing the trendline support near 147, the pair could be headed toward the psychological target of 150, or even higher towards the upper trendline boundary in the coming days.
Keep an eye on the price action near key resistance levels as the market continues to evaluate global economic factors, especially the upcoming US jobs data and Fed policy outlook.
What’s your take on USDJPY? Do you expect this pair to rise further? Let me know in the comments below!

GBPUSD – Trendline Broken, More Downside Ahead?Hello traders! What’s your take on GBPUSD?
The GBP/USD pair has broken below its long-term ascending trendline and is now trading beneath a key resistance zone. After a failed breakout at the newly formed trendline, price quickly reversed and dropped sharply.
This resistance zone previously acted as a strong support level but has now been flipped to resistance. If price fails to reclaim this area during the next pullback, the bearish outlook will be further confirmed.
💬 Do you think GBPUSD will bounce from the 1.32 region, or will it continue falling toward the lower targets? Share your thoughts below!

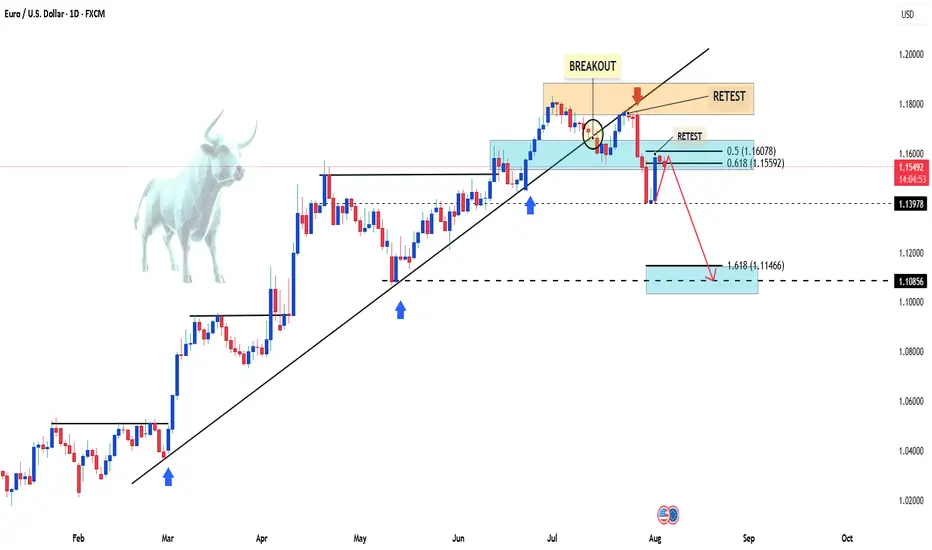
EURUSD Faces Renewed Selling PressureHello, what are your thoughts on EURUSD?
After failing to break above the 1.1600 level, the EUR/USD pair is now facing strong selling pressure again, currently testing the mid-1.1500s on Monday. Meanwhile, the US Dollar has seen a modest rebound across the board as investors digest Friday’s sharp drop following weaker-than-expected US jobs data.
From a technical standpoint, this setup may lead EURUSD to even lower levels. The recent movement aligns well with our previous outlook and follows the Dow Theory principles.
I'm expecting the price to continue its correction—what about you?
OKLO — when nuclear momentum breaks resistanceSince late 2024, OKLO had been consolidating inside a clear rectangle between $17 and $59. The breakout from this long-term range triggered a new bullish impulse. The price has since returned to retest the breakout zone, now aligned with the 0.618 Fibonacci retracement at $51.94. The retest has completed, and the price is bouncing upward, confirming buyer interest.
Technically, the trend remains firmly bullish. The price closed above the prior range, EMAs are aligned below, and the volume spike during breakout supports genuine demand. The volume profile shows a clean path toward $100, indicating limited resistance ahead. The structure suggests a controlled rally rather than an exhausted move.
Fundamentally, OKLO is a next-generation SMR (Small Modular Reactor) company focused on delivering compact, efficient nuclear power solutions. Following its public debut via SPAC and recent capital injection, OKLO is transitioning from development to implementation. Institutional interest is holding strong, and the broader move toward decarbonization and energy independence places the company in a strategic position.
Target levels:
— First target: $100 — psychological and technical resistance
— Second target: $143 — projected from prior range breakout
OKLO isn’t just another clean energy ticker — it’s a quiet disruptor with nuclear potential. The chart broke out. The volume confirmed. Now it’s time to see if the market follows through.

USDJPY Breakout and Potential RetraceHey Traders, in today's trading session we are monitoring USDJPY for a selling opportunity around 148.300 zone, USDJPY was trading in an uptrend and successfully managed to break it out. Currently is in a correction phase in which it is approaching the retrace area at 148.300 support and resistance area.
Trade safe, Joe.

Near BreakoutBFBIO Analysis
CMP 164.75 (05-08-2025 03:24PM)
Near Breakout. However, important to
Cross & Sustain 170 for further upside.
It has the potential to touch atleast 190 - 200
initially.
In worst case, 146 - 165 is the Support Zone.

Gold Surges on Weak NFP Hello everyone, what’s your take on XAUUSD?
Gold prices soared at the end of the last session and are now trading around $3,380. This sharp rise followed a weaker-than-expected U.S. Non-Farm Payrolls (NFP) report, which shifted market sentiment toward expectations that the Fed may delay interest rate cuts. As a result, the U.S. dollar weakened and demand for gold as a safe haven surged.
Technically, gold appears to be forming a cup and handle pattern, with the first resistance target at $3,400, followed by $3,435.
What do you think? Could this rally continue? Let us know in the comments!

EURUSD – Bearish pullback in play ? EURUSD has broken the ascending trendline and dropped below the EMA confluence, confirming a bearish structure. The current rebound is testing the 0.5–0.618 Fibonacci zone, but weak buying pressure and rejection candles suggest it’s likely just a technical pullback.
If momentum holds, the pair may resume its downtrend toward 1.1400 and potentially 1.1296. The bears remain in control unless strong fundamentals shift the balance.

GBP_NZD BULLISH BREAKOUT|LONG|
✅GBP_NZD broke the key structure level of 2.2500
While trading in an local downtrend
Which makes me bearish
And I think that after the retest of the broken level is complete
A rebound and bearish continuation will follow
SHORT🔥
✅Like and subscribe to never miss a new idea!✅

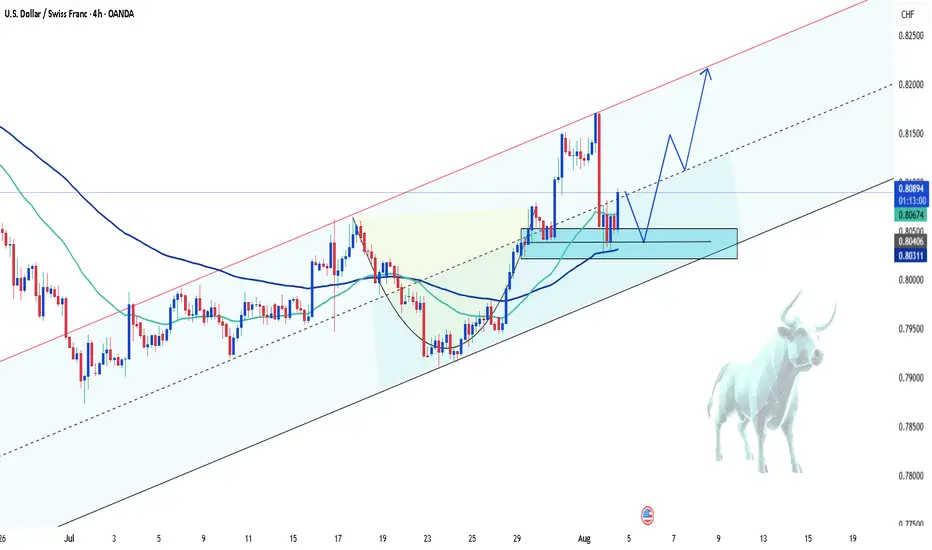
USDCHF – Bullish comeback in progress?Hey everyone! What’s your take on the current trend of USDCHF?
While the pair experienced a recent dip, take a step back and look at the bigger picture — doesn’t it still seem to be moving within an ascending channel?
Right now, USDCHF is hovering around 0.8092 and starting to bounce back. The recovery appears to be supported by a newly formed support zone and the confluence of the EMA 34 and 89. The pair seems to be eyeing the recent high, with potential to climb further toward the upper boundary of the channel.
My current bias? Bullish.
What about you — do you see the same opportunity?
Drop a comment and hit like if you’re on the same page!
AUDUSD Breakout and Potential RetraceHey Traders, in today's trading session we are monitoring AUDUSD for a buying opportunity around 0.64700 zone, AUDUSD was trading in a downtrend and successfully managed to break it out. Currently is in a correction phase in which it is approaching the retrace area at 0.64700 support and resistance zone.
Trade safe, Joe.

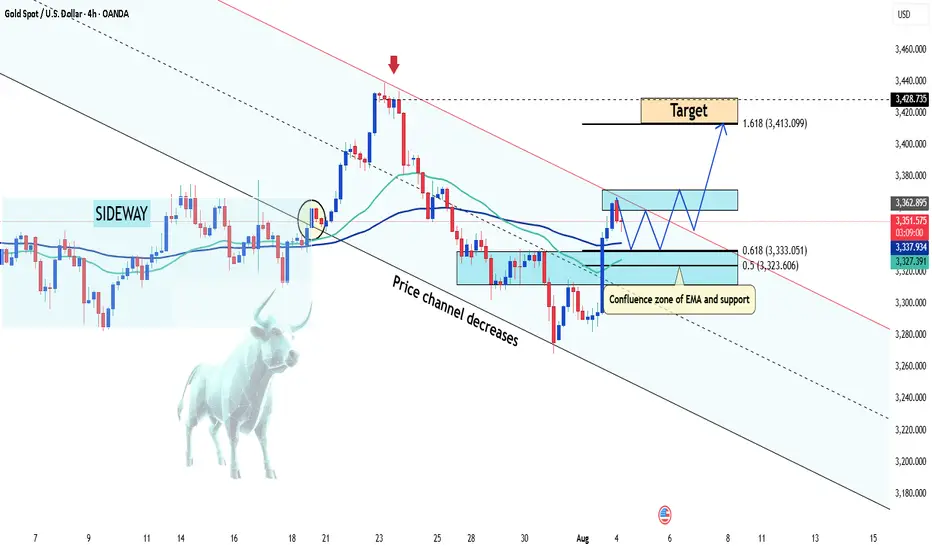
Latest Gold Price Update TodayHey everyone! Let’s take a closer look at what’s happening with gold today.
Over the past week, the global gold market experienced dramatic swings. Prices tumbled following cautious remarks from Federal Reserve Chair Jerome Powell, only to rebound sharply after disappointing U.S. employment data.
On Wednesday, the Fed held interest rates steady, and Powell stated, “We haven’t made any decisions for September.” Though brief, that statement hinted that a rate cut isn’t guaranteed — dashing investor hopes and sending gold to its lowest level in four weeks.
But by Friday, the narrative flipped. A weaker-than-expected jobs report triggered a powerful rally. Within just two minutes of the data release, gold surged by $30, closing the week at $3,361 — a gain of over 2% in a single day.
These moves highlight just how sensitive gold is to Fed signals. A slight shift in tone or a single data point can spark major volatility.
From a technical perspective, falling U.S. Treasury yields have allowed XAU/USD to regain bullish momentum, as the market reassesses Fed rate expectations after the weak NFP print. If gold successfully breaks out of its current channel after a short-term pullback, the next target could be $3,400 — or even higher.
Do you agree with this outlook? Share your thoughts in the comments.
Good luck and happy trading!
Bikaji Food Triangular Pattern, Long, 1DBikaji Food is following a triangular pattern. If it breaks the level of 780 with Bullish candlestick patterns like Bullish Engulfing, Hammer & Inverted Hammer, Piercing Line, Morning Star, Three White Soldiers, Tweezer Bottoms or Bullish Harami, then take a long trade on this stock with first target of 815 and second target of 851.
Entry: 780 (on Bullish candlestick pattern)
Target1: 815
Target2: 851

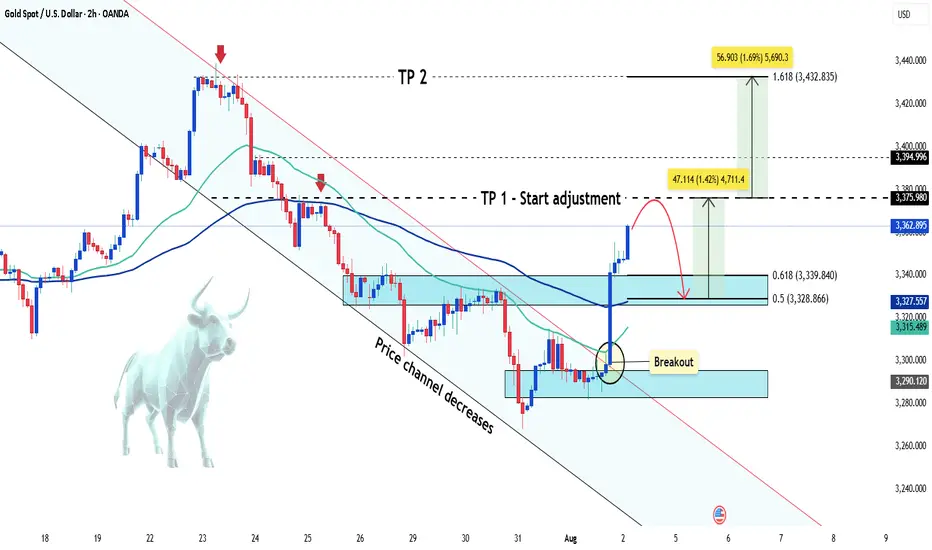
Gold suddenly increased sharply Hey everyone, let’s dive into what’s happening with XAUUSD!
Gold is experiencing a remarkable rally this weekend, skyrocketing from the $3,285 zone to around $3,362 — gaining over 700 pips. This sharp move comes amid weakening U.S. labor market data, which has fueled speculation that the Federal Reserve may begin cutting interest rates as early as September.
According to the U.S. Bureau of Labor Statistics (August 1st), non-farm payrolls rose by just 73,000 jobs in July — well below economists’ expectations of 106,000. The disappointing figures have shaken confidence in the U.S. economy and placed pressure on the U.S. dollar, as markets increasingly anticipate a dovish shift from the Fed.
For gold, this weak jobs report reinforces its role as a safe-haven asset, driving strong demand as investors seek protection from economic uncertainty. At the same time, lingering fears around global trade tensions and new tariffs imposed by President Donald Trump continue to support the flight to safety.
From a technical perspective, gold has broken out of its descending price channel and is moving fast. According to Dow Theory, a short-term correction may occur soon, but if price holds above key support levels, the rally could extend toward the $3,432 region — the 1.618 Fibonacci extension zone.
This move might mark the beginning of a new bullish phase after weeks of consolidation.
What do you think — is gold just getting started?
BTCUSD – bullish momentum is backBitcoin is making a strong comeback, breaking above short-term resistance and reestablishing its uptrend after a prolonged consolidation phase. The technical structure now shows clear control from the bulls, with higher highs and higher lows beginning to form.
Positive risk sentiment and growing expectations of capital flowing back into the crypto space—especially after a series of weak U.S. economic data—are fueling the current BTCUSD rally. If momentum holds, the next target could be the upper boundary of the price channel.
Keep an eye on how price reacts at key levels and trendlines — this might be the launchpad for the next bullish leg.
Good luck, and if you enjoyed this analysis, don’t forget to hit like and drop a comment!

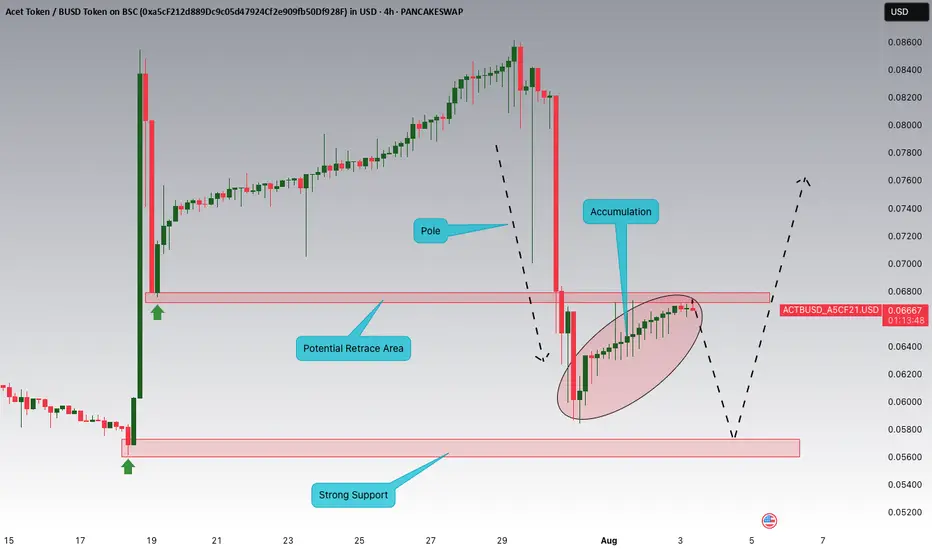
ACTBUSD Breakout and Potential RetraceHey Traders, above is a technical overview on ACTBUSD and the most important zones to watch.
XAUUSD – the calm before the next breakout?Hello traders, what’s your take on the current trend in OANDA:XAUUSD ?
Looking back over the past 12 months, gold has delivered a truly impressive performance. From around $2,380 in August 2024, the precious metal surged to an all-time high of $3,432 by April this year — a gain of more than $1,000 in less than a year. But what’s more telling than the rise itself is how the market behaved afterward: instead of crashing, gold has maintained a high consolidation range, suggesting the uptrend is still very much alive.
This powerful rally didn’t happen in isolation. In a world marked by uncertainty, gold has once again asserted its role as a safe-haven asset. Inflation remains persistent across major economies, geopolitical tensions continue to stretch from Eastern Europe to the Middle East and Asia, and de-dollarization efforts by countries like China and Russia are reshaping global capital flows. None of these events alone could shake the markets, but together, they have laid the groundwork for gold’s sustained relevance.
From a technical standpoint, the long-term bullish structure remains intact. Following its peak at $3,432, gold has entered a modest correction phase — one that may well be a healthy consolidation before the next directional move.
Interestingly, while many investors remain cautious, the chart paints a different story: a market that isn’t afraid, but simply catching its breath. The real question is no longer “Can gold hold above $3,400?” but rather “Is the market gearing up for a fresh breakout — or a deeper correction?”
We may not be able to predict the future, but we can observe how price reacts at key levels. And sometimes, it’s in these seemingly quiet phases that the biggest turning points begin to form.
What do you think — is gold preparing for another leg up?
Drop your thoughts in the comments below! 👇

Monthly Breakout.PPL Analysis
Closed at 181.78 (01-08-2025)
Monthly Breakout.
Extremely Bullish; potential to touch 240+
However, it should not break 128 now.
174 - 175 & then 165 - 167 seems to be a
Good Support level.

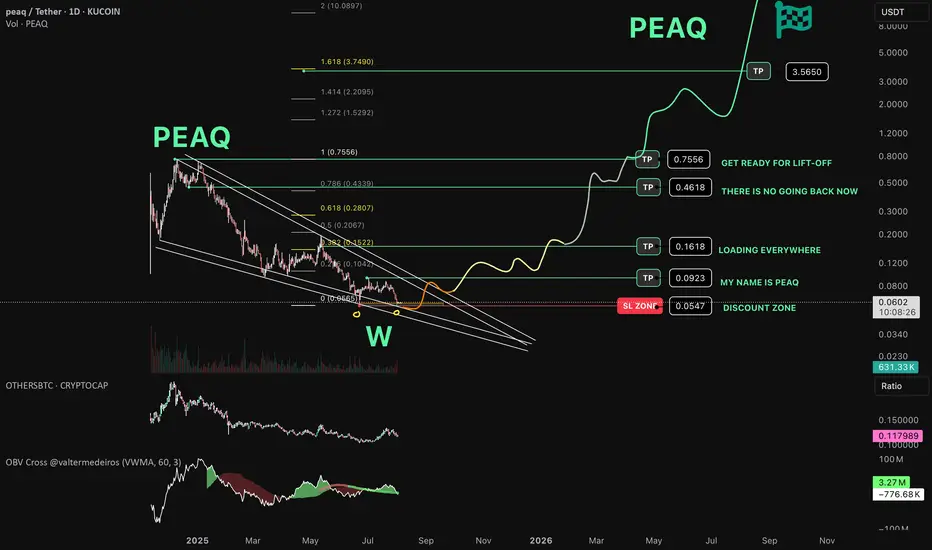
PEAQ Network about to make another pea(q) ? Bottom can be IN!
// ==================================
// ====THE===========================
// ========MACHINE=============^^====
// ===============NEEDS===TALK=======
// ====================TO============
// ==================================
Is this the time?
Chart Recap
🔍 Pattern:
Price formed a falling wedge pattern, which typically signals a potential bullish reversal.
A large W-shaped double bottom pattern is highlighted at the wedge's base, adding strength to the bullish thesis. Can this be the awaited bottom?
🟢 Accumulation & Support Zone :
"DISCOUNT ZONE" is marked near $0.0547, aligned with the wedge support.
Repeated touches at this level suggest strong buyer interest — also called "MY NAME IS PEAQ" and "LOADING EVERYWHERE"
🚀 Bullish Scenario & Targets:
If the wedge breakout plays out:
TP1: $0.0923 – early target near the local range high.
TP2: $0.1618 – aligns with the 0.382 Fib level.
Labeled as “LOADING EVERYWHERE”
TP3: $0.4618 – near the 0.618 retracement.
“THERE IS NO GOING BACK NOW”
TP4: $0.7556 – previous swing high.
“GET READY FOR LIFT-OFF”
TP5: $3.5650 – long-term Fib extension target (1.618).
Ultimate moonshot-level target.
XAUUSD Daily Outlook – August 4, 2025We’re not in breakout. We’re deep in premium — and supply is stacked.
—
Gold is now trading at 3362, sitting right inside the first valid daily supply zone — the same block between 3355 and 3375 that caused the last rejection. The bullish rally from 3272 was clean: liquidity sweep, CHoCH, imbalance filled, HL confirmed. Bulls did their job. Now they’re walking straight into pressure.
Above this zone, things don’t get easier — they get trickier.
Just a bit higher, we have an internal supply trap between 3398 and 3412. It’s a reaction zone built from imbalance and inducement — not strong enough to hold a reversal on its own, but perfect to fake out breakout buyers. If price pushes through 3375 and enters this pocket, snipers should be watching carefully for early signs of weakness.
And finally, at the top of the current structure sits the HTF supply trap at 3430–3439 — the last weekly wick, the macro reversal zone. That level is sacred. If price makes it there, either we’ll see full-blown expansion… or a violent reversal born from overconfidence.
So what do we do now?
We wait.
If price starts to reject from this 3355–3375 supply with bearish intent, we target the flip reentry zone at 3318–3328 — the previous CHoCH break and dynamic EMA cluster. That’s your first intraday long trigger if bulls want to come back strong.
If that breaks, next is the demand base at 3287–3267, the origin of this entire bullish move. Below that? Imbalance support near 3225 — the final line before structure shifts.
—
🟥 Valid Supply Zone → 3355–3375
🟥 Internal Supply Trap → 3398–3412
🟥 HTF Supply Trap → 3430–3439
🟫 Flip Reentry Zone → 3318–3328
🟦 Demand Base → 3287–3267
🟦 Imbalance Support → 3225–3205
—
This isn’t a breakout. It’s a build-up inside premium.
The smartest move today might be no move — until structure speaks.
—
Are you watching for the rejection? Or the breakout trap?
Let us know your bias below 👇🏼
Tap that ❤️ if this gave clarity, and follow GoldFxMinds to stay ahead of every key level — no noise, just structure.
—
With sniper calm and strategic clarity,
GoldFxMinds 💙
Disclosure: Analysis based on Trade Nation TradingView chart feed.

CAD_JPY BEARISH BREKAOUT|SHORT|
✅CAD_JPY broke the key structure level of 107.400
While trading in an local downtrend
Which makes me bearish
And I think that after the retest of the broken level is complete
A rebound and bearish continuation will follow
SHORT🔥
✅Like and subscribe to never miss a new idea!✅
Disclosure: I am part of Trade Nation's Influencer program and receive a monthly fee for using their TradingView charts in my analysis.
