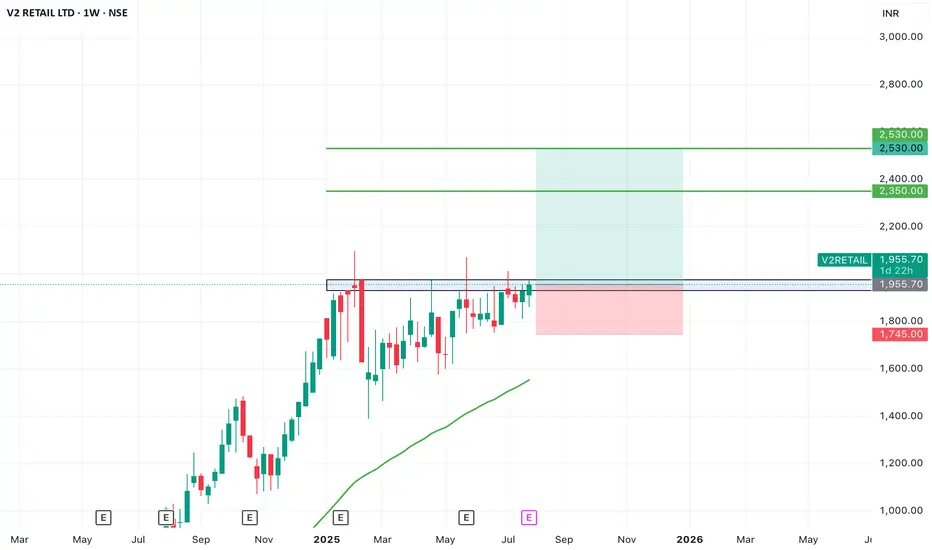
SWING IDEA - V2 RETAILV2 Retail , a small-cap value fashion retailer with a pan-India presence, is showing strong bullish momentum and a textbook swing trade setup backed by multiple breakout signals.
Reasons are listed below :
Breakout from a VCP (Volatility Contraction Pattern) – indicating accumulation and strength
Ascending triangle breakout – classic continuation pattern
Cleared major resistance zone, confirming bullish intent
Maintains a clear uptrend with higher highs and higher lows
Target - 2350 // 2530
Stoploss - weekly close below 1745
DISCLAIMER -
Decisions to buy, sell, hold or trade in securities, commodities and other investments involve risk and are best made based on the advice of qualified financial professionals. Any trading in securities or other investments involves a risk of substantial losses. The practice of "Day Trading" involves particularly high risks and can cause you to lose substantial sums of money. Before undertaking any trading program, you should consult a qualified financial professional. Please consider carefully whether such trading is suitable for you in light of your financial condition and ability to bear financial risks. Under no circumstances shall we be liable for any loss or damage you or anyone else incurs as a result of any trading or investment activity that you or anyone else engages in based on any information or material you receive through TradingView or our services.
@visionary.growth.insights
Breakout
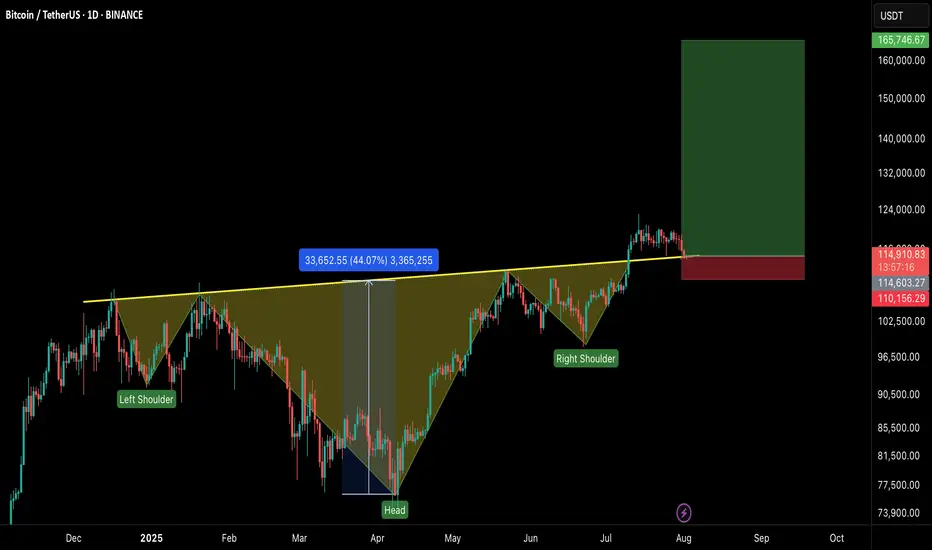
#BTCUSDT – Healthy Correction, Not the End!Bitcoin is currently experiencing a healthy pullback after an impressive run, testing the neckline of the Inverse Head & Shoulders breakout on the 1D timeframe.
🔹 Current Market View:
BTC is retesting the neckline of the IHS pattern, which now acts as a strong support zone.
Price is holding near $113K–$115K, which is crucial for maintaining bullish momentum.
This dip is a healthy correction, flushing out over-leveraged positions and preparing for the next leg up.
🔹 Key Levels:
Support Zone: $113,000 – $115,000
Immediate Resistance: $120,000 – $122,500
Breakout Target: $165,000+ on the next bullish wave
🔹 Market Sentiment:
Holding above the neckline keeps the bullish structure intact.
If the support holds, we can expect continuation to new highs once buying pressure returns.
A daily close below $112K would signal caution and delay the next rally.
💡 Tip: Don’t panic on these red candles. Healthy corrections are part of a sustainable uptrend.
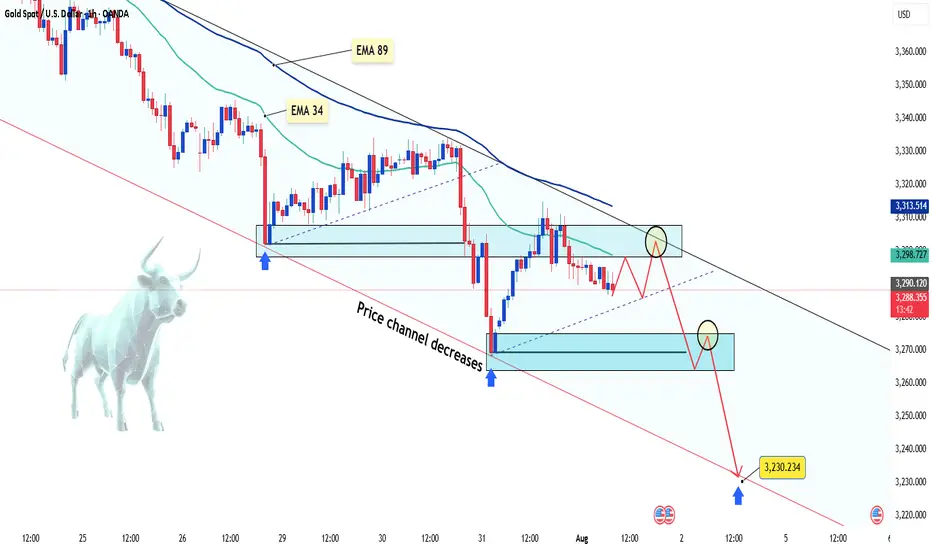
Gold keeps falling – is there more to come?Hello everyone, great to see you again!
Today, gold remains under pressure following a series of strong U.S. economic data releases, which have reinforced expectations that the Federal Reserve will keep interest rates elevated for longer. As a result, the U.S. dollar has strengthened, Treasury yields have climbed, and gold has lost its footing.
On the H1 chart, XAUUSD is clearly trading within a descending price channel. Both the EMA 34 and EMA 89 are acting as dynamic resistance zones. Recent attempts to rally have consistently failed at these levels, mirroring the bearish setup seen before July 29.
Currently, price is retesting a minor resistance area. If this retest fails, the next downside targets lie near 3,270 – and potentially down to 3,230 USD, which aligns with the lower boundary of the price channel.
From my perspective, the bearish momentum is likely to continue.
What about you? How do you think gold will close the day?
EUR_CHF WILL KEEP FALLING|SHORT|
✅EUR_CHF broke the key
Structure level of 0.9295
While trading in an local downtrend
Which makes me bearish
And I think that after the retest of the
Broken level is complete
A rebound and bearish
Continuation will follow
SHORT🔥
✅Like and subscribe to never miss a new idea!✅
Disclosure: I am part of Trade Nation's Influencer program and receive a monthly fee for using their TradingView charts in my analysis.

AUD-USD Will Go Down! Sell!
Hello,Traders!
AUD-USD is trading in a
Downtrend and the pair
Broke the key horizontal
Level of 0.6470 which is
Now a resistance then
Made a retest and a
Confident pullback which
Reinforces our bearish
Bias and makes us expect
A further bearish move down
Sell!
Comment and subscribe to help us grow!
Check out other forecasts below too!
Disclosure: I am part of Trade Nation's Influencer program and receive a monthly fee for using their TradingView charts in my analysis.

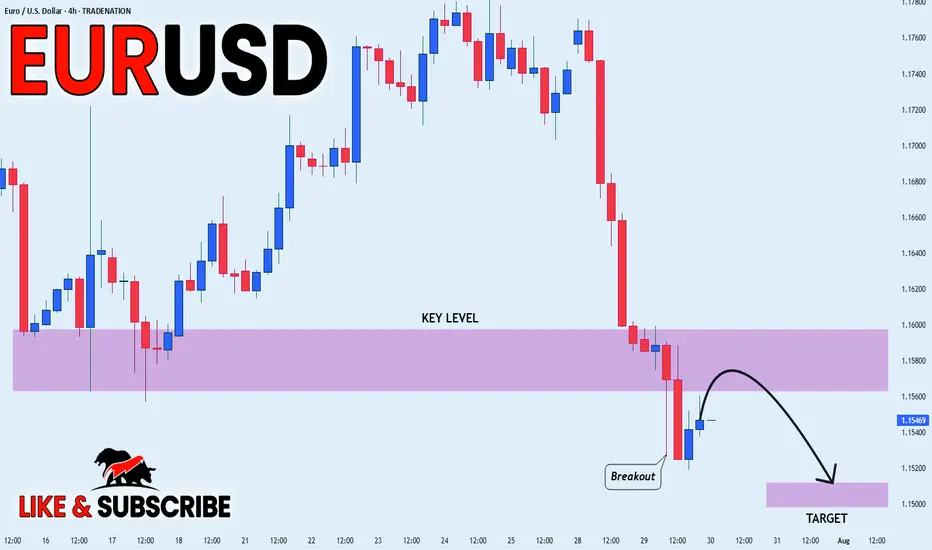
EUR-USD Bearish Breakout! Sell!
Hello,Traders!
EUR-USD made a bearish
Breakout of the key horizontal
Level of 1.1460 then made
A retest and a pullback so
We are bearish biased and
We will be expecting a
Further bearish continuation
Sell!
Comment and subscribe to help us grow!
Check out other forecasts below too!
Disclosure: I am part of Trade Nation's Influencer program and receive a monthly fee for using their TradingView charts in my analysis.

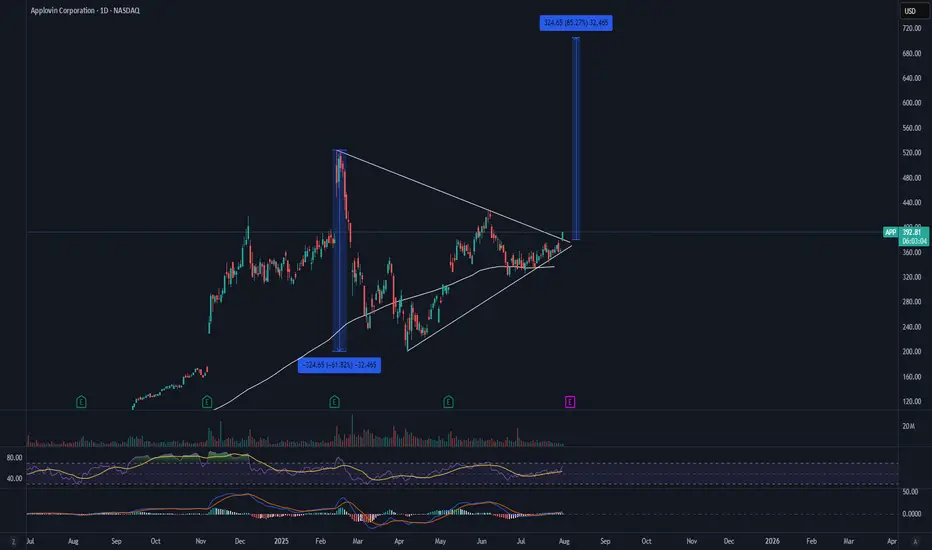
APP Earnings Triangle BreakoutWith APP breaking key resistance to the upside. There is a possibility for an aggressive move to the upside. This will NOT be a straight line up, but does show the possibility of the measured move. If I were to enter this, todays candle would be my entry and my stop loss would be an aggressive close back under the trendline.
Let's see what happens.
EURUSD – Retest Failed, Bearish Pressure RemainsHello, what’s your take on FX:EURUSD ?
After breaking the trendline, EURUSD attempted a retest but failed. The price is now hovering around 1.142, with selling pressure still evident.
This setup targets the 1.618 Fibonacci extension zone around 1.114. In the short term, a correction based on Dow Theory may unfold — the marked area could offer a perfect selling opportunity.
💡 Priority: SELL on RETEST – strict risk management with clear TP and SL.
Now it’s your turn — what’s your view? Share it in the comments below.
Good luck!

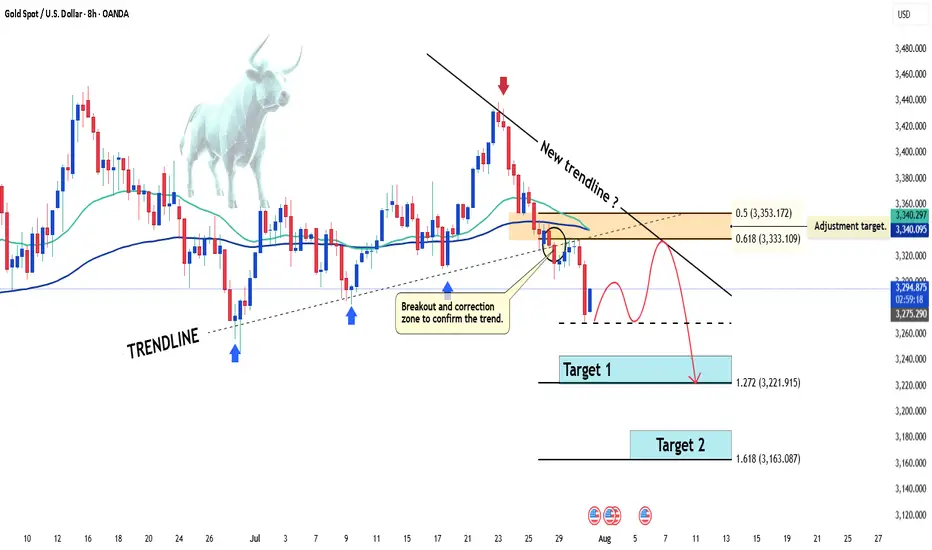
Gold price continues sharp declineHello everyone! Do you think gold will rise or fall? Let’s dive into the latest movements of this precious metal.
Just as we anticipated in yesterday’s strategy , gold has extended its downward move, with the bears firmly in control. The precious metal is currently trading around 3,290 USD, clearly signaling a short-term downtrend after breaking the ascending trendline that started in early July. Although there was a slight bounce, price remains capped below the key resistance zone of 3,333 – 3,350 USD, which coincides with the confluence of the 0.618 – 0.5 Fibonacci retracement and the EMA 34/89 — adding even more downside pressure.
The main reason behind this recent drop lies in the easing of trade tensions following the US-EU tariff agreement, which has significantly weakened gold’s safe-haven appeal. At the same time, the FOMC meeting yesterday failed to provide any bullish catalyst for gold. Even though the Fed is expected to keep rates unchanged, a single hawkish remark from Chair Powell was enough to intensify short-term selling pressure.
From a technical perspective, gold attempted to retest the broken trendline but failed, confirming the bearish structure. A new wave of correction could emerge soon, but the overall outlook remains tilted toward further downside.
My personal view:
Target 1 is at the 1.272 Fibonacci extension.
Target 2 lies at the 1.618 Fibonacci level — which could be the next destination.
And you — what do you think about this trendline break? Let’s discuss in the comments!
Gold's Strong Moves: Will the Bears Take Over?Hello everyone, Kevinn here!
Today, gold continues to experience significant fluctuations in the new week, with XAU/USD currently hovering around 3,325 USD. Amid the strong rise of the USD, the gold market has seen a sharp adjustment. However, the medium-term trend still seems to favor the bears.
The main reason for the turbulence in gold prices is the strengthening of the U.S. dollar, following strong economic news from the U.S. that points to a clear recovery. The stronger USD has made gold more expensive for international investors. Additionally, the market is awaiting further moves from the Fed regarding interest rate policies, which is limiting the flow of capital into gold.
Looking at the technical chart, we can see that although gold has shown a slight uptick, bearish pressures are still lurking. Indicators and patterns suggest that gold may break its rising price channel, with a high likelihood of further declines. The next support level could be around 3,310 USD, and if broken, gold may continue to fall toward 3,300 USD or lower.
Based on the signals from the chart, ENTRY 1 strategy would be to sell when the price breaks the upward channel. Additionally, if the price pulls back to the upper limit zone, ENTRY 2 could present another potential selling point.
For today's strategy, I expect gold to decrease. What do you think? Share your thoughts in the comments!

USOIL GROWTH AHEAD|
✅CRUDE OIL broke the key
Structure level of 69.50$
While trading in an local uptrend
Which makes me bullish biased
And I think that after the retest of the broken level is complete
A rebound and bullish continuation will follow
LONG🚀
✅Like and subscribe to never miss a new idea!✅
Disclosure: I am part of Trade Nation's Influencer program and receive a monthly fee for using their TradingView charts in my analysis.

EUR/USD Latest Update TodayHello everyone, what do you think about FX:EURUSD ?
EUR/USD previously broke the downward price channel, but failed to maintain the momentum, leading to a strong correction phase. Currently, the price is trading around 1.156 and testing key Fibonacci levels, with the 0.5 - 0.618 levels marked as potential reversal zones, as highlighted in the analysis.
With the current market sentiment, the strong recovery of the USD has been the main factor driving the EUR/USD movement in recent days. Positive economic data from the US has strengthened the US dollar, decreasing the appeal of gold and safe-haven assets like the EUR. Furthermore, expectations surrounding Fed policy decisions continue to add pressure on EUR/USD, with investors bracing for the possibility of the Fed maintaining high interest rates for a longer period.
For traders, it's clear that the bearish trend is in favor, as indicated by the EMA reversal. The Fibonacci levels 0.5 (1.164) and 0.618 (1.161) will be crucial zones, where reaction signals could open opportunities for SELL positions. The next target will be at Fib 1 and Fib 1.618.
That's my perspective and share, but what do you think about the current trend of EUR/USD? Leave your comments below this post!

USD-JPY Will Keep Growing! Buy!
Hello,Traders!
USD-JPY keep growing and
The pair made a bullish breakout
Of the key horizontal level
Of 149.181 and the pair is
Already retesting the new
Support and we will be
Expecting a further
Bullish move up
Sell!
Comment and subscribe to help us grow!
Check out other forecasts below too!
Disclosure: I am part of Trade Nation's Influencer program and receive a monthly fee for using their TradingView charts in my analysis.

AUD_USD BEARISH BREAKOUT|SHORT|
✅AUD_USD broke the key
Structure level of 0.6460
While trading in an local downtrend
Which makes me bearish
And I think that after the retest of
The broken level is complete
A bearish continuation will follow
SHORT🔥
✅Like and subscribe to never miss a new idea!✅
Disclosure: I am part of Trade Nation's Influencer program and receive a monthly fee for using their TradingView charts in my analysis.

AUD-JPY Bearish Breakout! Sell!
Hello,Traders!
AUD-JPY made a bearish
Breakout of the rising support
Line and we are bearish biased
So we will be expecting a
Further bearish move down
Sell!
Comment and subscribe to help us grow!
Check out other forecasts below too!
Disclosure: I am part of Trade Nation's Influencer program and receive a monthly fee for using their TradingView charts in my analysis.

USD_CAD BULLISH BREAKOUT|LONG|
✅USD_CAD is going up
Now and the pair made a bullish
Breakout of the key horizontal
Level of 1.3800 and the breakout
Is confirmed so we are bullish
Biased and we will be expecting
A further bullish move up
LONG🚀
✅Like and subscribe to never miss a new idea!✅
Disclosure: I am part of Trade Nation's Influencer program and receive a monthly fee for using their TradingView charts in my analysis.

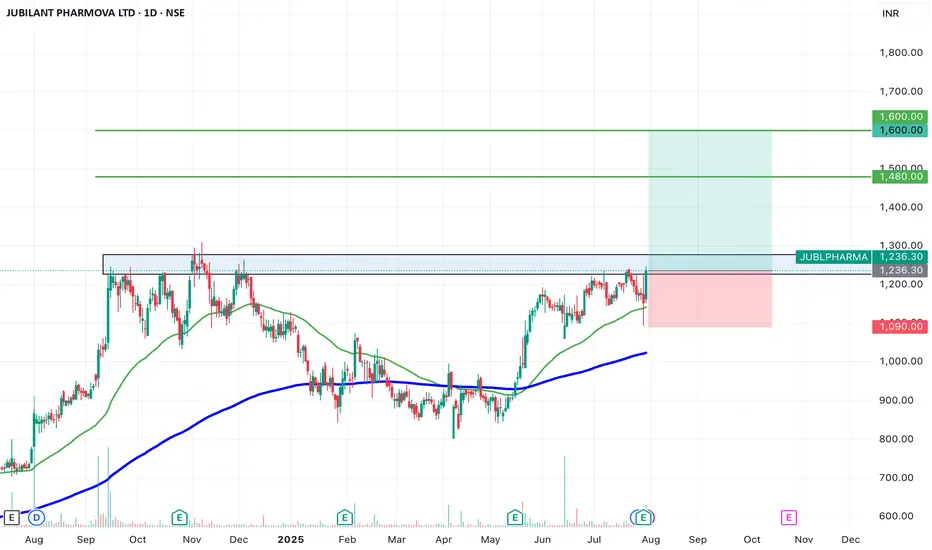
SWING IDEA - JUBILANT PHARMOVAJubilant Pharmova , a diversified pharmaceutical company focused on CRAMS and specialty pharma, is presenting a strong swing opportunity backed by a major pattern breakout and volume confirmation.
Reasons are listed below :
Breakout from an Inverted Head & Shoulders pattern after over a year of consolidation
Attempting breakout above 1250, a key resistance zone with multiple rejections in the past
Strong marubozu candle on the daily chart with a notable volume spike, signaling conviction
Trading near all-time highs, and comfortably above key EMAs, reinforcing trend strength
Target : 1480 // 1600
Stoploss : weekly close below 1090
DISCLAIMER -
Decisions to buy, sell, hold or trade in securities, commodities and other investments involve risk and are best made based on the advice of qualified financial professionals. Any trading in securities or other investments involves a risk of substantial losses. The practice of "Day Trading" involves particularly high risks and can cause you to lose substantial sums of money. Before undertaking any trading program, you should consult a qualified financial professional. Please consider carefully whether such trading is suitable for you in light of your financial condition and ability to bear financial risks. Under no circumstances shall we be liable for any loss or damage you or anyone else incurs as a result of any trading or investment activity that you or anyone else engages in based on any information or material you receive through TradingView or our services.
@visionary.growth.insights
MPWR 1D: shoulders are squared and the battery's still fullMonolithic Power Systems broke out of a long-term descending trendline after completing a clean inverse head and shoulders. Now the price is pulling back into the 705–688 zone — a textbook retest area that combines the neckline, the 0.705–0.79 Fib levels, and a major volume shelf. Add to that a golden cross (EMA50 crossing EMA200 from below) and we have a solid technical foundation for continuation. Volume on the pullback is low, indicating no panic, just rotation. If 688 holds, the next levels to watch are 755.66 and 952.17 — the latter being the 1.618 Fib extension. Tactical setup: look for a reversal signal between 705–688, with a stop just below 661. As long as price holds this zone, the bullish structure remains intact.
Fundamentally, MPWR remains one of the strongest names in the semiconductor space. With over $1.5B in annual revenue and industry-leading margins, the company continues to see strong demand from data center and EV sectors. In its latest report, management highlighted accelerating orders from Tier‑1 manufacturers. The balance sheet is clean, with zero debt, and ongoing buybacks provide downside support. In a sector full of volatility, MPWR stands out with both structural reliability and technical clarity - making it a strong candidate for long-term positioning.
If this textbook pattern plays out, the train’s just leaving the station. The best seat is usually the one taken before the doors close.

EUR/USD Slips Again – Just a Pullback or More to Come?Hey everyone! Great to have you back for another market chat today.
As of writing, EUR/USD remains under significant bearish pressure, currently trading near 1.154 — marking a rather gloomy start to the new trading week. The euro is clearly struggling to attract buying interest as traders reassess the ECB’s stance and digest the newly announced EU–US trade agreement. Meanwhile, the U.S. dollar is gaining momentum, flipping the trend unexpectedly.
From a technical perspective, EUR/USD is showing clear weakness. The pair has broken below both its rising wedge and previous uptrend line, with candles closing firmly lower — a strong sign that the bears are in control.
In my personal view, I expect EUR/USD to continue sliding toward the next two support zones, although a minor pullback could occur first as part of a typical correction.
But what do you think? Is this just a dip… or the start of something bigger for EUR/USD? Let me know your take in the comments!

GOLD BEARISH BIAS|SHORT|
✅GOLD broke the rising
Support line which is now
A resistance and the price
Is retesting the line now so
We are locally bearish biased
And we will be expecting a
Local move down
SHORT🔥
✅Like and subscribe to never miss a new idea!✅
Disclosure: I am part of Trade Nation's Influencer program and receive a monthly fee for using their TradingView charts in my analysis.

EUR_USD BEARISH BREAKOUT|SHORT|
✅EUR_USD broke the key
Structure level of 1.1580
While trading in an local downtrend
Which makes me bearish
And I think that after the retest of
The broken level is complete
A bearish continuation will follow
SHORT🔥
✅Like and subscribe to never miss a new idea!✅
Disclosure: I am part of Trade Nation's Influencer program and receive a monthly fee for using their TradingView charts in my analysis.
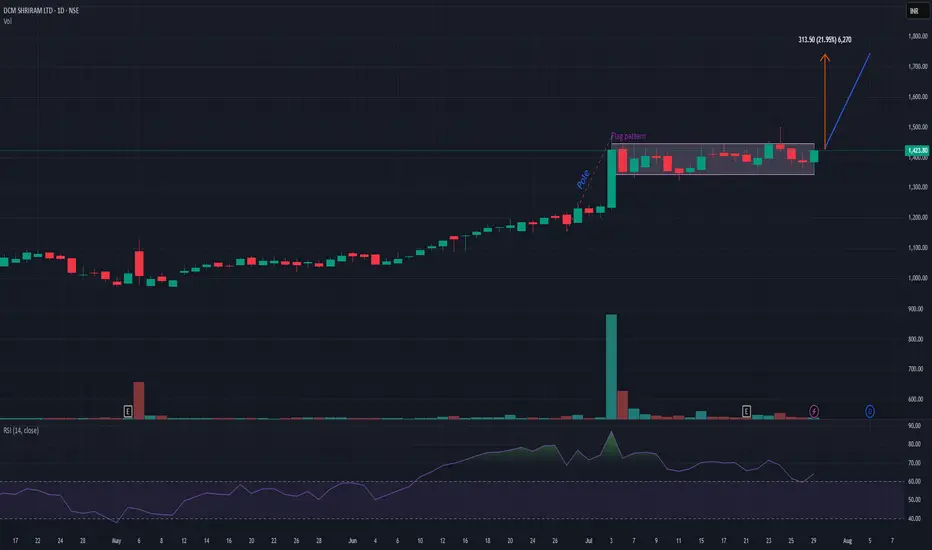
DCMSHRIRAMDCMSHRIRAM is on verge of flag pattern breakout provided that it closes above 1440 level. It has a potential to add up to 20-22% from this level. My view may change if it closes below 1350. Risk-reward is quite in favor. Keep it on radar.
XAUUSD under pressure – Is the downtrend just beginning?Hello everyone! What do you think about XAUUSD right now?
Yesterday, XAUUSD extended its decline and is currently trading around 3,315 USD.
The recent drop in gold prices was mainly triggered by a stronger US dollar, following a trade agreement between the US and the European Union (EU).
From a technical perspective, the short-term outlook shows the beginning of a new downtrend. Notably, we see a bearish crossover in the EMA 34 and 89, along with a break of the previous upward trendline—both reinforcing the current bearish momentum.
If there’s a pullback before the next leg down, the 0.5–0.618 Fibonacci retracement zone (which also aligns with resistance and the EMAs) will be a key area to watch. This could be an ideal level for potential trade setups.
Looking ahead, the next support target is around 3,300 USD. If that level breaks, gold might aim for the 32XX region.
Do you think XAUUSD will continue to fall? Drop your thoughts in the comments!
Wishing you successful and profitable trades!
