XYO Coin: Ready to Blast Past 3 Cents XYO is at a crossroads. If it breaks above 2.5 cents, we could see it soar to 3 cents, maybe even 10! But, if it dips under 1.9 cents, watch out for a fall.
Kris/Mindbloome Exchange
Trade Smarter Live Better
Breakout

ABT Strong Bullish Momentum – Move Toward $127.00 ExpectedNYSE:ABT is exhibiting strong bullish momentum, supported by a significant breakout above prior consolidation levels. The alignment of moving averages and the strength of recent price action suggest further upside potential, with the next logical target at $127.00.
The price has surged above key moving averages, including the 50 EMA, 100 EMA, and 200 EMA, all of which are trending upward. This confirms sustained momentum and further supports the bullish case.

JKCEMENTJKCEMENT given trendline breakout. It has posted v decent result above street's expectations. There is high probability that market may turn its trend which is in favor of new trend. Keep it on radar.

Earnings BreakoutI love the earnings season. During earnings season we see great setups that are tradable almost every day.
This is also the case today with RCL . Breakout under enormous volume and high relative strength. NYSE:RCL

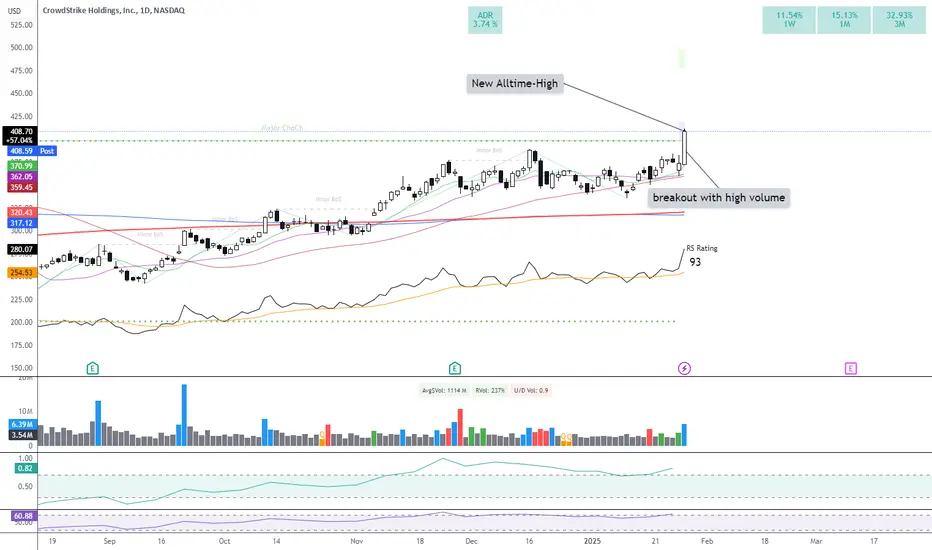
Beautiful breakout CRWD breaks perfectly out of a range and thus marks a new all-time high.
CRWD has been moving in a range with low volume since November 2024. Today is a perfect breakout. The breakout was confirmed under conspicuously high volume.
CRWD is also a top growth candidate in the hot cybersecurity sector. NASDAQ:CRWD
Xrp - Two Digits After The Breakout!Xrp ( CRYPTO:XRPUSD ) is about to break out:
Click chart above to see the detailed analysis👆🏻
Just three months ago we finally saw the overall expected symmetrical triangle parabolic breakout on Xrp. However Xrp is now retesting the previous horizontal all time high resistance. With all the bullish momentum a breakout is very possible, leading to two digits.
Levels to watch: $2.5, $10.0
Keep your long term vision,
Philip (BasicTrading)

AUD-CHF Bearish Breakout! Sell!
Hello,Traders!
AUD-CHF made a bearish
Breakout and the breakout
Is confirmed so we are
Bearish biased and we
Will be expecting a further
Bearish move down
Sell!
Comment and subscribe to help us grow!
Check out other forecasts below too!

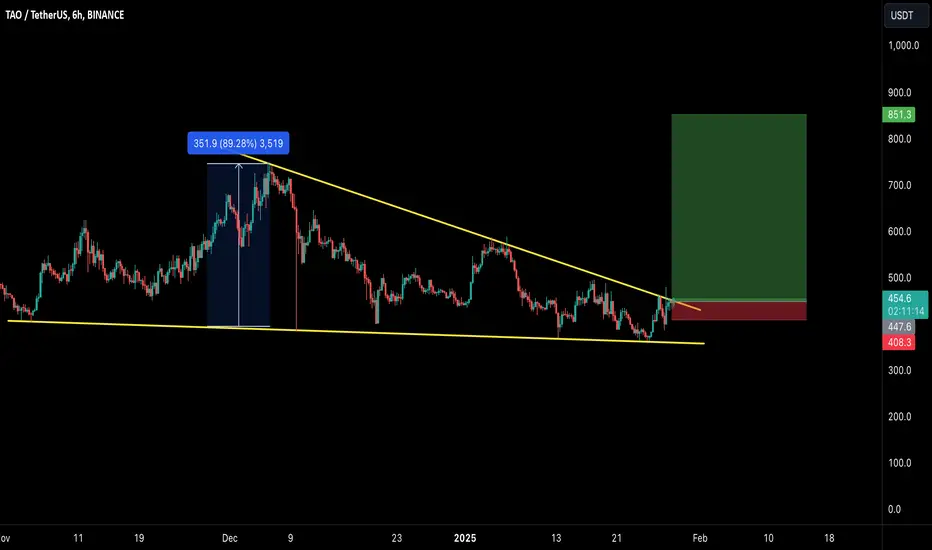
TAO/USDT: LOOKS READY TO GO ABOVE $800 MARK!!🚀 Hey Traders! Ready to Ride the TAO Wave? 👋
If this setup excites you, smash that 👍 and hit Follow for premium trade ideas that deliver real results! 💹🔥
TAO is looking primed for action! Breaking out of a falling wedge pattern on the 6-hour timeframe, it’s signaling a potential 80-90% upside move. 📈🔥
💡 Here’s the Plan:
📌 Entry Range: Current Market Price (CMP) and add more up to $430.
🎯 Targets:
Target 1: $530
Target 2: $620
Target 3: $710
Target 4: $850
🛡️ Stop Loss (SL): $400
⚙️ Leverage: Use low leverage (Max 5x) for a safer approach.
💬 What’s Your Take?
Are you bullish on TAO’s breakout potential? Drop your analysis, strategies, or predictions in the comments! Let’s crush this market and lock in those gains together! 💰🚀
SFP’s 43x Potential: Now the Time to Jump In?SEED_DONKEYDAN_MARKET_CAP:SFP has been forming a large symmetrical triangle since its listing. The market makers have deliberately used two stages over more than 1,000 days to consolidate.
▍Stage 1: Consolidation lasted from 05/2022 to 10/2023, spanning 521 days (marked with a blue box).
▍Stage 2: Consolidation started in 10/2023 (marked with a green box).
If we estimate 521 days for this stage as well, the time point will fall on 03/16/2025, which coincides with the end of the large symmetrical triangle.
Trading volume has been in a long-term downtrend. When volume shrinks to its limit, a clear breakout direction will emerge.
Coupled with the upcoming peak bull market phase, it's likely to break upwards.
There’s an old saying in investing: the longer the consolidation, the higher the breakout.
The key players have spent 2.5 years patiently consolidating, concentrating the tokens in strong hands.
When coins like this break out, they tend to "take the elevator" straight up, leaving no chance to buy in later.
Based on the expected breakout range of the triangle, the maximum potential upside is approximately 43x from the breakout point, targeting a price of $34.
I believe this is the perfect time to enter. What do you think?

Nice and simple Breakout on high relative strengthFTDR is a pattern breakout .
Even with the S&P falling more sharply and the NASDAQ rallying, FTDR is able to breakout from a base today on good, rising volume. A breakout under these market conditions shows high relative strength.
The fundamentals also look good. EPS increased significantly by almost 50% in each of the last four quarters.
The homebuilding sector has been stronger in recent months, although the Fed's decisions this week may have a greater impact here.
True leader! I'll buy it.

USOIL - Bearish Head and Shoulders Hello Traders !
The USOIL failed to break the resistance level (80.148 - 79.652).
The price formed a head and shoulders pattern.
Currently, The neckline is broken !
So, I expect a bearish move📉
________________
TARGET: 74.450🎯

EUR-CAD Strong Breakout! Buy!
Hello,Traders!
EUR-CAD is trading in an
Uptrend and the pair has
Made a bullish breakout of
The key horizontal level
Of 1.5041 and the breakout
Is confirmed so we are
Bullish biased and we
Will be expecting a further
Bullish move up
Buy!
Comment and subscribe to help us grow!
Check out other forecasts below too!

EURUSD -Bullish Falling WedgeHello Traders !
On the daily time frame,
The EURUSD price formed a falling wedge pattern.
At the moment, The lower high is broken !
So, I expect a bullish move📈
_______________
TARGET: 1.05630🎯

Could Cardano Bulls Push Past Pennant To $2 Resistance?!Cardano made an impressive 315% gain from the Low on Nov. 4th/5th @ .32 to the High on Dec. 3rd @ $1.32 following the Pro-Crypto Republican won Presidential Debate with not only BINANCE:ADAUSD seeing this kind of Rally but across the entire Crypto Market!
Since that High, Price on Cardano has slipped into a Consolidation of what seems to be a Pennant Pattern with Lower Highs working into Higher Lows.
Both Legs of this Triangle still need a 3rd Touch to Validate the Integrity and Existence of both Trend-lines. I would like to see Price make a 3rd Touch of the Rising Support around the ( .95 - .93 ) Range before moving back up to test the Falling Resistance.
If Bulls are able to gain enough Support from the Rising Support, it could be enough to give them momentum to make a Bullish Break to the Falling Resistance and based from the Pattern Statistics:
- Generate an Extension of the same size of Trend move that came prior to the formation of the Pattern called the "Flagpole" putting the Potential Extension of Price into the $2 Resistance Zone!
**Caution: Triangle Patterns are known to fail 1/3 of the time so a Bearish Breakdown of this pattern is still possible. Watch for False Breaks/Breakouts!

EUR-USD Strong Breakout! Buy!
Hello,Traders!
EUR-USD is trading in a
Local uptrend and the pair
Made a bullish breakout of
The key horizontal level
Of 1.0458 which reinforces
Our bullish bias and will
Be expecting a further
Bullish move up
Buy!
Comment and subscribe to help us grow!
Check out other forecasts below too!

TRUMP Breakout Alert: 100%+ Pump Potential from Falling Wedge!🚀 Hey Traders! 👋
If this setup gets you excited, smash that 👍 and hit Follow for trade ideas that actually deliver! 💹🔥
TRUMP is flashing bullish signals, breaking out of a falling wedge on the 1-hour chart. This setup screams potential for a 100%+ pump! 📈🔥
💡 Trade Setup:
📌 Entry Range: Current Market Price (CMP); add more on dips.
🎯 Targets:
Target 1: $31
Target 2: $42
Target 3: $51
Target 4: $60
🛡️ Stop Loss (SL): $24.80
⚙️ Leverage: Use low leverage (Max 5x) for safety.
💬 What’s Your Take?
Are you bullish on TRUMP’s breakout potential? Drop your analysis, predictions, or strategies in the comments below! Let’s crush this trade and lock in those gains! 💰🔥

Silver Charts Show Strength: What’s Next?Silver is maintaining a strong uptrend with higher highs and higher lows, supported by a rising trendline around $28-$30.
The upper trendline acts as resistance, and a breakout could drive further upside. However, a breakdown below the trendline may signal a potential correction.
More update are coming soon, Stay tuned!
Please support us with yours likes and comments.
THANK YOU

JUNO: Signs of a Trend Reversal? Key Indicators Align!It looks very much as though JUNO is showing promising signs of a trend reversal. What I mean by this is a breach of the upper trend line, which may only be a matter of time. We have a very strong indication from volume with the wonderful large green bars we're seeing, a 'pinch' in the Bollinger bands and a very tiny, but hugely important 'up ward pointing' signal line within the MACD. As always, use many indicators to create a 'cocktail' of methods which adds to the strength of your decision making. Due to low liquidity, I'm not going in. But, take don't fall foul to FOMO here. Just because it's seen a spike, it doesn't mean it's going to break out of the channel and continue up. Good luck. Follow for more.

AUD_USD LOCAL LONG|
✅AUD_USD made a bullish
Breakout of the key horizontal
Level of 0.629 so we are
Locally bullish biased and
We will be expecting a
Further bullish move up
LONG🚀
✅Like and subscribe to never miss a new idea!✅

Historic Resistance at $264: Will SOLUSD Flip It to Support?
COINBASE:SOLUSD is currently testing the key resistance level at $264.53, which has historically acted as a significant barrier. The EMA ribbon remains bullish, with the price trading consistently above it, indicating strong upward momentum. The ascending trendline, which has provided reliable support in the past, continues to guide the price action upward.
A divergence on the TSI is evident, with the oscillator previously trending lower while the price maintained its upward trajectory. This suggests that the bulls are gaining strength and exerting pressure on the resistance. The TSI has recently crossed above the zero line, confirming a bullish momentum shift.
The Signal Builder has provided upward signals recently, aligning with the current market structure. A breakout accompanied by a strong candle close above the resistance could flip this level into support, opening the door for potential new all-time highs.
👨🏻💻💭 What are your thoughts on SOLUSD's potential breakout? Could this lead to a rally beyond the resistance? Share your perspective!
__
The information and publications within the 3Commas TradingView account are not meant to be and do not constitute financial, investment, trading, or other types of advice or recommendations supplied or endorsed by 3Commas and any of the parties acting on behalf of 3Commas, including its employees, contractors, ambassadors, etc.

USOIL BULL Triangle The oil chart is showcasing a large triangle pattern within a smaller triangle, and the breakout of the smaller triangle to the upside strongly suggests that the larger triangle will also be broken. This breakout signals the potential to target significantly higher levels.
Additionally, the bottom has been tested approximately four times, with the last test clearing out all liquidity. Now, the chart appears to be gearing up for a major upward move after a prolonged accumulation phase.
As for my perspective, I’m betting on oil’s rise rather than its decline, even though the current triangle formation is typically a bearish (descending) triangle.
The second entry opportunity will present itself after the larger triangle is broken and confirmed through a retest.
Note: I don't care about the count if it right or not don't comment on that please

EUR_JPY GROWTH AHEAD|LONG|
✅EUR_JPY is trading in a
Local uptrend and the
Pair made a bullish breakout
Of the key horizontal level of 163.130
And the breakout is confirmed
So we are bullish biased
And we will be expecting
A further move up
LONG🚀
✅Like and subscribe to never miss a new idea!✅

EUR_USD BULLISH BREAKOUT|LONG|
✅EUR_USD made a bullish
Breakout of the key horizontal
Level of 1.0460 and the breakout
Is confirmed so we are bullish
Biased and we will be expecting
A further bullish move up
LONG🚀
✅Like and subscribe to never miss a new idea!✅
