Gold Under Pressure – Temporary Pullback or Start of a DowntrendHello everyone, great to see you again.
Today, let’s focus on the bearish factors surrounding gold. At the time of writing, gold is trading around 3,331 USD, down 50 pips on the day, continuing its downward correction since the end of last week.
Within just a few days, gold has plunged from its peak of 3,433 USD—losing nearly 100 USD per ounce.
This sharp drop is largely driven by profit-taking and market anticipation ahead of key economic data next week, including U.S. interest rate decisions, inflation, and job reports.
This week is packed with critical updates: growth figures, inflation stats, employment numbers, and monetary policy decisions from major central banks—all of which could significantly impact gold’s next move.
According to a recent survey, 36% of analysts expect gold to fall further, while retail investors remain optimistic about a rebound.
For now, the market is clearly in a correction phase. Caution is advised.
What do you think—will gold bounce back or continue to drop?
Breakout

CRUDE OIL Bullish Continuation! Buy!
Hello,Traders!
CRUDE OIL made a rebound
From the support just as
I predicted and the price
Went further still and broke
The key horizontal level
Of 66.50$ and the breakout
Is confirmed so we are
Bullish biased and we will be
Expecting a further bullish
Move up!
Buy!
Comment and subscribe to help us grow!
Check out other forecasts below too!
Disclosure: I am part of Trade Nation's Influencer program and receive a monthly fee for using their TradingView charts in my analysis.

GOLD Epic Trendline Breakout! Sell!
Hello,Traders!
GOLD was trading along
A long-term trend-line but
It is broken now and the
Breakout is confirmed so
We are bearish biased now
And we will be expecting a
Further bearish move down
Sell!
Comment and subscribe to help us grow!
Check out other forecasts below too!
Disclosure: I am part of Trade Nation's Influencer program and receive a monthly fee for using their TradingView charts in my analysis.

GBP_USD BEARISH BREAKOUT|SHORT|
✅GBP_USD is going down currently
As the pair broke the key structure level of 1.3380
Which is now a resistance, and after the pullback
And retest, I think the price will go further down
SHORT🔥
✅Like and subscribe to never miss a new idea!✅
Disclosure: I am part of Trade Nation's Influencer program and receive a monthly fee for using their TradingView charts in my analysis.

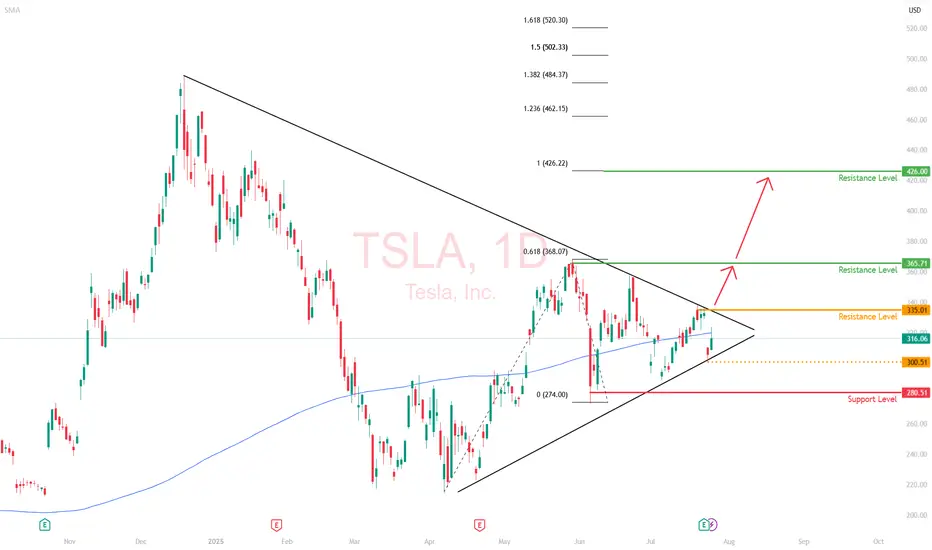
Tesla (TSLA) | Short-Term Compression, Long-Term ExTesla’s daily chart is coiled, with price currently trading at $316, sitting along the 200-day moving average. This looks like a consolidation phase with significant moves building up.
Price Action Snapshot
TSLA sold off last week, rejecting the $335 resistance level before finding footing around $300. The previous range of $280 and $365 is now tightening.
Immediate resistance sits at $335 with a clean breakout above that zone likely triggering momentum back toward the upper range of $365.
The recent drop does not seem like a capitulation move; it's likely institutional redistribution. Smart money is repositioning, not exiting.
Market Is Focused on the Wrong Data
Tesla’s Q2 earnings were objectively weak. Revenue fell 12%, deliveries dropped, and operating margins got clipped.
But this correction isn't all about fundamentals. It is about the market adjusting to a company evolving beyond traditional valuation models.
While most investors are trying to value Tesla like a car company, it’s spending this entire phase retooling itself into an AI and autonomy-first enterprise. That transition doesn't show up in EPS yet (but it will).
The Bigger Picture is Being Missed
The robotaxi rollout in Austin is live. Expansion into California, Phoenix, and Florida is on the roadmap.
Tesla is building a vertically integrated, owner-driven ride-hailing model that could eventually bypass both Uber and legacy OEMs entirely.
Optimus is no longer a lab prototype—it’s moving toward scalable production by 2026.
If Tesla even partially succeeds in general-purpose robotics, it will unlock a Technology Acceptance Model (TAM) that dwarfs the current EV narrative .
Daily Technical Outlook
We’re currently in a bullish compression, with higher lows forming against the resistance area of $365. If $280 holds and the price continues to grind within this wedge, it sets up a volatility breakout scenario.
The breakout level to watch is $335. A daily close above that reopens $365. And beyond that, the resistance level is at $426.
My View
Tesla is compressing, both in price and narrative.
The long game is quietly coming into focus, where the risk/reward skews asymmetrically in favor of the upside.
This daily compression won’t last forever, and when it resolves, the move will likely be outsized.
Options Blueprint Series [Intermediate]: Gold Triangle Trap PlayGold’s Volatility Decline Meets a Classic Chart Setup
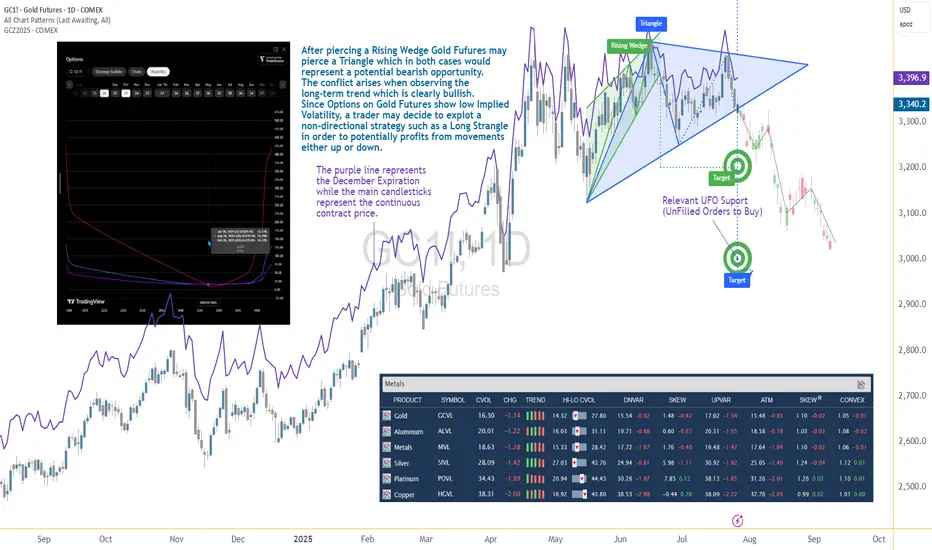
Gold Futures have been steadily declining after piercing a Rising Wedge on June 20. Now, the market structure reveals the formation of a Triangle pattern nearing its apex — a point often associated with imminent breakouts. While this setup typically signals a continuation or reversal, the direction remains uncertain, and the conflict grows when juxtaposed with the longer-term bullish trajectory Gold has displayed since 2022.
The resulting dilemma for traders is clear: follow the short-term bearish patterns, or respect the dominant uptrend? In situations like these, a non-directional approach may help tackle the uncertainty while defining the risk. This is where a Long Strangle options strategy becomes highly relevant.
Low Volatility Sets the Stage for an Options Play
According to the CME Group’s CVOL Index, Gold’s implied volatility currently trades near the bottom of its 1-year range — hovering just above 14.32, with a 12-month high around 27.80. Historically, such low readings in implied volatility are uncommon and often precede sharp price movements. For options traders, this backdrop suggests one thing: options are potentially underpriced.
Additionally, an IV analysis on the December options chain reveals even more favorable pricing conditions for longer-dated expirations. This creates a compelling opportunity to position using a strategy that benefits from volatility expansion and directional movement.
Structuring the Long Strangle on Gold Futures
A Long Strangle involves buying an Out-of-the-Money (OTM) Call and an OTM Put with the same expiration. The trader benefits if the underlying asset makes a sizable move in either direction before expiration — ideal for a breakout scenario from a compressing Triangle pattern.
In this case, the trade setup uses:
Long 3345 Put (Oct 28 expiration)
Long 3440 Call (Oct 28 expiration)
With Gold Futures (Futures December Expiration) currently trading near $3,392.5, this strangle places both legs approximately 45–50 points away from the current price. The total cost of the strangle is 173.73 points, which defines the maximum risk on the trade.
This structure allows participation in a directional move while remaining neutral on which direction that move may be.
Technical Backdrop and Support Zones
The confluence of chart patterns adds weight to this setup. The initial breakdown from the Rising Wedge in June signaled weakness, and now the Triangle’s potential imminent resolution may extend that move. However, technical traders must remain alert to a false breakdown scenario — especially in trending assets like Gold.
Buy Orders below current price levels show significant buying interest near 3,037.9 (UFO Support), suggesting that if price drops, it may find support and rebound sharply. This adds further justification for a Long Strangle — the market may fall quickly toward that zone or fail and reverse just as violently.
Gold Futures and Micro Gold Futures Contract Specs and Margin Details
Understanding the product’s specifications is crucial before engaging in any options strategy:
🔸 Gold Futures (GC)
Contract Size: 100 troy ounces
Tick Size: 0.10 = $10 per tick
Initial Margin: ~$15,000 (varies by broker and volatility)
🔸 Micro Gold Futures (MGC)
Contract Size: 10 troy ounces
Tick Size: 0.10 = $1 per tick
Initial Margin: ~$1,500
The options strategy discussed here is based on the standard Gold Futures (GC), but micro-sized versions could be explored by traders with lower capital exposure preferences.
The Trade Plan: Long Strangle on Gold Futures
Here's how the trade comes together:
Strategy: Long Strangle using Gold Futures options
Direction: Non-directional
Instruments:
Buy 3440 Call (Oct 28)
Buy 3345 Put (Oct 28)
Premium Paid: $173.73 (per full-size GC contract)
Max Risk: Limited to premium paid
Breakeven Points on Expiration:
Upper Breakeven: 3440 + 1.7373 = 3613.73
Lower Breakeven: 3345 – 1.7373 = 3171.27
Reward Potential: Unlimited above breakeven on the upside, substantial below breakeven on the downside
R/R Profile: Defined risk, asymmetric potential reward
This setup thrives on movement. Whether Gold rallies or plunges, the trader benefits if price breaks and sustains beyond breakeven levels by expiration.
Risk Management Matters More Than Ever
The strength of a Long Strangle lies in its predefined risk and unlimited reward potential, but that doesn’t mean the position is immune to pitfalls. Movement is key — and time decay (theta) begins to erode the premium paid with each passing day.
Here are a few key considerations:
Stop-loss is optional, as max loss is predefined.
Precise entry timing increases the likelihood of capturing breakout moves before theta becomes too damaging. Same for exit.
Strike selection should always balance affordability and distance to breakeven.
Avoid overexposure, especially in low volatility environments that can lull traders into overtrading due to the potentially “cheap” options.
Using strategies like this within a broader portfolio should always come with well-structured risk limits and position sizing protocols.
When charting futures, the data provided could be delayed. Traders working with the ticker symbols discussed in this idea may prefer to use CME Group real-time data plan on TradingView: www.tradingview.com - This consideration is particularly important for shorter-term traders, whereas it may be less critical for those focused on longer-term trading strategies.
General Disclaimer:
The trade ideas presented herein are solely for illustrative purposes forming a part of a case study intended to demonstrate key principles in risk management within the context of the specific market scenarios discussed. These ideas are not to be interpreted as investment recommendations or financial advice. They do not endorse or promote any specific trading strategies, financial products, or services. The information provided is based on data believed to be reliable; however, its accuracy or completeness cannot be guaranteed. Trading in financial markets involves risks, including the potential loss of principal. Each individual should conduct their own research and consult with professional financial advisors before making any investment decisions. The author or publisher of this content bears no responsibility for any actions taken based on the information provided or for any resultant financial or other losses.
Gold under pressure as USD strengthensGold is facing significant selling pressure as the US dollar regains momentum. Currently, XAU/USD is trading near $3,337, down over $31 from the session high, and pressing directly against the ascending trendline.
The stronger USD is making gold—an asset that yields no interest—less attractive to investors. If this dollar strength continues, the likelihood of a trendline break and further downside is very high.
On the economic front, U.S. jobless claims have fallen to their lowest level in three months, signaling a resilient labor market despite sluggish hiring. This stable jobs data is expected to support the Fed’s decision to hold interest rates steady at 4.25–4.50% in the upcoming policy meeting, even amid rising inflation pressure driven by President Donald Trump’s tariff policies.
At this moment, sellers are in control. Traders should closely watch upcoming support zones and trading volume to spot reasonable entry points.
Good luck!

SEI — Breakout & D1 OB Target1. Support 0.33–0.36 holding
2. Entry after SR breakout
3. Target: D1 OB 0.47–0.54
4. Stop below 0.33

NXT (Long) - Clean energy player with even cleaner financialsLet's preamble with what the company actually does (as I imagine a lot of traders trade without even bothering... understandably). In short, Nextracker operates in the solar energy space where it is a leader in providing energy output optimization solutions, i.e. mechanical systems that rotate solar panels to follow the sun, along with software (TrueCapture) that uses sensors and machine learning to fine-tune positioning in real time.
Fundamentals
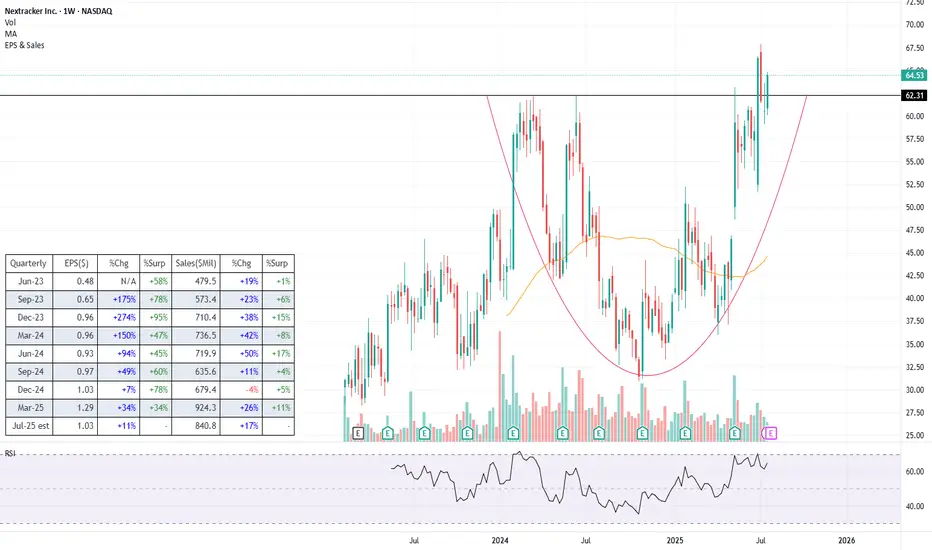
NASDAQ:NXT has been growing very strongly in recent years (see the table) despite the numerous hiccups this space has seen since 2022. There is also a backlog of $4.5bn , giving us clear visibility into the next year. Profitability is strong with earnings growth even outpacing revenue growth, showing strong operating leverage .
This all comes on the back of a relatively cheap valuation , with P/E of just below 18, which is significantly lower than some of its competitors like NYSE:NVT at 52, and NYSE:RRX at 43. No clear reason for why the markets are discounting the stock.
The balance sheet is rock solid , with no debt and $766m in cash. Moreover, free cash flow is plentiful with the firm most recently generating $622m in FCF.
Overall, the company is growing, has strong financials and is cheaply valued compared to its competitors - the kind of smoothie I usually look for. One obvious risk is policy , given that the current administration doesn't really see eye to eye with renewables and two thirds of NXT's revenue still comes from the US.
Technicals
Just breaking into an all-time high is a nice-to-have advantage when entering a new trade. The stock is breaking out from a decent, almost year-and-half long base , though I would prefer the base to be a tad more prolongated.
The stock broke the ATH on higher volume, pulled back to around the breakout point and is currently establishing the next leg higher
The price is some distance away from its moving averages, so there is a chance that there still might be some more consolidation around this level before we proceed higher
Trade
Main caveat is that the stock is about to release its earnings on Tuesday , so naturally it is a slight gamble to buy ahead of it. I decided to jump in beforehand just because I have strong conviction (and I love to punch the wall when I always get it wrong), but I would advise others to first wait on the results as a potential catalyst.
For gamblers like myself, the ATH breakout point likely serves as the best possible stoploss (black line).
One more reason why these earnings in particular could be even more of a gamble is that the BBB bill was passed since the last earnings, so if the executives decide to sprinkle the release with some not-so-positive comments regarding that, it could spook investors.
Follow me for more analysis & Feel free to ask any questions you have, I am happy to help
If you like my content, please leave a like, comment or a donation , it motivates me to keep producing ideas, thank you :)
EUR-JPY Local Long! Buy!
Hello,Traders!
EUR-JPY is trading in an
Uptrend and the pair made
A breakout, a retest and
A bullish rebound from the
Horizontal support of 173.200
So we are bullish biased and
We will be expecting a
Further bullish move up
On Monday!
Buy!
Comment and subscribe to help us grow!
Check out other forecasts below too!
Disclosure: I am part of Trade Nation's Influencer program and receive a monthly fee for using their TradingView charts in my analysis.

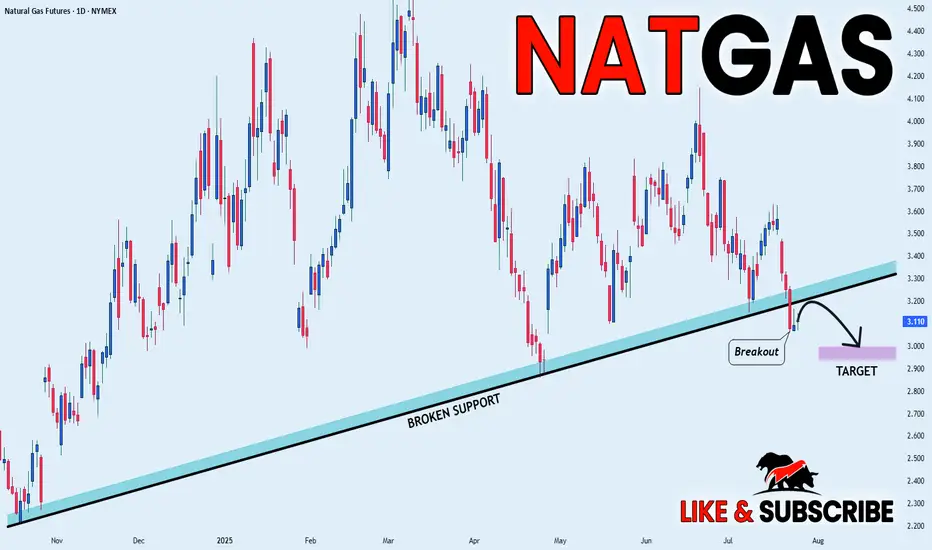
NATGAS BEARISH BREAKOUT|SHORT|
✅NATGAS broke the rising support
While trading in an local downtrend
Which makes me bearish
And I think that after the retest of the broken line is complete
A rebound and bearish continuation will follow
SHORT🔥
✅Like and subscribe to never miss a new idea!✅
Disclosure: I am part of Trade Nation's Influencer program and receive a monthly fee for using their TradingView charts in my analysis.
GBP-NZD Will Keep Falling! Sell!
Hello,Traders!
GBP-NZD keeps falling down
And the pair made a strong
Bearish breakout of the key
Horizontal key level of 2.2400
And the breakout is confirmed
So we are bearish biased and
We will be expecting a further
Bearish move down on Monday
Sell!
Comment and subscribe to help us grow!
Check out other forecasts below too!
Disclosure: I am part of Trade Nation's Influencer program and receive a monthly fee for using their TradingView charts in my analysis.

SoFi's Surge: Unveiling 2023 and What Lies Ahead in 2024Technical Analysis Overview
Current Price : $10.34, a 3.77% increase.
Weekly Trend : Showing a positive trend with a 5.35% increase over the last five days.
1-Month Trend : A significant increase of 51.96%, indicating strong bullish sentiment.
6-Month and Yearly Trends : A 17.04% increase over the last six months and a 124.51% increase year to date, highlighting a robust bullish trend.
Advanced Technical Indicators
Relative Strength Index (RSI) : 70.41 - Indicating that SOFI is nearing overbought territory, which could lead to a potential reversal or consolidation in the short term.
Moving Average Convergence Divergence (MACD) : 0.63 - Suggesting bullish momentum, indicating a strong buying trend.
Other Indicators : STOCH (83.28), STOCHRSI (84.02), ADX (37.09), Williams %R (-8.57), CCI (104.63), ATR (0.46), Ultimate Oscillator (54.76), and ROC (24.66) all contribute to a picture of current bullish momentum but with potential for short-term volatility or pullback.
Market Sentiment and External Factors
Market Capitalization : $9.904B USD.
Trading Volume Analysis : A high trading volume of 35,199,288, suggesting active market participation and interest in the stock.
Recent News Coverage Impacting SOFI
Bullish Outlook for 2024 : Analysts predict SOFI stock could continue its rally in the new year, benefiting from expected interest-rate cuts. A notable analyst has set a high price target of $14 for SOFI stock, implying significant upside potential ( InvestorPlace ).
Focus on Non-Lending Businesses : Analysts appreciate SoFi's shift towards non-lending businesses, improving earnings quality despite a higher-for-longer interest-rate policy.
Central Bank Policy Changes : Potential interest rate cuts in 2024 could benefit SoFi's lending business, as lower rates tend to spur borrowing and lending activity.
Conclusion
SOFI's stock shows strong bullish signs in the medium to long term, but the current overbought condition warrants caution for short-term traders.
The recent news and analyst predictions provide a positive outlook for 2024, making SOFI an interesting stock for both traders and long-term investors.

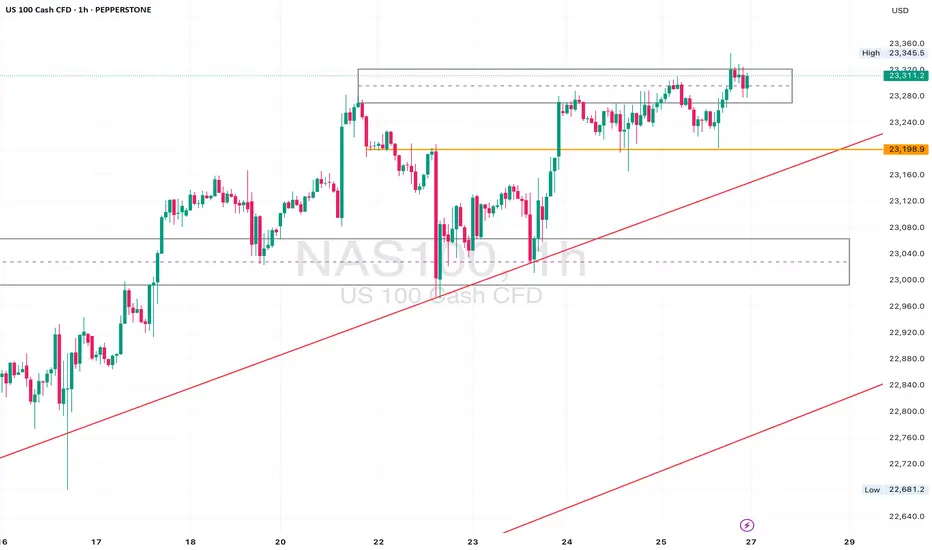
NAS100 Retesting Breakout – Eyes on 23170 for Bullish PushDaily Analysis:
Price is testing the upper boundary of the long-term ascending channel. Structure is still bullish with no major breaks of support. If momentum holds, we could extend toward the channel top.
4H Analysis:
Retesting breakout structure. Support is forming around 23000–23050. Bullish momentum remains valid unless price closes below this zone.
1H Analysis:
Micro-breakout confirmed with bullish impulse above 23120. If 23170 holds, continuation toward 23280–23320 is likely.
Confirmation & Entry:
Watch for continuation above 23170. SL below 23080. TP: 23280+
Use caution if 23000 breaks — this would weaken short-term bias.
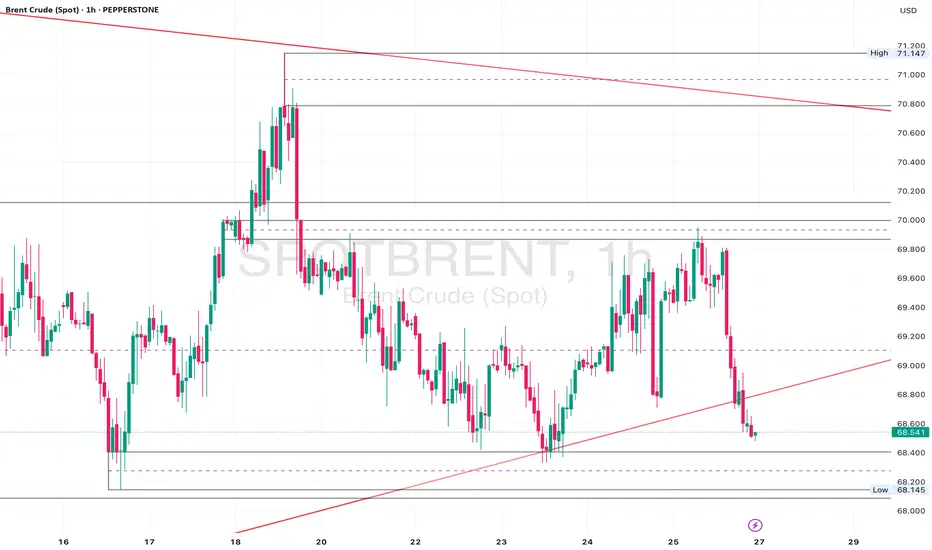
Brent Crude Sitting at Key Support – 69.20 Hold for a Rebound?Daily Analysis:
Price is holding above the ascending trendline and forming higher lows. Multiple rejections from the 68.00 region suggest strong demand. As long as we remain above the trendline, bulls stay in control.
4H Analysis:
Pullback after rejecting 71.00. Now sitting inside the 69.60–69.20 demand area. Bullish channel is still valid unless we break below 68.50.
1H Analysis:
Price broke the rising channel but is now hovering near key support. Bullish re-entry possible if lower timeframe aligns around 69.60.
Confirmation & Entry:
If we see bullish engulfing or pin bar at 69.60–69.20, this could signal a long setup back to 71.00. Invalidated on clean break below 68.50.
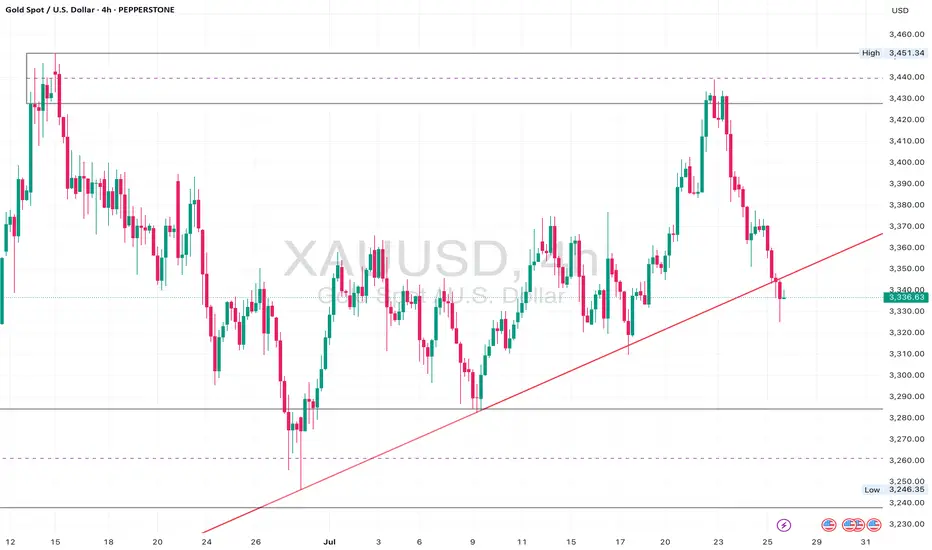
Gold Approaching 3365 Breakout: Bullish Continuation Above TrendDaily Analysis:
Price is respecting the long-term trendline support and still holding firmly above the 3300 region. Bulls are defending structure with a clean series of higher lows. No major change in trend as long as price remains above 3246.
4H Analysis:
Price is consolidating above the trendline and building structure around 3350. A clean break and close above 3365 could ignite a push toward the 3450 supply zone.
1H Analysis:
Descending trendline break confirmed with bullish closure. Retest holding well above 3350. If structure remains intact, next short-term target is 3375–3390.
Confirmation & Entry:
Break and close above 3365 with strong bullish candle = confirmation. Optional entry on 3350–3355 retest. Targets: 3390, 3450.
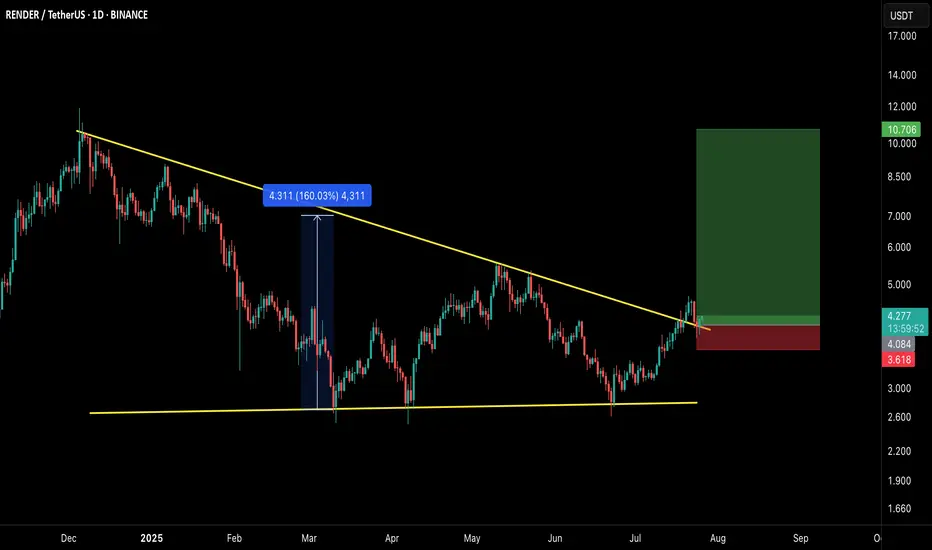
$RNDR/USDT – Breakout Setup Alert!RNDR has officially broken out of the long-standing descending trendline, confirming a bullish reversal structure. This breakout comes after a sustained consolidation phase and successful retest, indicating strength in buyer momentum.
🔍 Technical Breakdown:
Descending triangle breakout confirmed
Previous breakout from similar structure yielded a massive 160% rally
Currently retesting the breakout zone, providing a high R:R long entry opportunity
Clear invalidation point below the recent local support
🟢 LONG Setup:
Entry Zone: $4.00–$4.30
Stop Loss: $3.60 (below breakout retest & structure)
Targets:
TP1: $6.00
TP2: $8.00
TP3: $10.70+ (full breakout projection zone)
🧠 Strategy Insight:
This setup aligns with a broader bullish market structure across multiple altcoins. If momentum continues, this could mirror the prior explosive leg. Always manage risk accordingly.
⚠️ This is not financial advice. DYOR and use proper risk management.
💬 Let me know your thoughts or if you’re riding this wave!
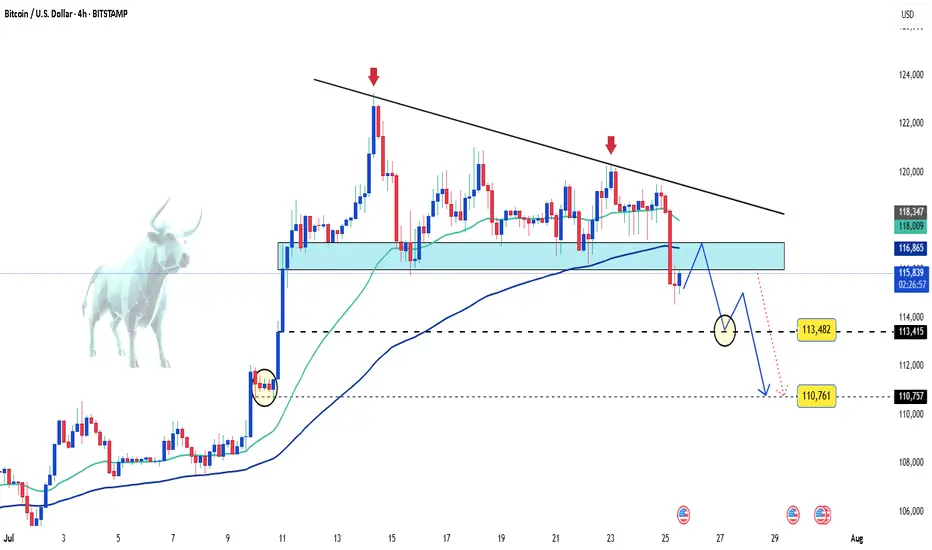
Bitcoin on the edge – Is a sharp drop coming?Bitcoin is keeping investors on edge as price action remains volatile and primed for an explosive move once news or capital flows ignite the market.
🌍 Latest market updates:
– Whales are back in accumulation mode, with on-chain data showing large wallets growing rapidly.
– The U.S. government has just transferred a significant amount of BTC to exchanges — is a dump coming?
– U.S. spot Bitcoin ETFs are witnessing record inflows after CPI came in lower than expected, fueling hopes that the Fed will pause further rate hikes this year.
📉 Technical outlook:
– On the H4 chart, BTC formed a tightening wedge pattern, which has now broken to the downside.
– A steep drop toward the 113,000 to 110,000 USD zone is entirely possible.
This looks like a classic break-retest setup — a golden window for strategic entries. If sell volume surges, it could be the perfect moment for bears to strike.
Stay sharp — and good luck!
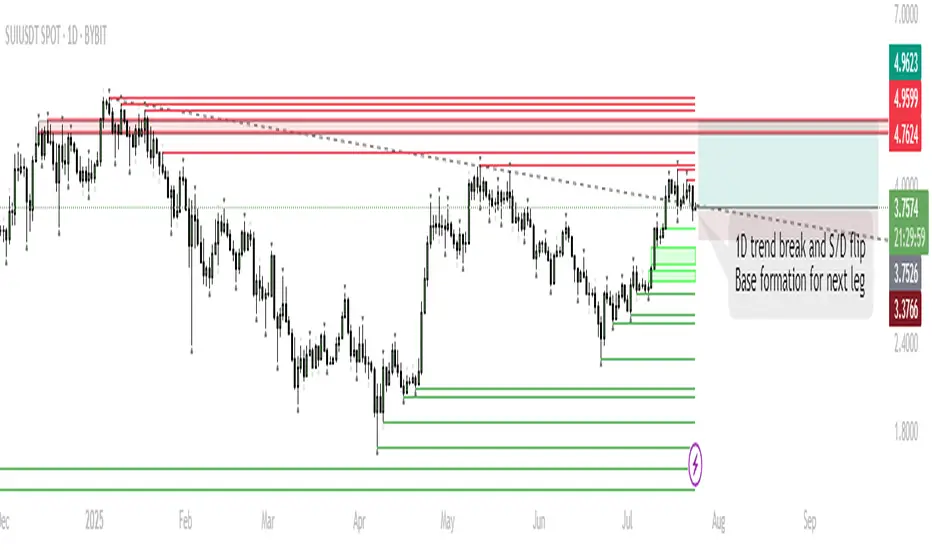
SUI – Base Formation for Next Leg HigherTrend Shift:
SUI has broken the 1D downtrend and is now consolidating above a key supply/demand zone, suggesting accumulation.
Short-Term Range:
Expect ranging/chop as price tests acceptance above broken resistance. This phase could last up to a week.
Trigger for Next Move:
Sustained closes above $4.0 will signal buyers are in control, opening the way for a move higher.
Targets:
If the base holds and SUI establishes above resistance, the next push is toward $5.10–$5.40 (previous highs/ATH zone).
Invalidation:
A sustained move below $3.37 would invalidate the bullish base thesis and open the door for deeper retrace.
SUI has flipped its 1D trend and is now consolidating above a key S/D level. Historically, such consolidations above reclaimed resistance often precede strong trend continuation. While a short-term range is likely as the market digests recent gains, the structure favors an eventual push toward previous highs and potentially new ATHs in August. Patience during this ranging phase is key; the setup remains bullish unless price falls back below $3.37.
GBP_NZD BEARISH BREAKOUT|SHORT|
✅GBP_NZD is going down currently
As the pair broke the key structure level of 2.2400
Which is now a resistance, and after the pullback
And retest, I think the price will go further down
SHORT🔥
✅Like and subscribe to never miss a new idea!✅
Disclosure: I am part of Trade Nation's Influencer program and receive a monthly fee for using their TradingView charts in my analysis.

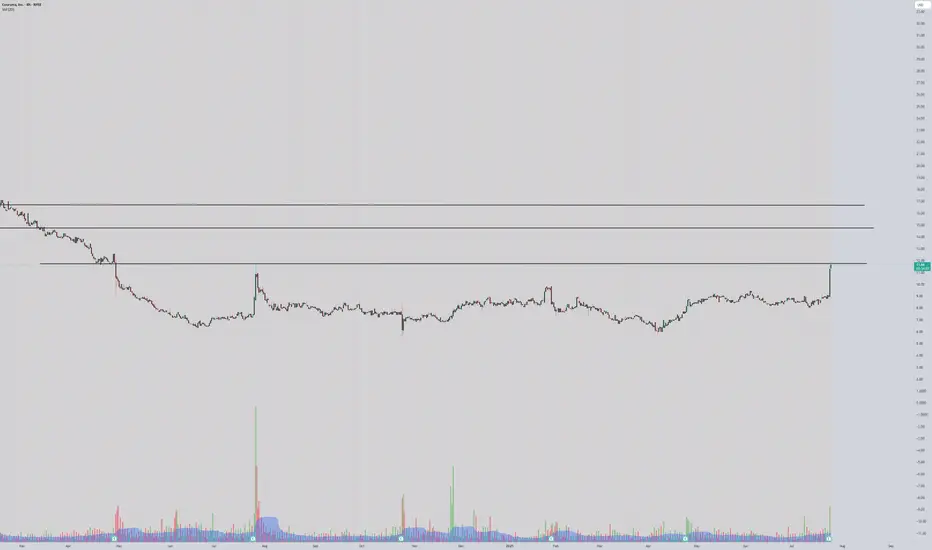
COUR ready to launch?Incredible chart and breakout approaching,
Above $12 we can see $16 in a few months, This can be a great addition to the long term account!
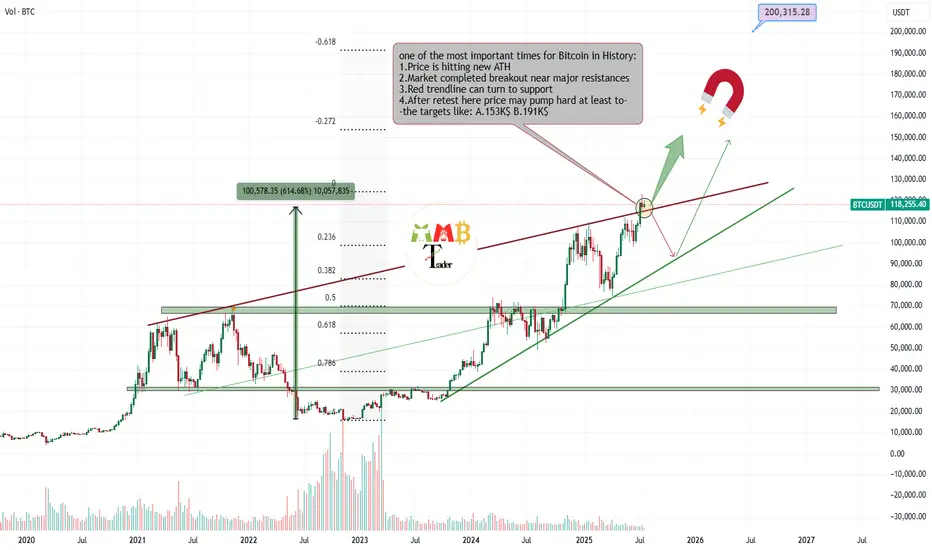
Bitcoin is retesting Critical zone for targeting almost 200K$Most traders around world now don't know what to do with their own trades or spot holdings, because some are in profit and how doubt of more pump and are still holding and some others miss this massive pump and think it can rest and fall now and it is not a good time to enter long.
And many other questions and thoughts At this time is simply check the chart and do these simple steps which are some mentioned and some not due to huge content.
Delete all of my previous drawings and start new Charting the price and see new trendlines or supports and resistances formed.
Then technically check the volume and breakouts and ... once again and here for Bitcoin i still find out chart looks extremely bullish to me and at this orange zone which is price is getting a little slow some important things may happen.
30% is expecting price fall below red trendline again and see short-term fall.
70% is expecting price complete retest of breakout here or pump more ASAP and then hitting targes like 150K$ and more for $BTCUSDT.
DISCLAIMER: ((trade based on your own decision))
<<press like👍 if you enjoy💚
Channel BreakoutThe Stock has given a channel breakout in April. It is currently in accumulation phase. Buy for the targets seen in the chart. Use a 1:3 risk reward ratio.
