GBPUSD Rebounds Strongly – Is the Uptrend Ready to Resume?Hello traders!
On the D1 chart, GBPUSD is showing a strong recovery after bouncing off the support zone around 1.33500–1.34500. This rebound happened right at the ascending trendline and the confluence with the EMA, reinforcing the strength of the bullish zone.
The overall bullish structure remains intact. As long as price stays above the trendline, I expect GBPUSD to continue its move toward the resistance area near the recent highs.
My strategy is to look for buying opportunities around the support zone or after a confirmation signal from price action following a minor pullback.
Good luck and happy trading!
Breakout

BITCOIN BULLISH WEDGE|LONG|
✅BITCOIN is trading in a
Strong uptrend and the coin
Has formed a massive bullish
Wedge pattern so we are
Bullish biased and IF we see
A bullish breakout we will
Be expecting a further
Bullish move up
LONG🚀
✅Like and subscribe to never miss a new idea!✅
Disclosure: I am part of Trade Nation's Influencer program and receive a monthly fee for using their TradingView charts in my analysis.

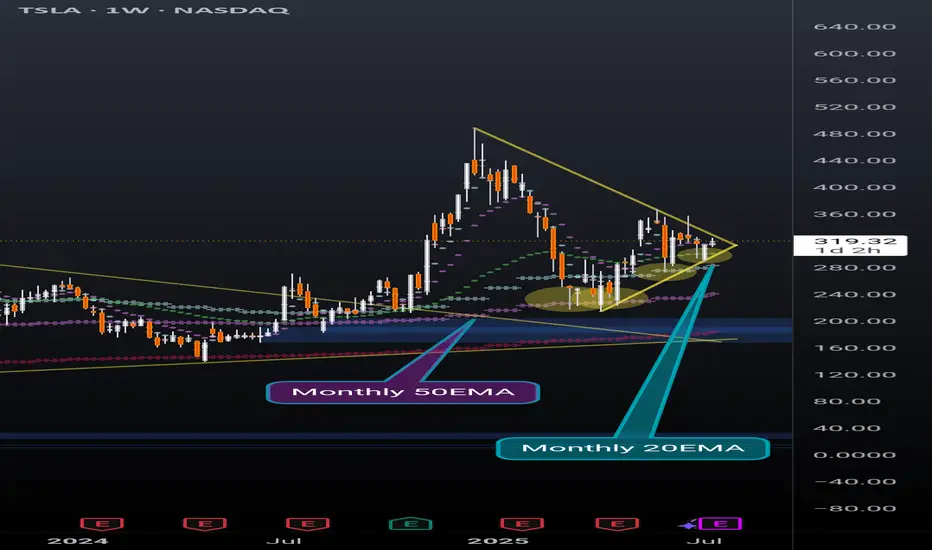
TSLA weekly coiling into something powerfulNever doubt the power of TSLA. Recently broke out of a huge pennant, and now nearing the end of another pennant while simultaneously holding support above the daily 20EMA(overlayed on this weekly chart).
Also recently found support off of the monthly 20EMA (overlayed on this weekly chart) and took 2 direct hits on the monthly 50EMA (overlayed on this weekly chart) before that and rallied up. It will take a lot to crush this setup but anything can happen. Possibly a longer pennant formation.
I'm just a cat not a financial advisor.
EUR-CAD Bullish Wedge! Buy!
Hello,Traders!
EUR-CAD is trading in an
Uptrend and the pair formed
A bullish wedge pattern and
Now we are seeing a bullish
Breakout from the wedge so
We are bullish biased and we
Will be expecting a further
Bullish move up
Buy!
Comment and subscribe to help us grow!
Check out other forecasts below too!
Disclosure: I am part of Trade Nation's Influencer program and receive a monthly fee for using their TradingView charts in my analysis.

Breakout on Vodafone?Looks like a Head and shoulders reversal, plus breakout this week. Too early to say though as it still needs confirmation. Could still be a fake-out?
This is not a solicitation to trade in Vodafone shares.

Breakout.POWER Analysis
Closed at 14.50 (24-07-2025)
Breakout.
a Very Strong Support seems to
be around 13.80 - 14.
Sustaining this level may lead it
towards 15 - 16.

Gold sets sights on 3,500 USD – will the rally continue?Hello traders, do you think gold will keep rising?
Today, OANDA:XAUUSD is trading around 3,380 USD after a slight pullback from the 5-week high of 3,438 USD reached on Tuesday. Despite this short-term dip, the overall trend remains bullish, supported by both technical structures and market expectations.
On the news front, the US Dollar Index (DXY) has dropped to 97.4 – its lowest level in weeks. This reflects growing expectations that the Federal Reserve may cut interest rates by the end of the year, as recent data points to slowing inflation and weakening consumer spending. A softer dollar typically strengthens gold’s appeal.
From a technical perspective, the daily chart reveals a clear bullish structure supported by the rising trendline and the EMA34 and EMA89. Price is consolidating just above the trendline, forming a potential bullish continuation pattern. The resistance zone near 3,440 USD is being repeatedly tested – and if gold breaks out with strong volume, the path toward 3,500 USD could open up quickly.
From my perspective, I expect gold to make new highs above this level soon. What’s your take? Drop your thoughts in the comments!

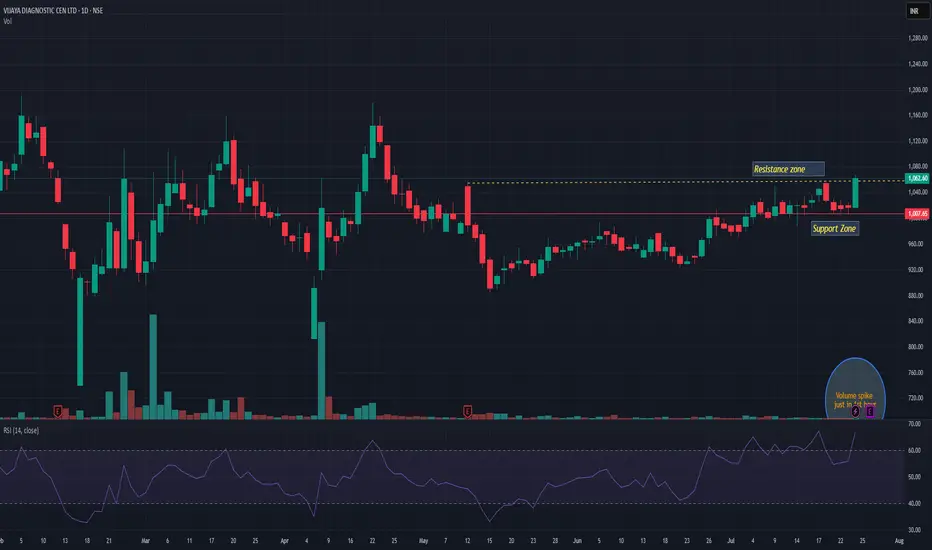
VIJAYAVIJAYA giving trendline breakout with decent volume. Q1 result is on 28th July may push momentum rally. Support seems near 1005 level. We may see momentum up to 1170 in coming days. Keep it on radar.
BTCUSDT pauses before the next big moveAfter a strong breakout in early July, BTCUSDT is now consolidating within a clear range between 116,000 and 120,000 USD. The price has repeatedly bounced from the bottom and faced rejection at the top, forming a well-defined sideways pattern on the H4 chart.
The EMA34 and EMA89 are providing solid support to this accumulation phase. If the 116,000 support zone holds and volume confirms, Bitcoin could resume its previous uptrend and aim for the 124,000 level.
At the moment, this looks like a “breather” zone before the market picks its next direction.
Personally, I’m still expecting another bullish leg—how about you?

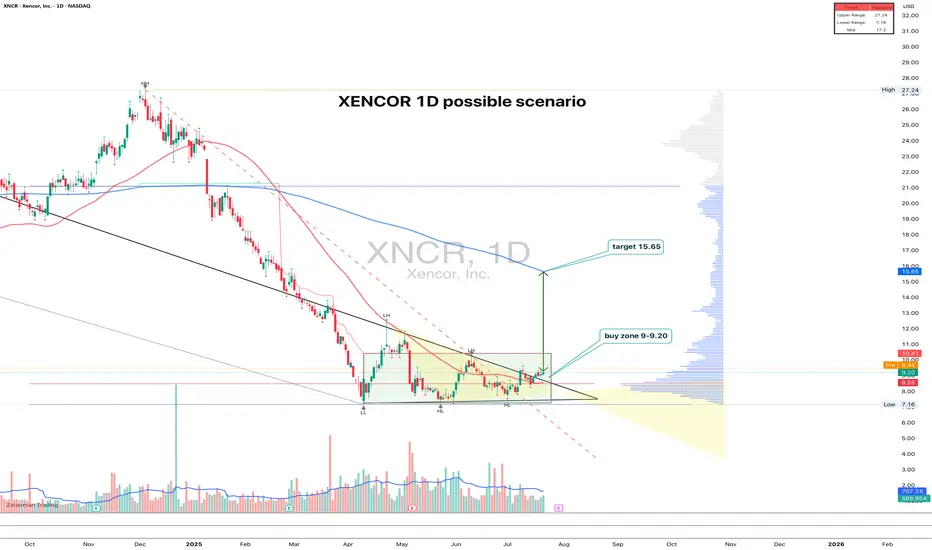
XNCR 1D time to growth?XNCR: the uptrend hasn't started yet - but someone's quietly accumulating
XNCR spent nearly 4 months building a base and finally broke out of consolidation with a clear upward move. The pattern looks like a range with a narrowing triangle at the bottom — the breakout came with rising volume. Entry makes sense in the 9.00–9.20 zone on a retest. Volume profile and Fib levels confirm the importance of this area, plus there’s a clean support shelf at 9.00. The target is 15.65, which aligns with the height of the structure. The 200-day MA is still above price, but a push beyond 11.00 could open the door to acceleration.
Fundamentally, Xencor is a biotech company focused on monoclonal antibodies. After a tough 2023–2024 and cost reductions, the market is beginning to price in signs of recovery. Key partnerships remain intact, the pipeline is alive, and recent data for XmAb7195 was well received at industry events. Valuation remains low, and biotech ETF flows are slowly picking up.
Still a relatively low-volume name, but the structure is clean, the setup is readable, and fundamentals are turning. With a tight stop below 8.50, the risk-reward looks solid.
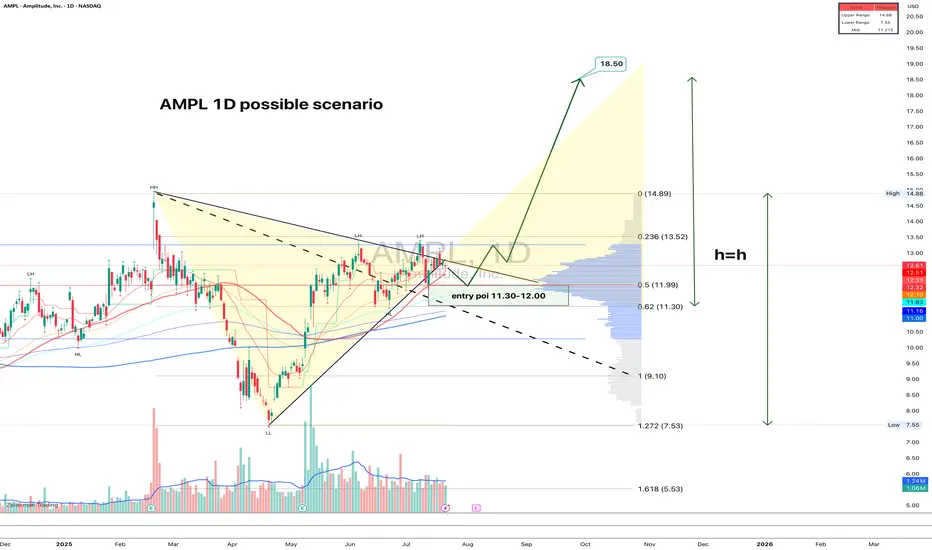
AMPL: structure clean, volume right, fundamentals warming upAMPL just broke out of a symmetrical triangle on the daily chart. The breakout was confirmed with decent volume, and now price is calmly pulling back into the 11.30–12.00 zone — exactly the kind of textbook retest that gets serious traders interested. The 0.618 Fib level sits at 11.30, and 0.5 at 11.99, strengthening this entry area. Volume has tapered off post-breakout, which is typical before a continuation. Moving averages are stacked bullish, confirming the trend shift. First upside target is 13.52, followed by 14.89, and if the full h = h move plays out, price could reach 18.50. A natural stop sits just below 11.00. Clear structure, solid risk control — this is one of those setups that checks all the boxes.
On the fundamental side, Amplitude remains a key player in product analytics and digital optimization. After a slow 2024 marked by cost-cutting and stagnating revenue, the company is showing early signs of recovery this year. The broader SaaS market has stabilized, and AMPL is benefiting from renewed enterprise demand, especially for AI-driven user behavior analytics. Recent earnings came in better than expected, and institutional interest has quietly returned. Valuation is still moderate at these levels, giving it room to re-rate if momentum builds.
A clean breakout with technical alignment and an improving macro picture - when both sides of the story match, it's worth paying attention.
Gold Surges to Five-Week High Amid Growing UncertaintyHello everyone! Let’s take a closer look at XAUUSD today.
Gold prices have rallied strongly, breaking above the 3,400 USD level and currently hovering around 3,420 USD — up 1.2% in the past 24 hours, equivalent to a gain of 34.7 USD.
This surge marks the highest level in five weeks, driven by heightened uncertainty surrounding U.S. President Donald Trump's looming August 1 tariff deadline. With tensions rising, gold is likely to remain on an upward trajectory. The immediate resistance stands at 3,420 USD per ounce, while support is seen near 3,350 USD.
Investors are also eyeing next week’s Federal Reserve policy meeting, where rates are expected to stay unchanged — but a rate cut could come as early as October. Meanwhile, the U.S. dollar continues to face renewed pressure heading into August, a factor that may further boost gold’s appeal.
Do you think gold will keep rising from here? Drop your thoughts in the comments — and good luck with your trades!

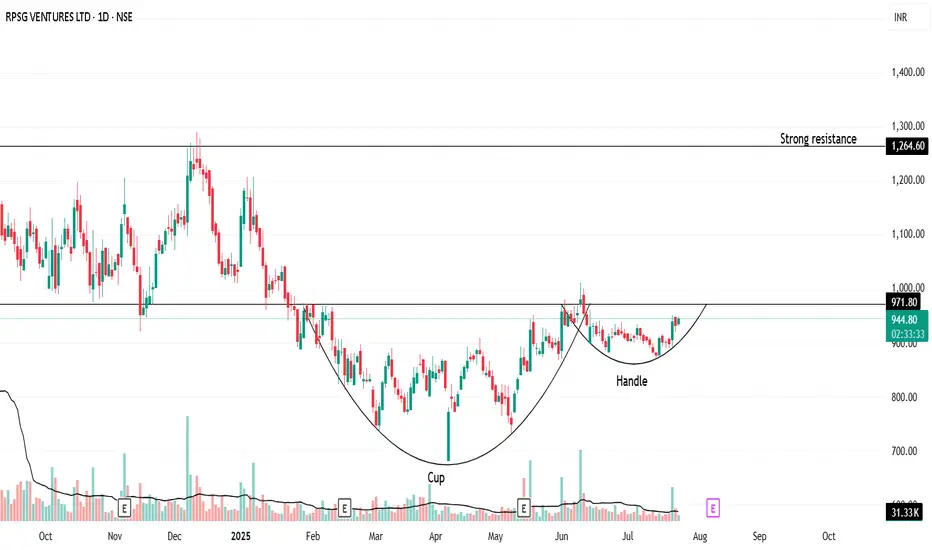
"Handle Tightening… Is RPSG Ready to Explode?"Once upon a trend, RPSG Ventures brewed a picture-perfect Cup & Handle—a structure born not out of coincidence, but crowd psychology and silent accumulation.
After nearly 9 months of consolidation, the stock crafted a deep, symmetrical cup (between November 2024 and May 2025). Traders forgot about it. Volumes dried. Hope faded.
But quietly, the handle formed—short, shallow, and tight. It’s not just a chart pattern—it’s a test of patience. And now, the breakout zone at ₹971.80 is like the rim of a boiling kettle: silent… until the whistle.
🧭 Possible Future?
If it breaks out: A rally toward ₹1,264 isn't just possible—it’s logical.
If it fakes out: Back to base, retest near ₹890.
💬 What makes this unique?
This isn’t just technical analysis. It’s a behavioral pattern. Fear, exhaustion, optimism—they're all baked into this structure. Cup & Handle isn’t bullish because of lines—it's bullish because it reflects crowd hesitation turning into confidence.
🚨 "Spill or Serve?" — comment below .
🧠 Watch the volume.
🛑 Don't jump the gun.
✅ Let the breakout come to you.
📜 Disclaimer:
This is not trading advice—this is pattern psychology in motion. Always consult your financial advisor before making real trades. This story is meant to provoke thought, not profits.
Euro Surges as Dollar Falters Amid Political TensionsThe EUR/USD pair is experiencing a strong rally, breaking above the 1.1760 level — its highest point in two weeks as of Tuesday. This sharp move not only signals the Euro’s recovery strength but also highlights the impact of heavy selling pressure on the US dollar.
The driving force? Ongoing trade tensions, coupled with rising uncertainty surrounding the escalating feud between President Trump and Fed Chair Jerome Powell, are shaking investor confidence in the stability of US monetary policy.
As a result, the dollar is losing its safe-haven appeal, paving the way for EUR/USD to climb higher. If this bullish momentum holds, the next key target for the pair could be around 1.1800.

ARKK: when a breakout isn’t just a breakout-it’s a runway to $91On the weekly chart, ARKK has broken out of a long-standing ascending channel, ending a year-long consolidation phase. The breakout above $71.40, with a confident close and rising volume, signals a transition from accumulation to expansion. The move came right after a golden cross (MA50 crossing MA200), further confirming institutional interest. Price has already cleared the 0.5 and 0.618 Fibonacci retracements — and the 1.618 extension points to $91.40 as the next technical target.
Momentum indicators like MACD and stochastic remain bullish with room to run. Volume profile shows low supply above $75, which could fuel an acceleration toward the target zone.
Fundamentally, ARKK remains a high-beta, high-risk vehicle — but one with focus. The ETF is positioned around next-gen tech: AI, robotics, biotech, and automation. Assets under management now exceed $9.3B with +$1.1B net inflow in 2025. YTD return stands at 37%, and its top holdings (TSLA, NVDA, COIN) are back in favor. This isn’t just a bet on innovation — it’s diversified exposure to a full-blown tech rally.
Tactical setup:
— Entry: market $69.50 or on retest
— Target: $80.21 (1.272), $91.40 (1.618 Fibo)
Sometimes a breakout is just technical. But when there’s volume, a golden cross, and billions backing it — it’s a signal to buckle up.

GMDC, Long 1D, Breakout, VolumesGMDC has shown a good volume in the stock today and has taken support from the previous low. If it breaks its recent high of 428 with Bullish candlestick patterns like Bullish Engulfing, Hammer & Inverted Hammer, Piercing Line, Morning Star, Three White Soldiers, Tweezer Bottoms or Bullish Harami, then take a long trade on this stock.
Entry: 428 (on Bullish candlestick pattern)
Target1: 445
Target2: 450 till 480.

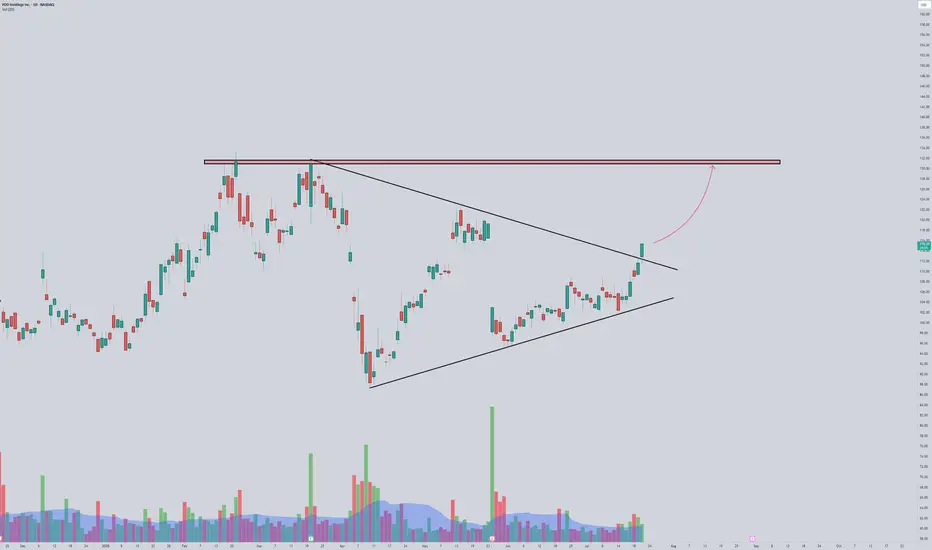
PDD Monster breakoutThis chart looks insanely good.
To go with the breakout there was today a 1.5M order for November, 135c.
I am looking to buy dips on this name!
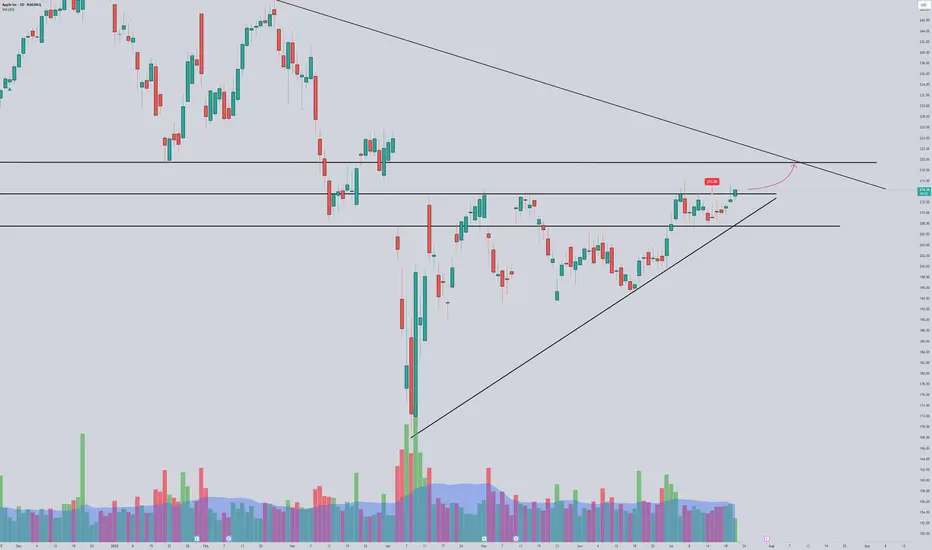
AAPL next leg up?A daily close above 213.75 could set AAPL to move towards 220
We are retesting some strong resistance at 215, and above it we could see price moving faster to retest trendline.
Keeping this on the watch as ERs is not far and we can see a pre run
Intriguing setupOn 7/21 a OTM call flow came in for 114c expiring this Friday July 25th
Almost $130k in calls on a strike that has very low OI.
We have a beautiful gap above and a possible flag break in very low volume today.
Also, ER on thursday.
Do they know something??
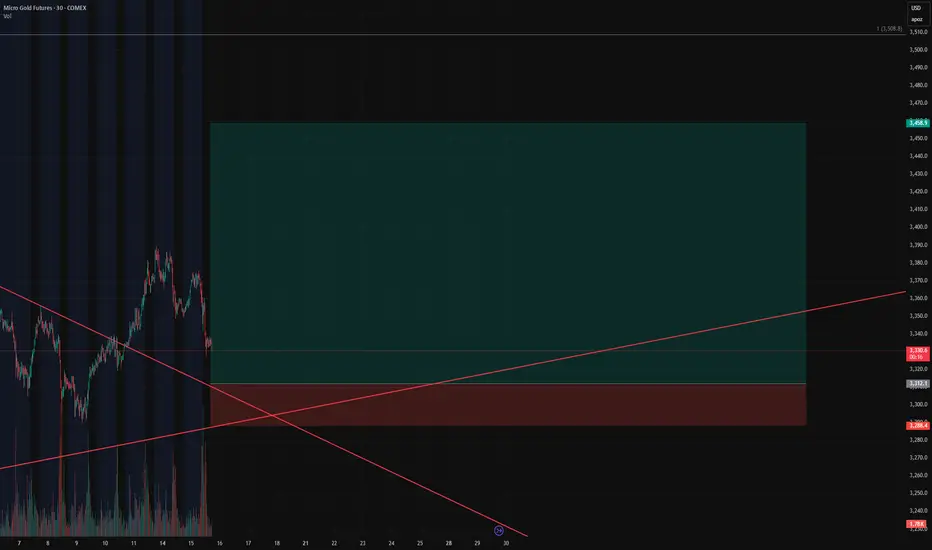
Gold Bulls Loading Up – Our Short Squeeze Trigger is Set!🚨 Gold Bulls Loading Up – Our Short Squeeze Trigger is Set!
We’re flipping the script on COMEX_MINI:MGC1! After a prolonged downtrend and textbook wedge compression, our breakout long is LIVE – but not without trapping the late shorts first.
💥 Entry: $3,312.1
🛑 Stop: $3,288.4
🎯 Target: $3,458.9
🧮 Risk/Reward: 6.19
Price just bounced at the retest of the wedge apex, and volume is confirming the move. If this holds, we’re riding momentum all the way up – and letting short pressure fuel the breakout.
📈 Trendline breached.
⏳ Time compression converging.
⚠️ If you’re still short, watch your stops!
NYKAA<>BreakoutA breakout is occurring with increasing volume. A high-volume close above the 221-222 level would confirm the breakout, potentially from a Cup & Handle pattern.
Keeping on radar.

Denta Water & Infra Solutions Ltd <>Returns Chart shared on July 16th has already yielded a 20%+ return. Analysis suggests the stock should consolidate at its current high level after the recent steep rise, followed by a potential breakout.

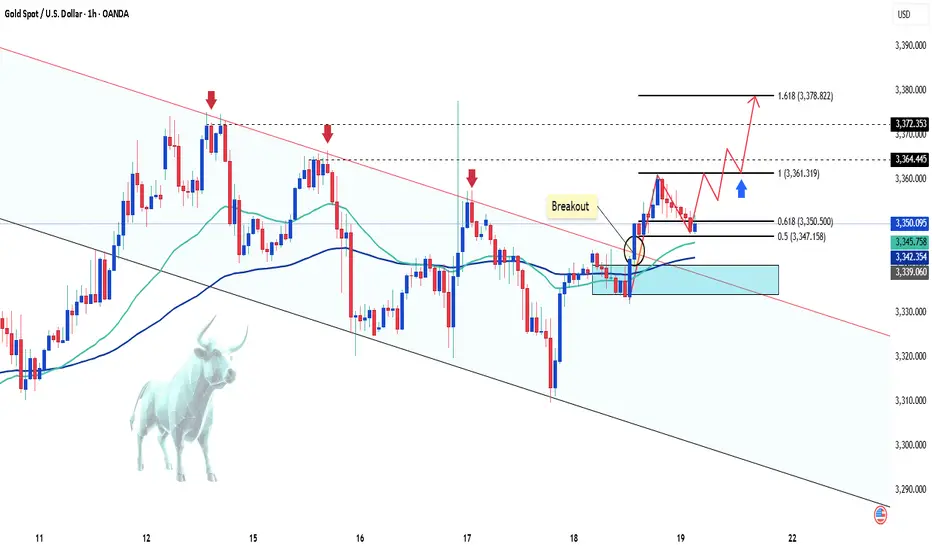
Gold Sees Mild Increase as USD WeakensGold ended Friday's session with a slight increase, regaining the 3350 USD level and recovering over 100 pips by the end of the day.
The weakening of the US Dollar (USD) allowed XAU/USD to rise modestly. Concerns about US President Donald Trump's erratic trade policies and their potential impact on the global economy further supported the precious metal.
In the short term, the technical chart shows gold breaking out of the downward channel and starting an upward wave. The price is currently adjusting at 3350 USD, which coincides with the 0.618 Fibonacci retracement level and the EMA zone, suggesting the potential for further price increases from this level, with targets towards key resistance levels.
Key resistance levels: 3160, 3172, and 3378 USD.
Support zones: 3350, 3340, 3331 USD.